-
Notifications
You must be signed in to change notification settings - Fork 8
Example 3: Find the biological role of your network
Some biological analysis tools give a network as a result. The next step in these cases is to identify the biological functions behind it. In the following line we describe how to do a Gene Ontology Enrichment Analysis to gain insight into the function of your network. The network we will study can be downloaded here
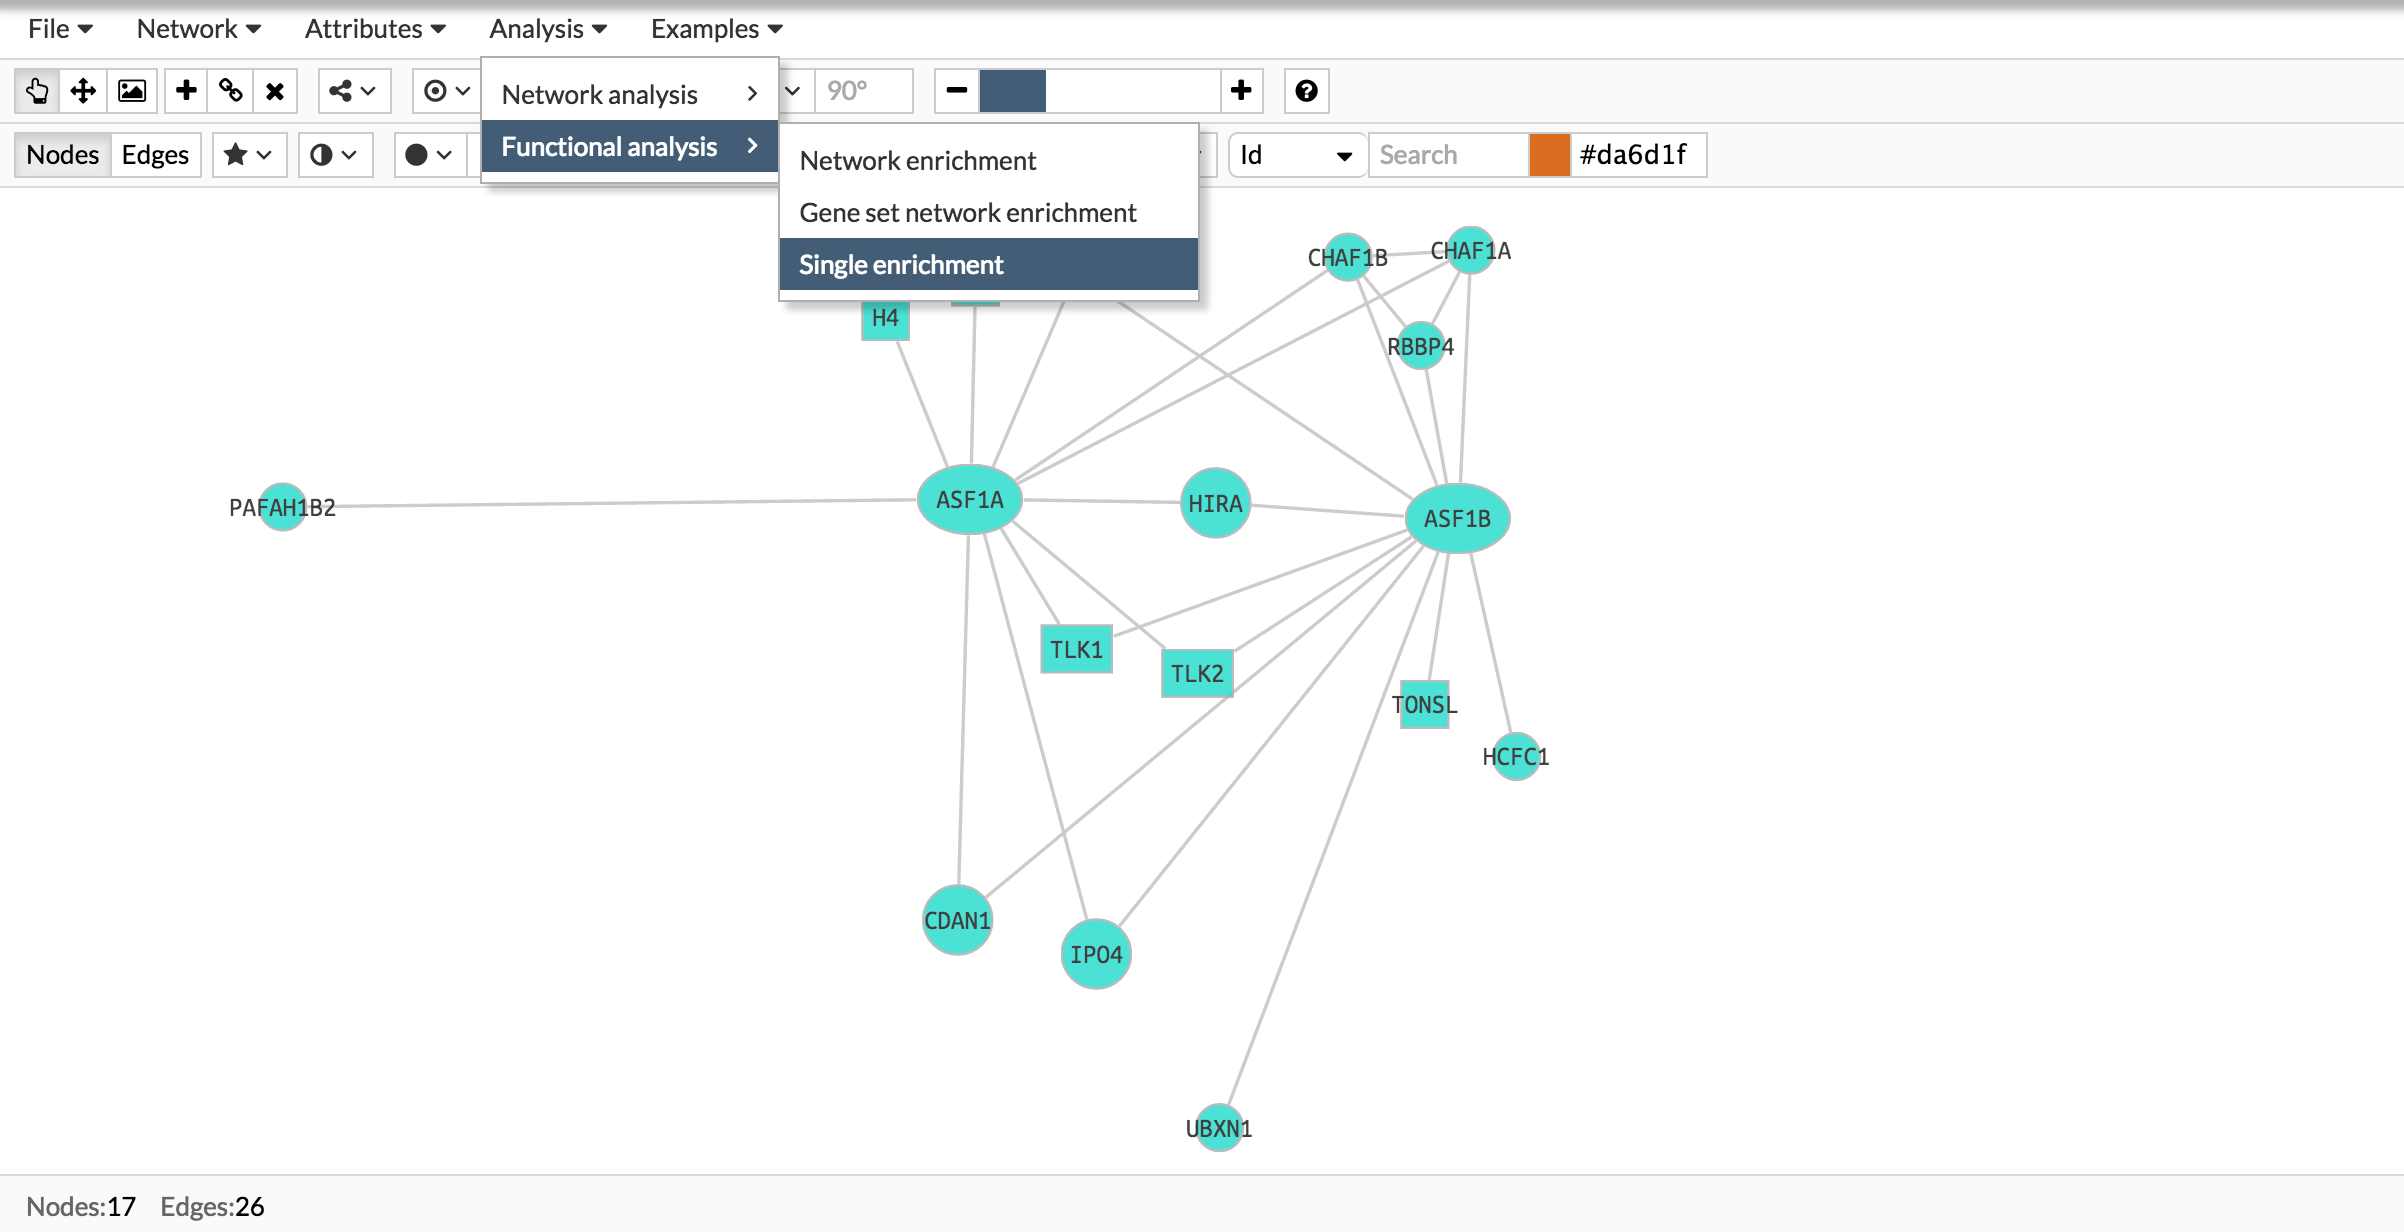
Load your network and open Analysis > Functional > Single Enrichment
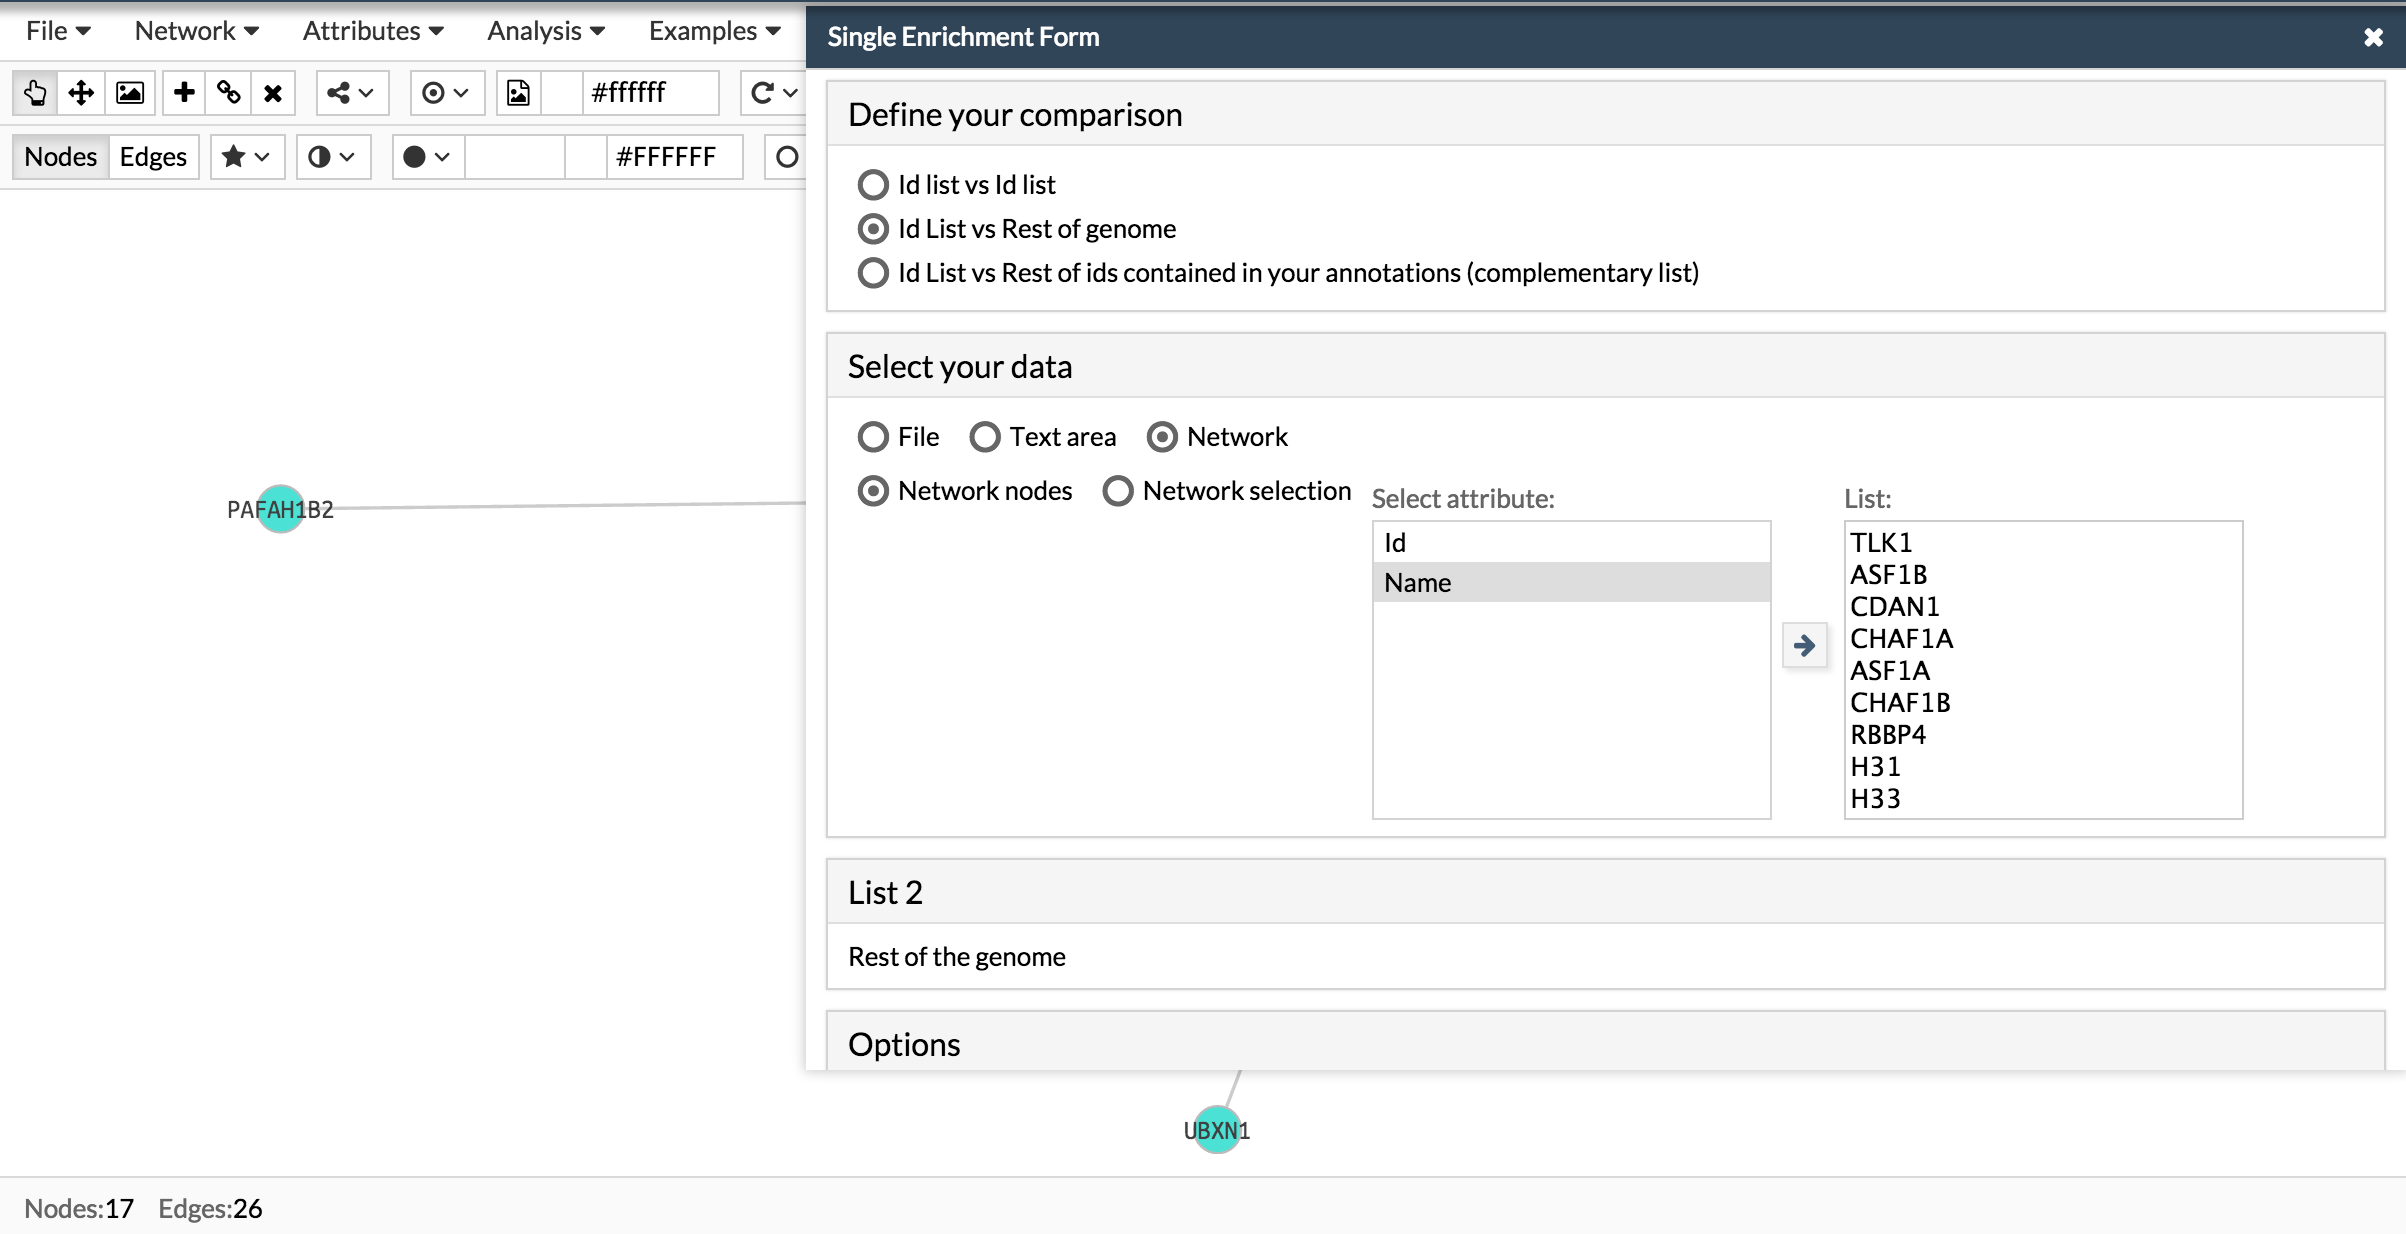
First, select compare a list versus the whole genome analysis. If instead of using the whole genome as a reference space you have another reference, choose list 1 versus list 2 and upload the list of genes or proteins from your referente space.
Secondly, select the genes you want to study for enrichment. In this case are all the nodes from your network but it can be a subset.
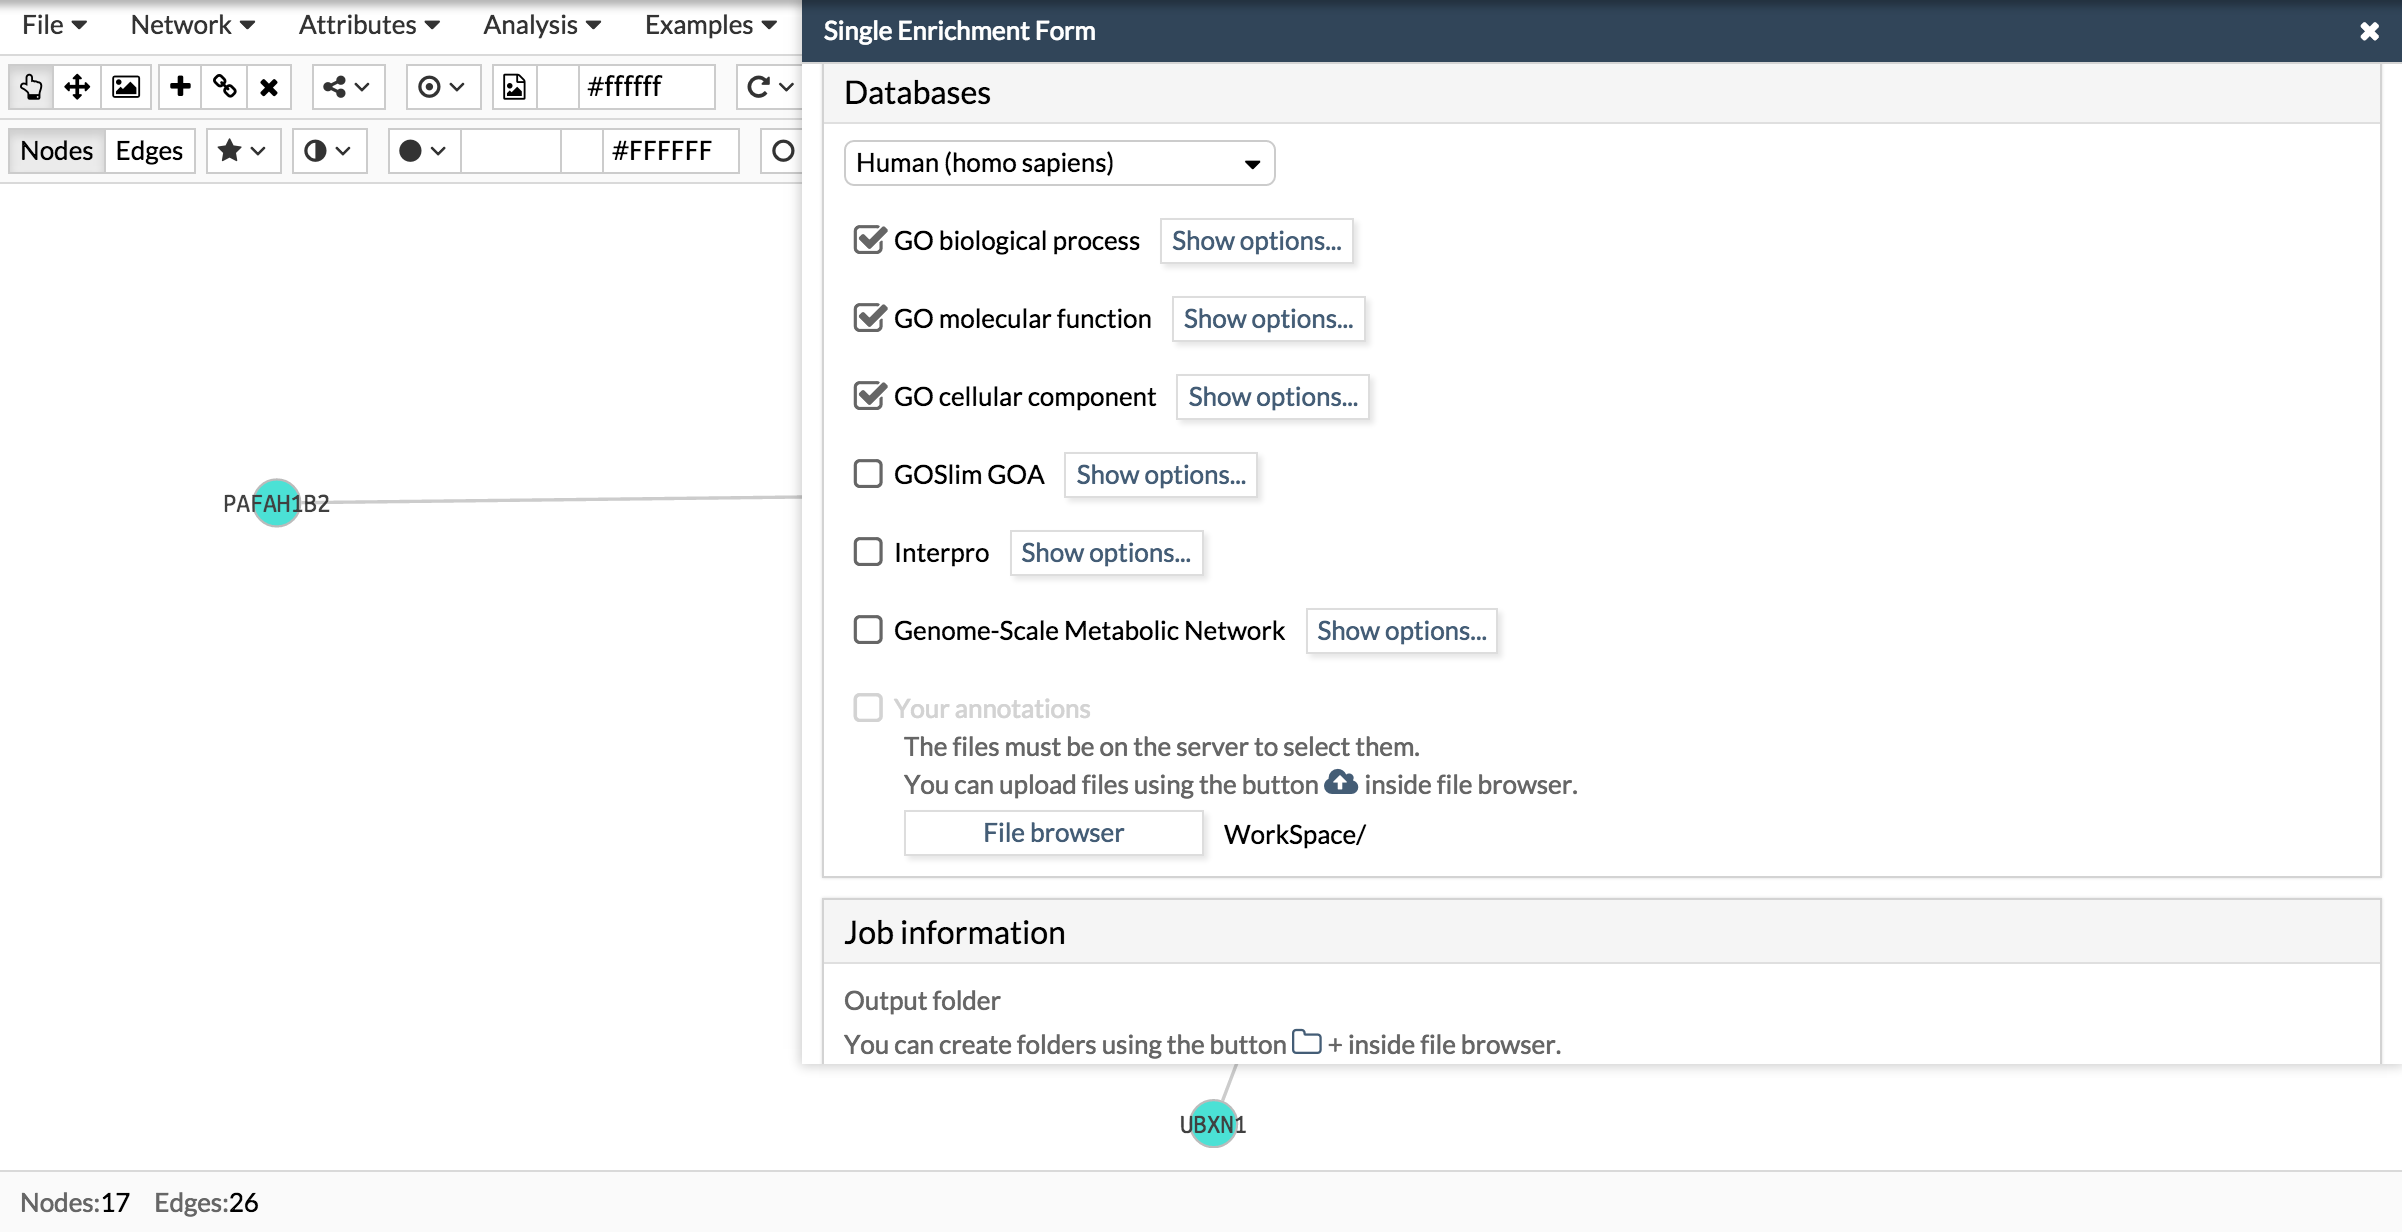
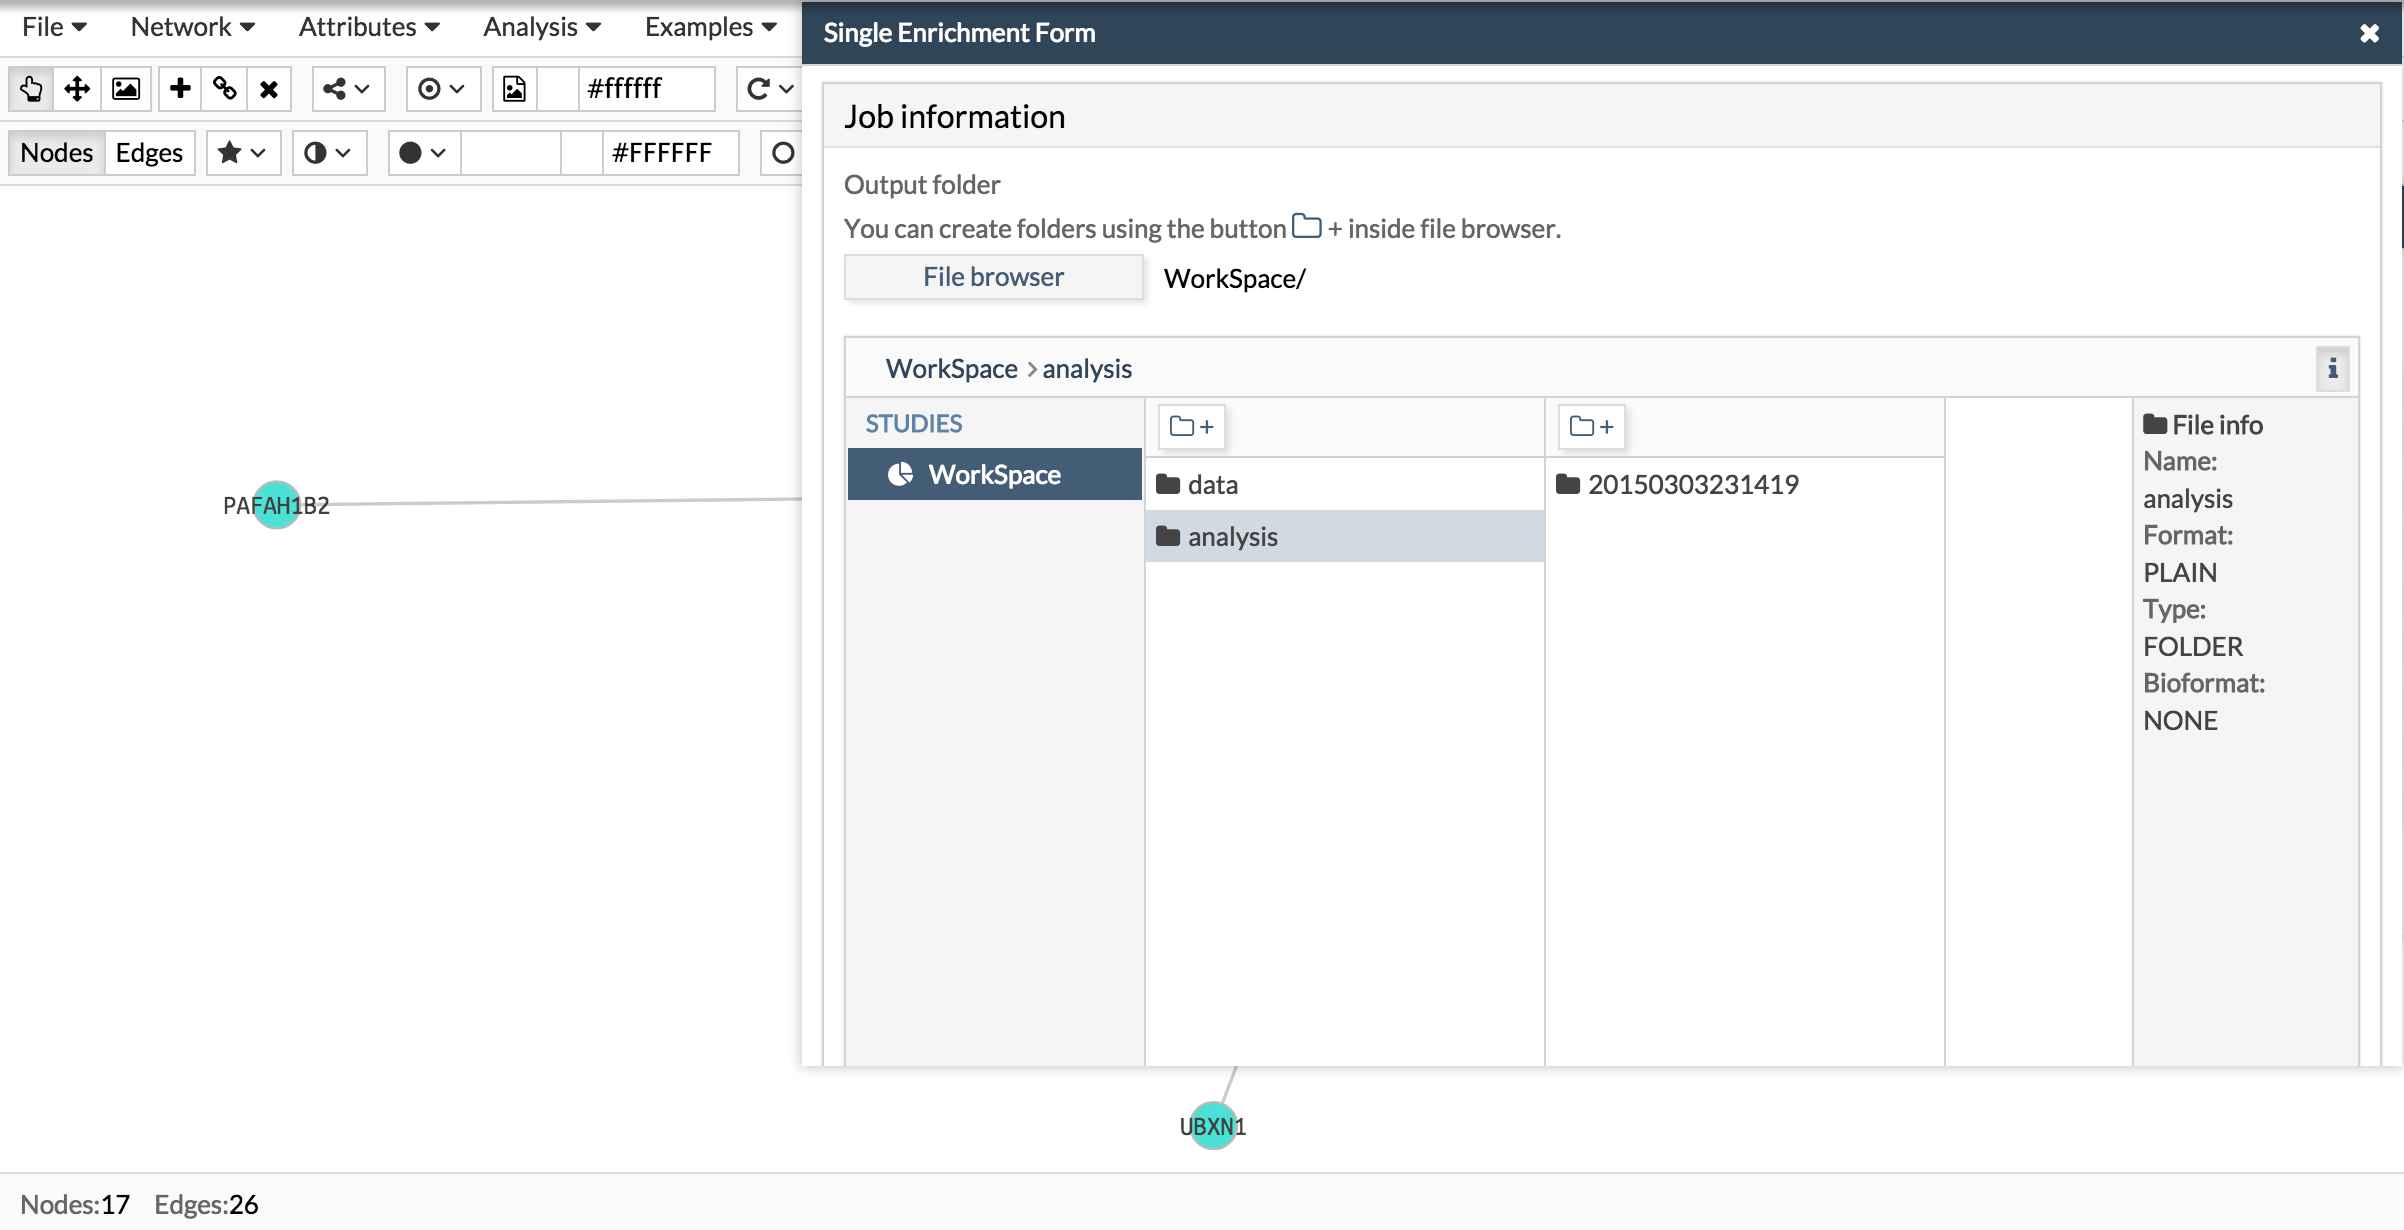
Select the output folder in the workspace where the results are going to be saved.
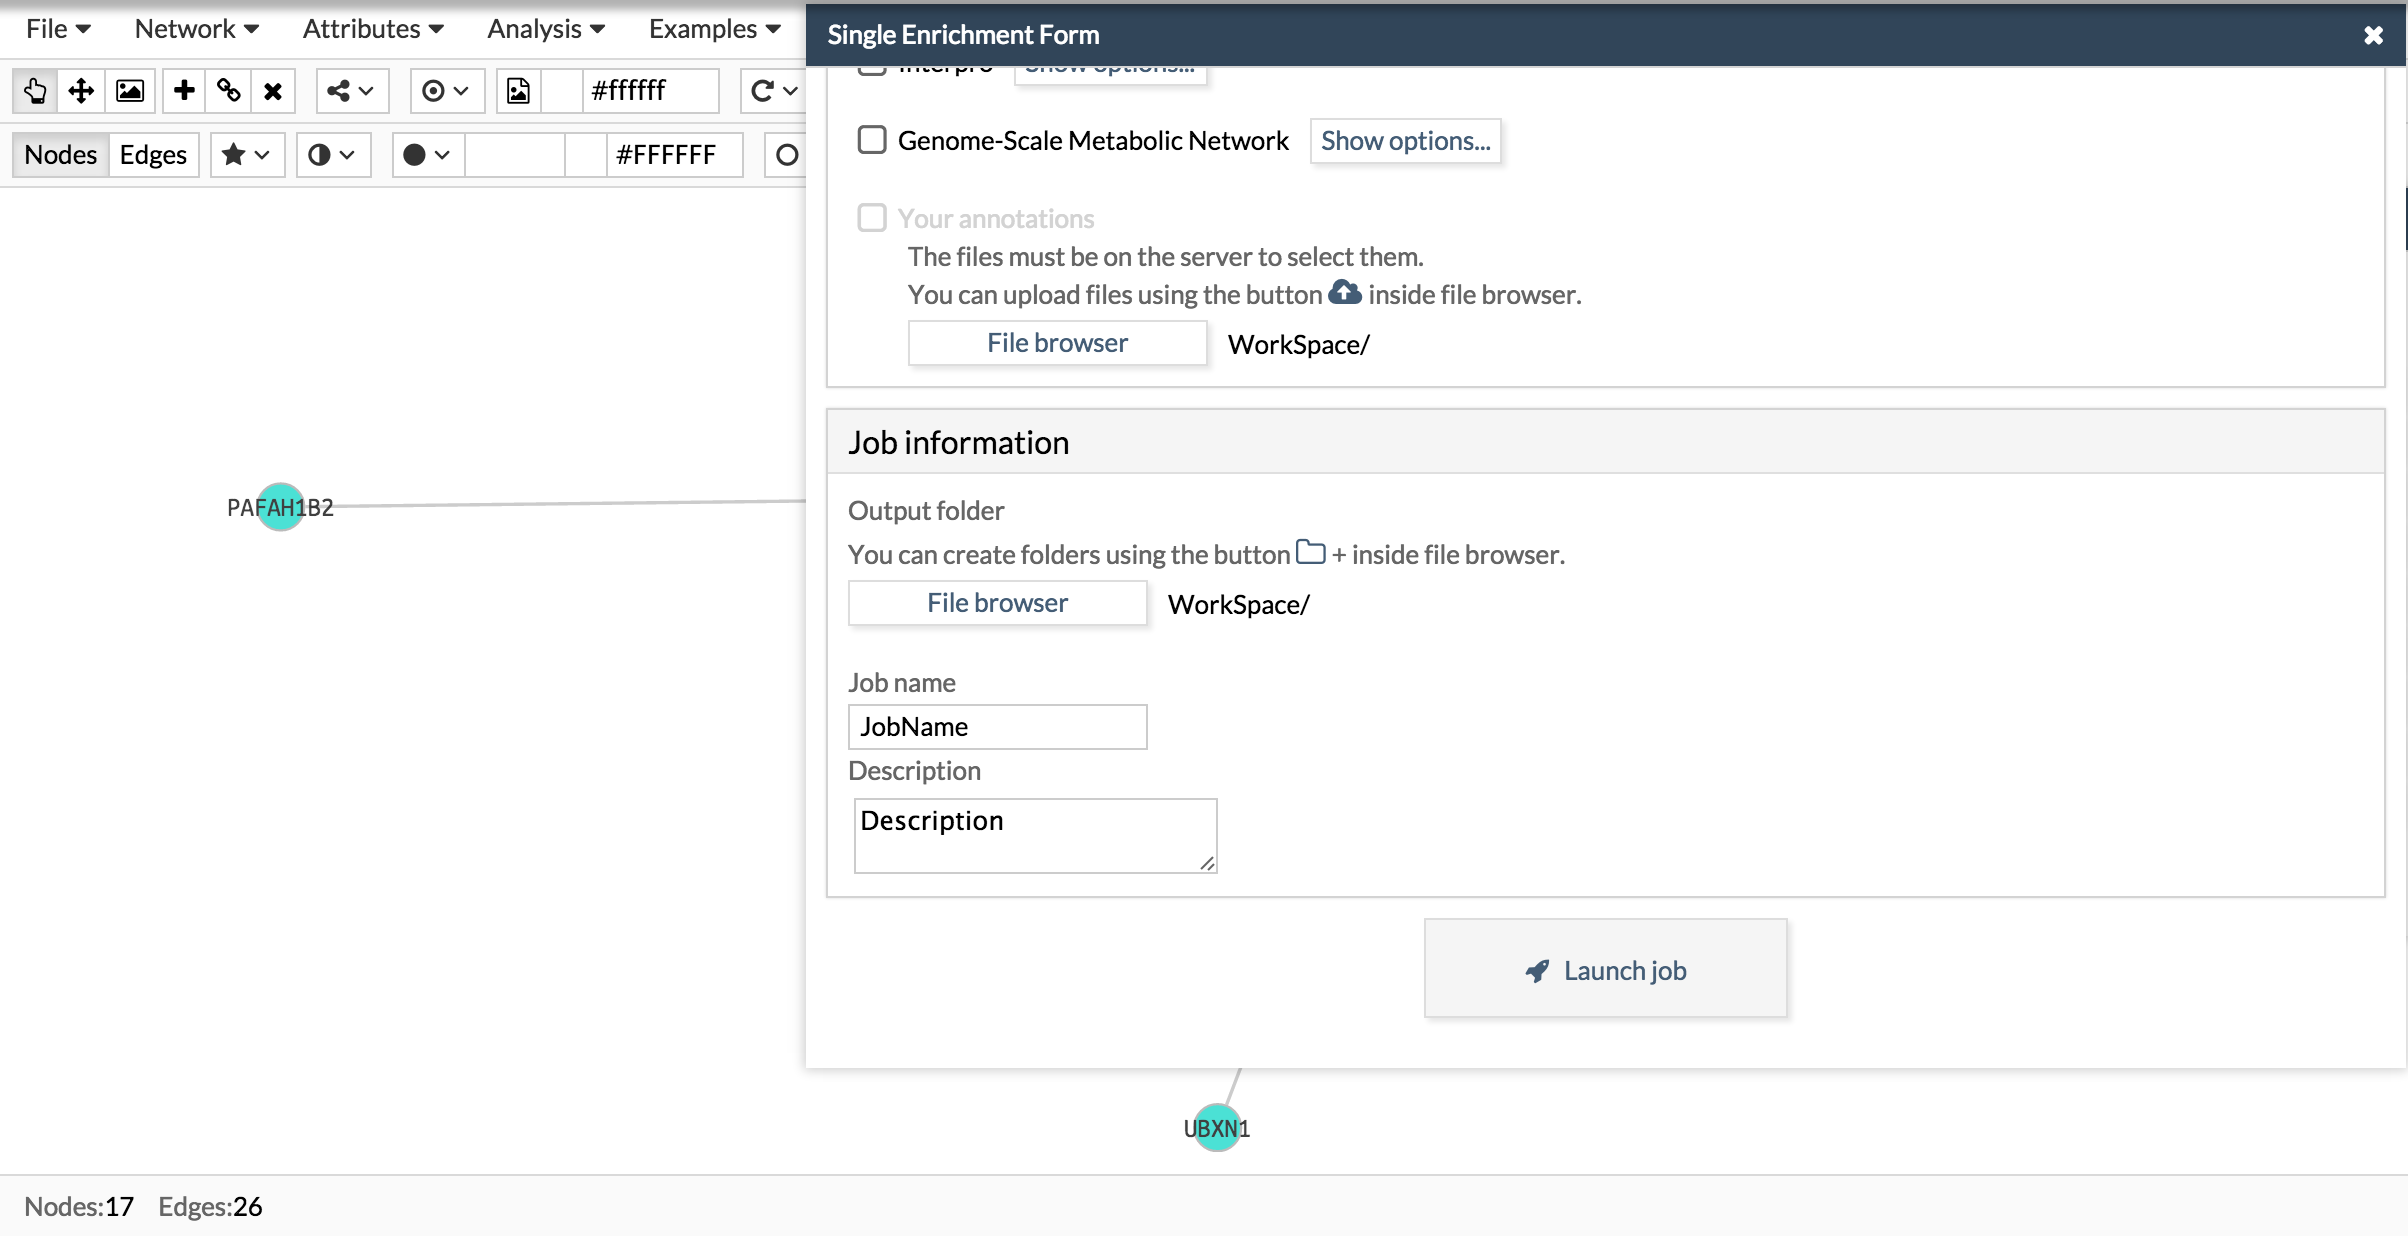
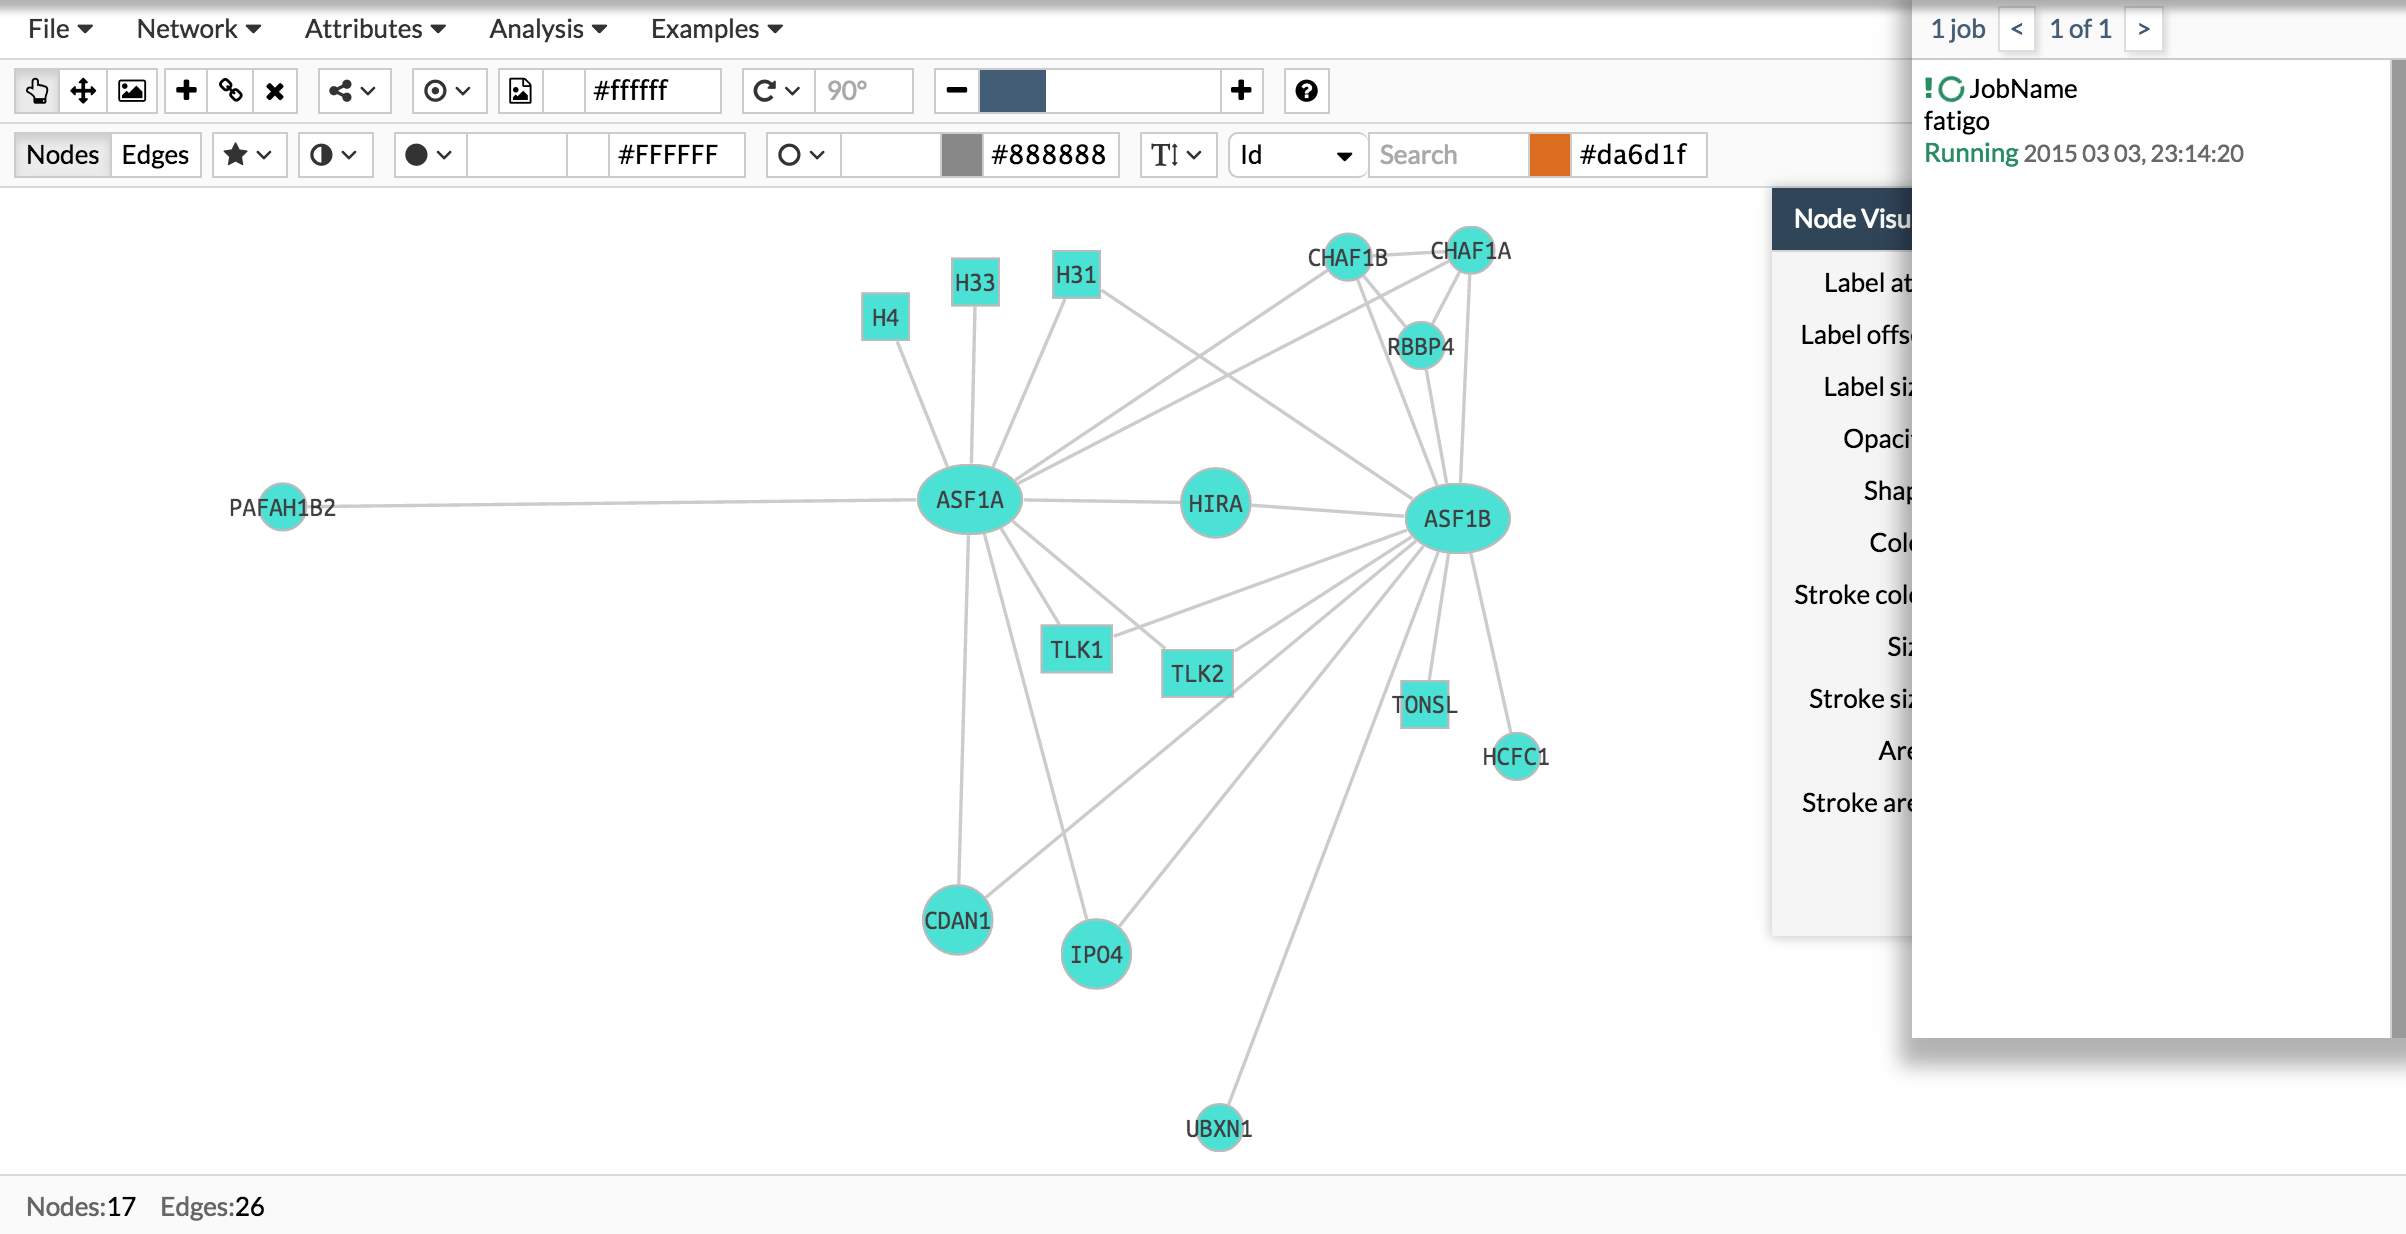
Go to the Jobs button in the upper right side of the blue header and a new panel will appear with all the jobs that you have launched.
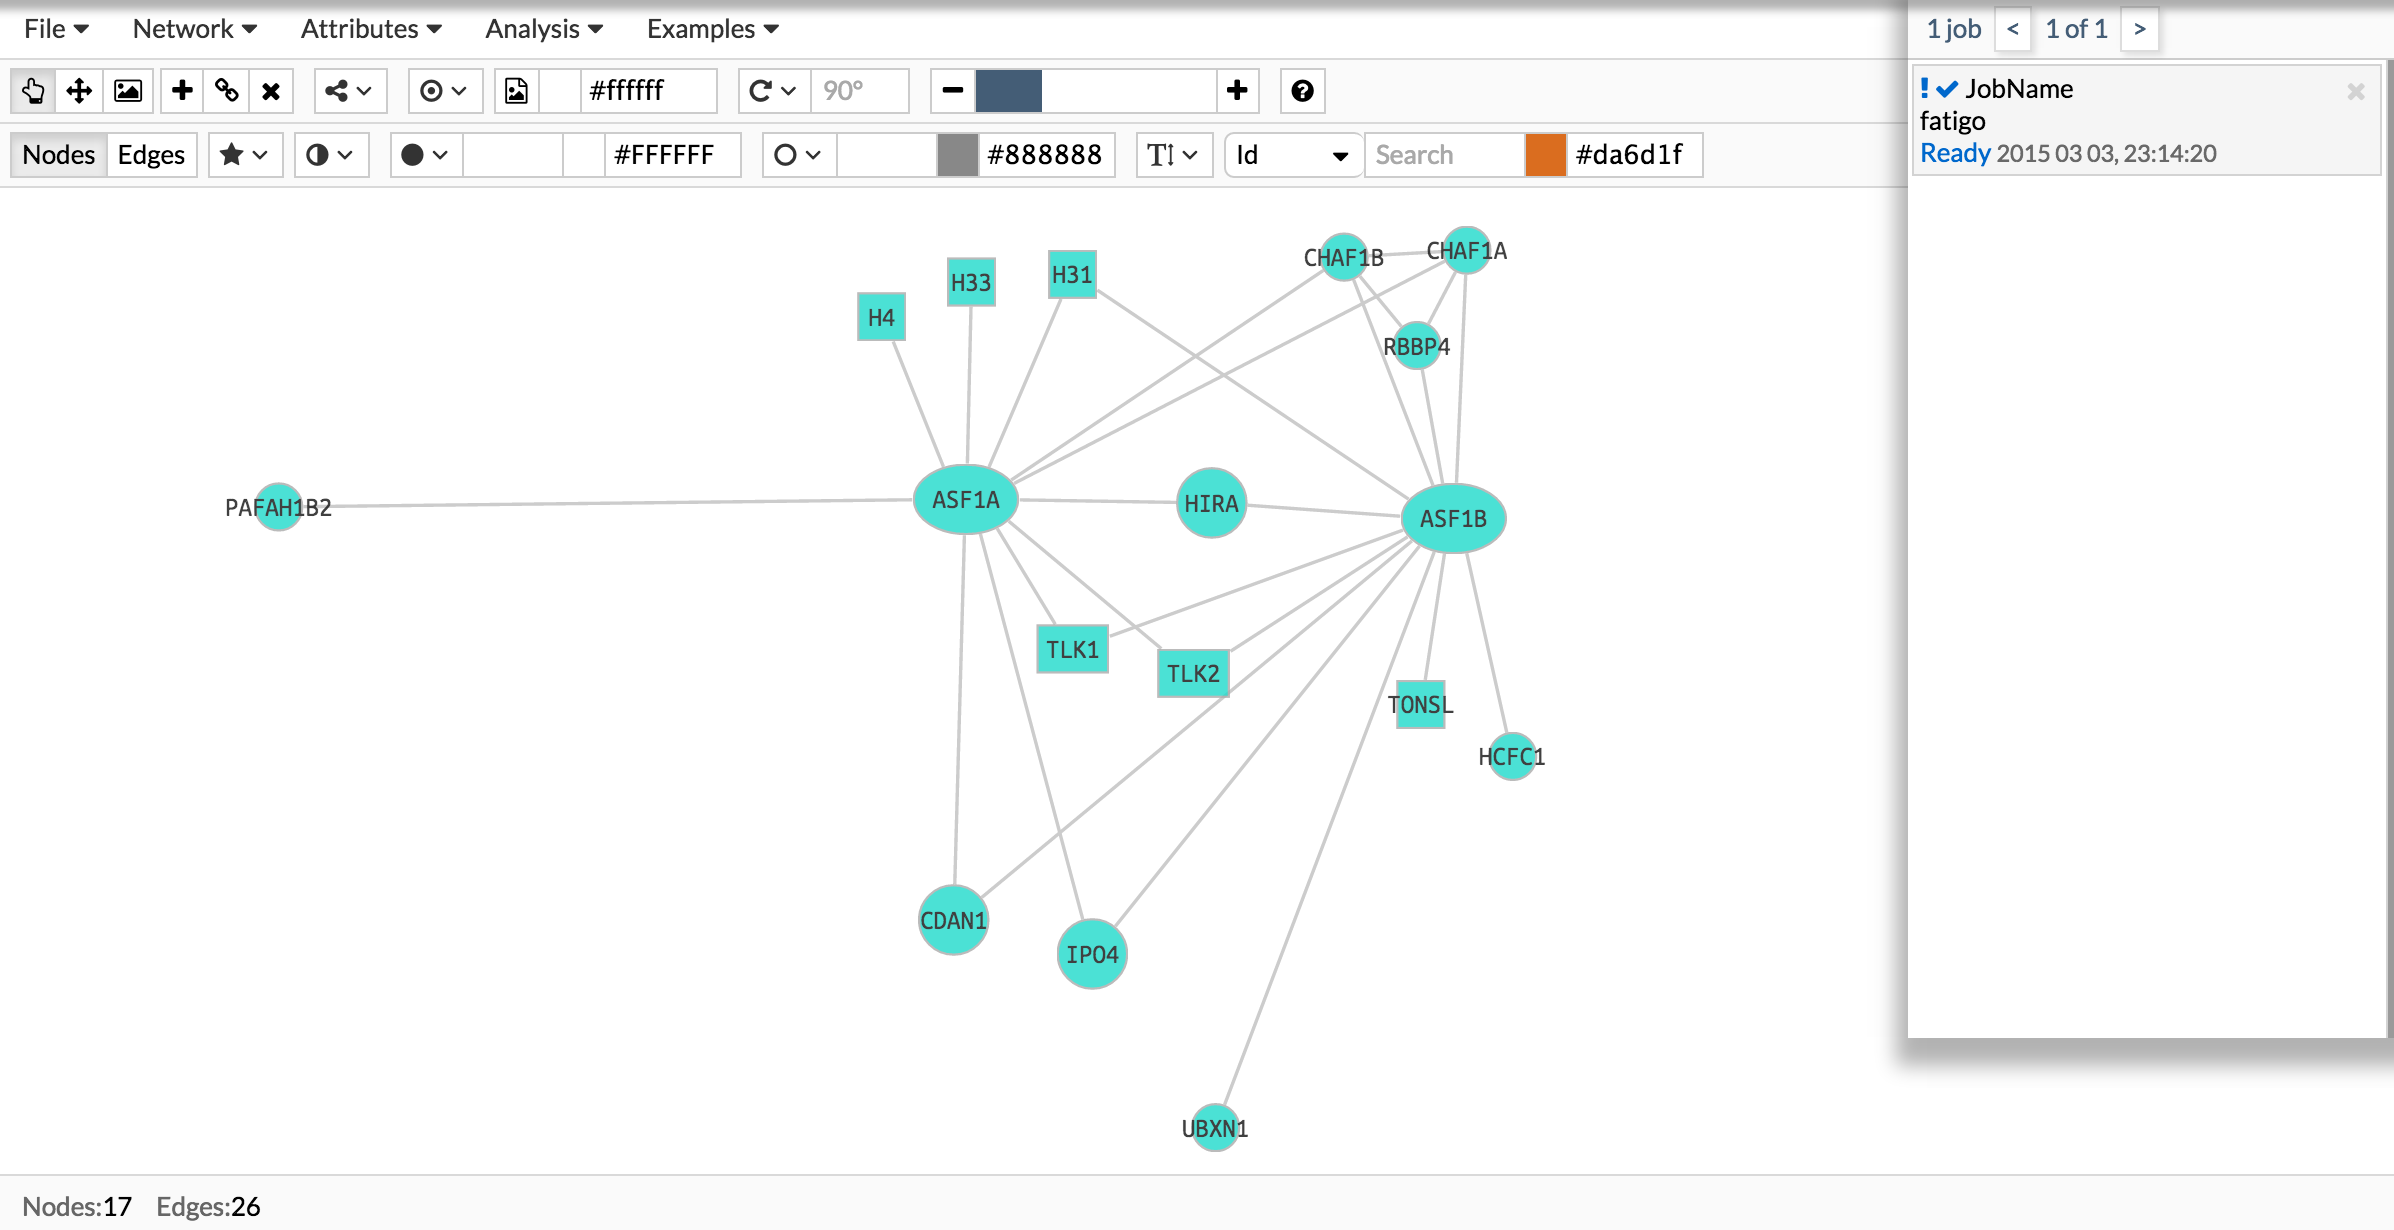
When the analysis finished, the job will be labelled as "Ready"
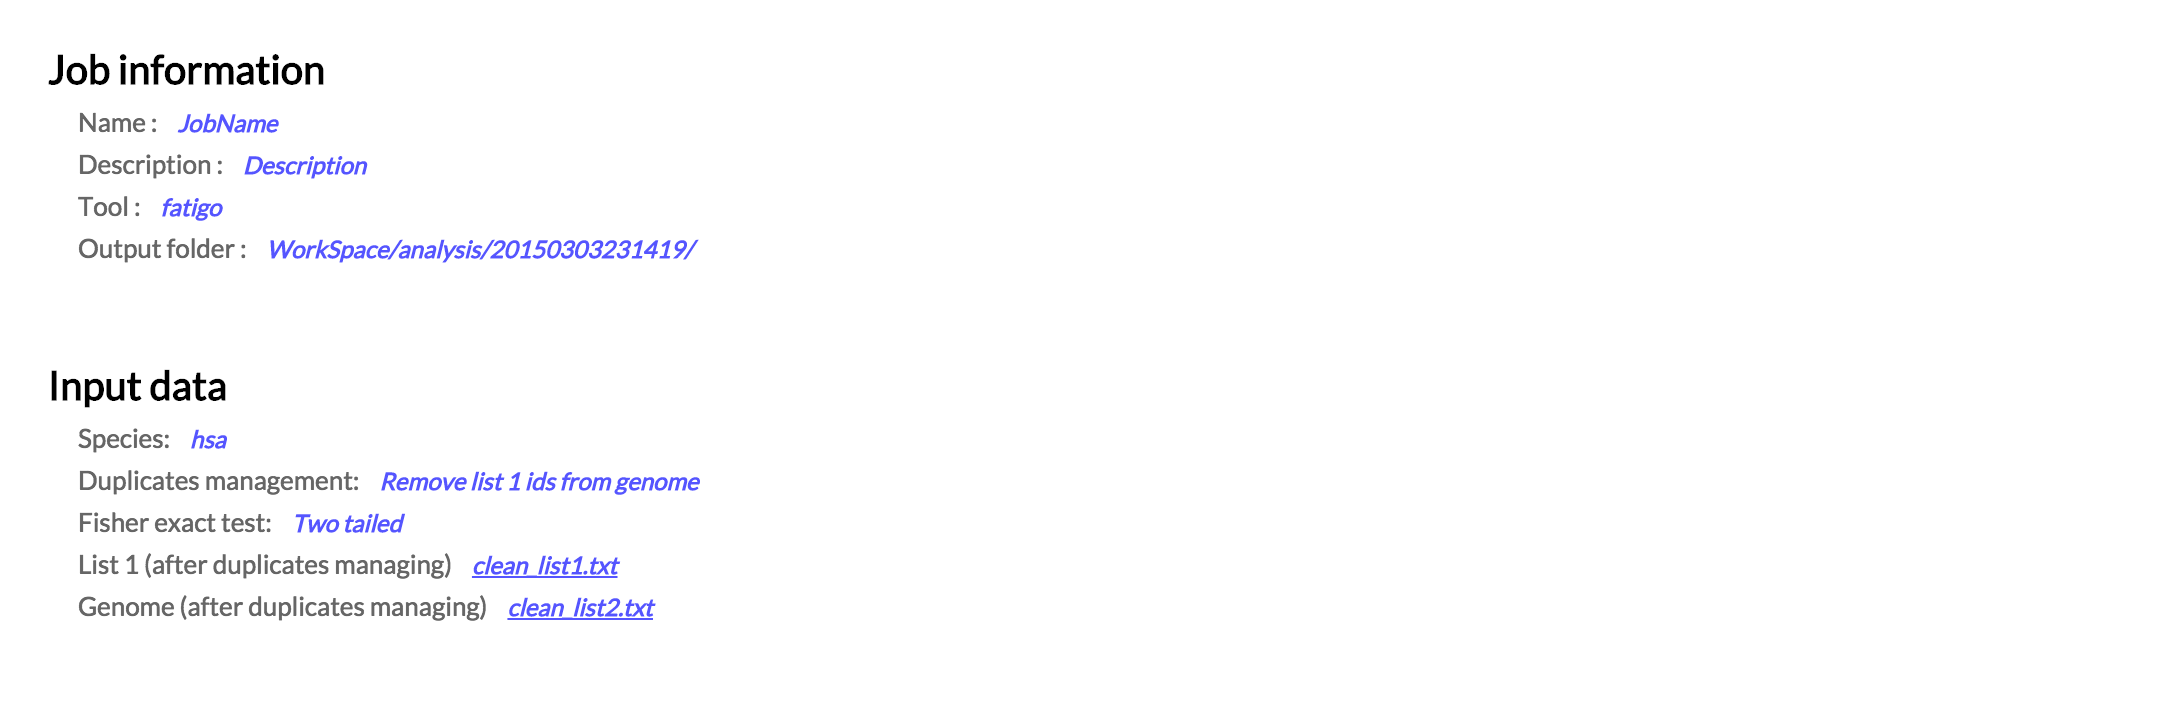
At the results form, the first section gives you a description of your analysis:
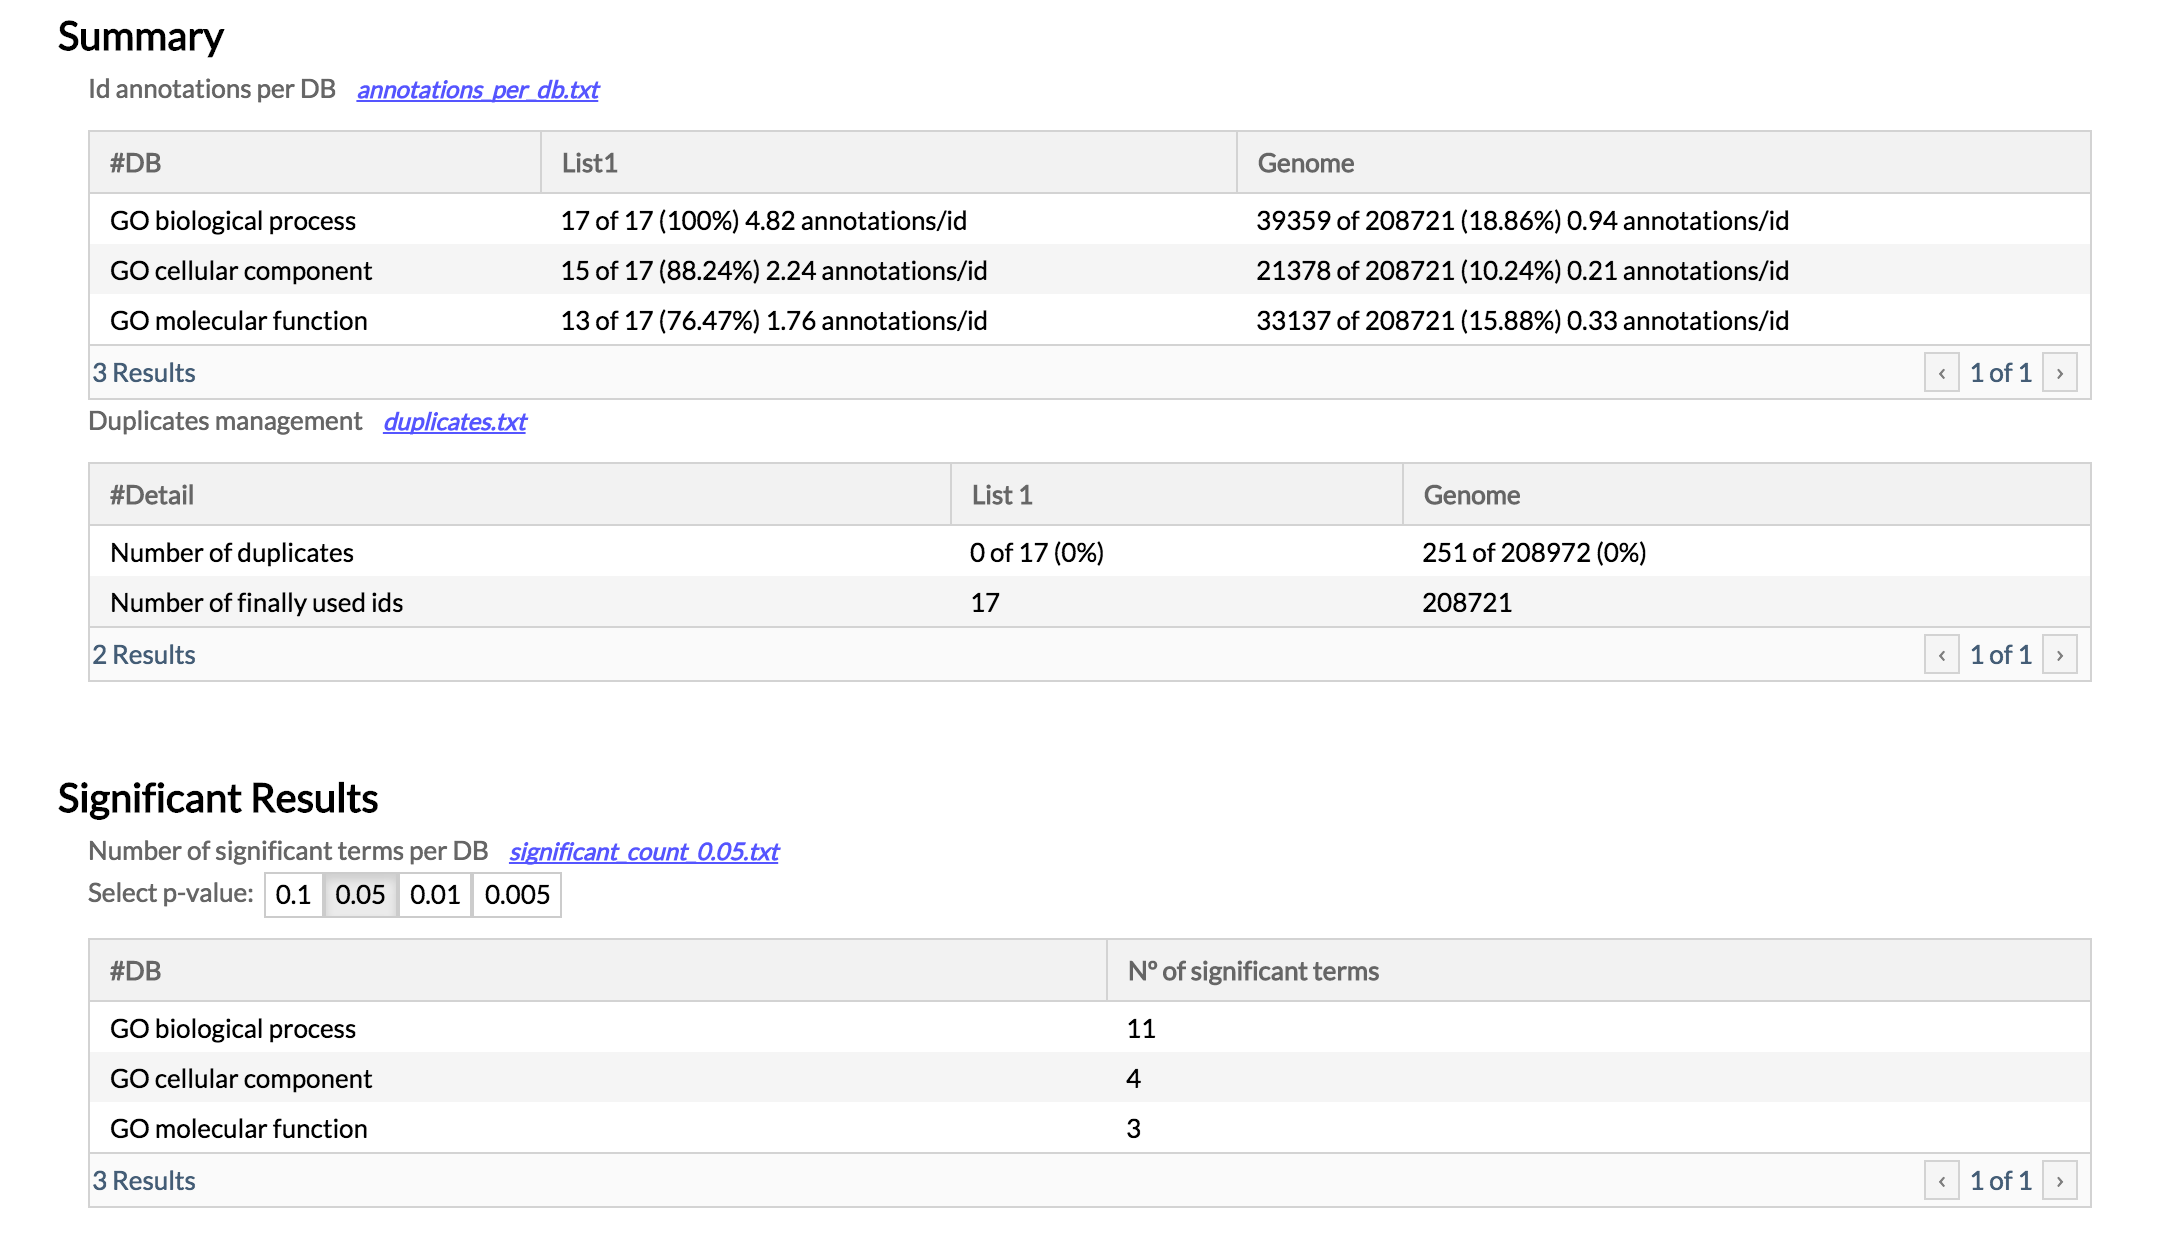
Secondly, there is a table summarising the significant GO functional terms found to be enriched in your network:
The GO results are displayed as GO graphs where the significant functional terms are highlighted in a way that the stronger the color is, the more significant is the GO term in the comparison (red fro over-represented terms and blue for the under-represented). There is a different GO network for each GO domain you are analysing (GO cellular component, GO molecular function, GO biological process).
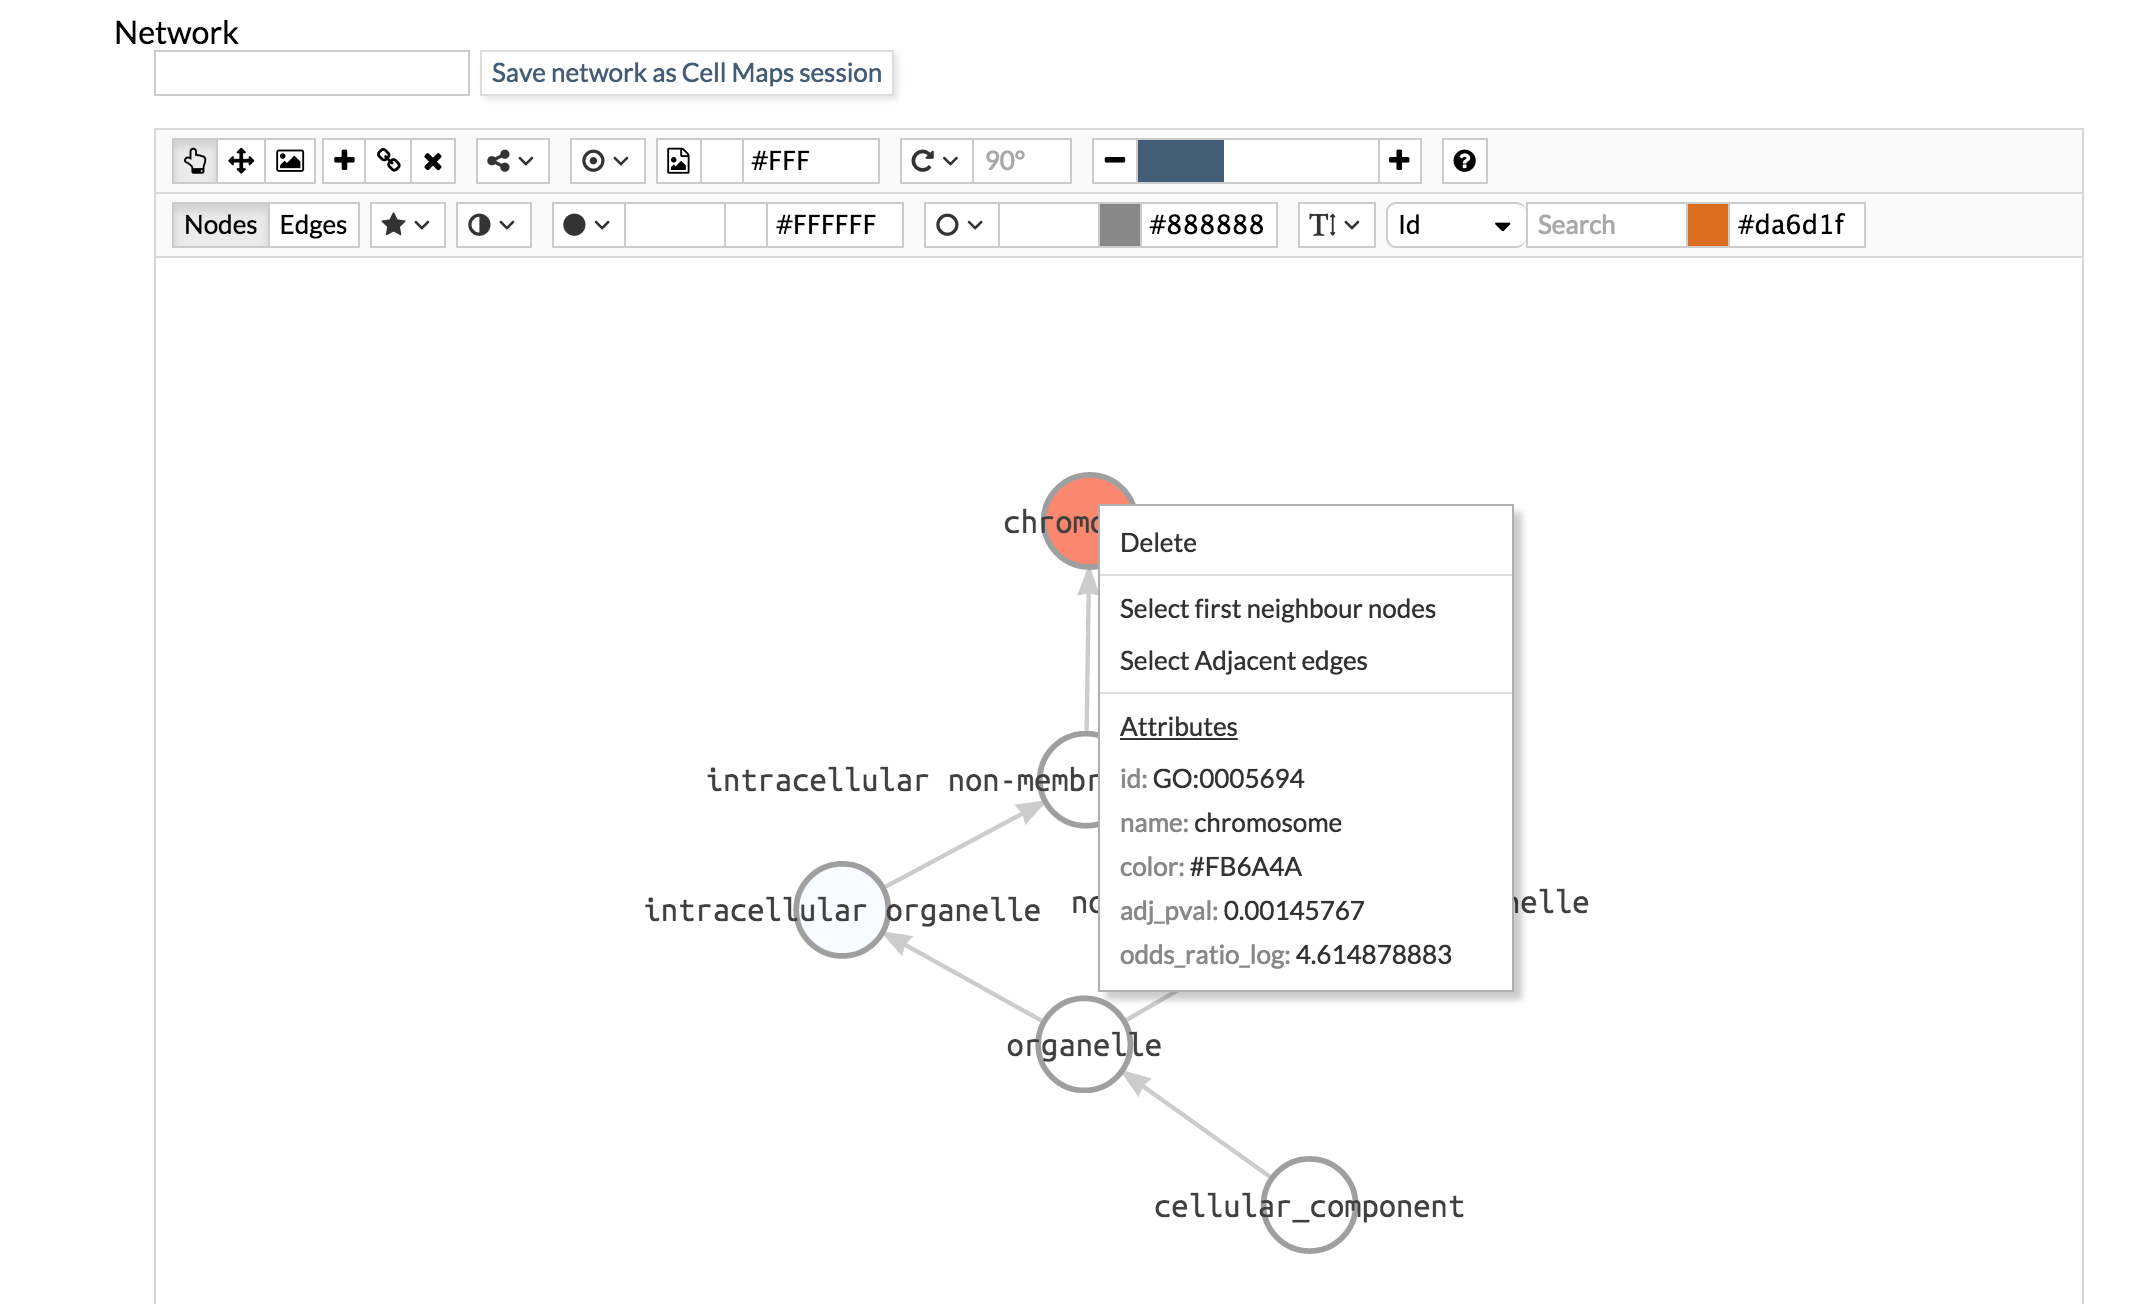
Explore the GO network. If you put the mouse cursor over a node and click the right button, a pop-up box will appear with the pvalue of the GO term.
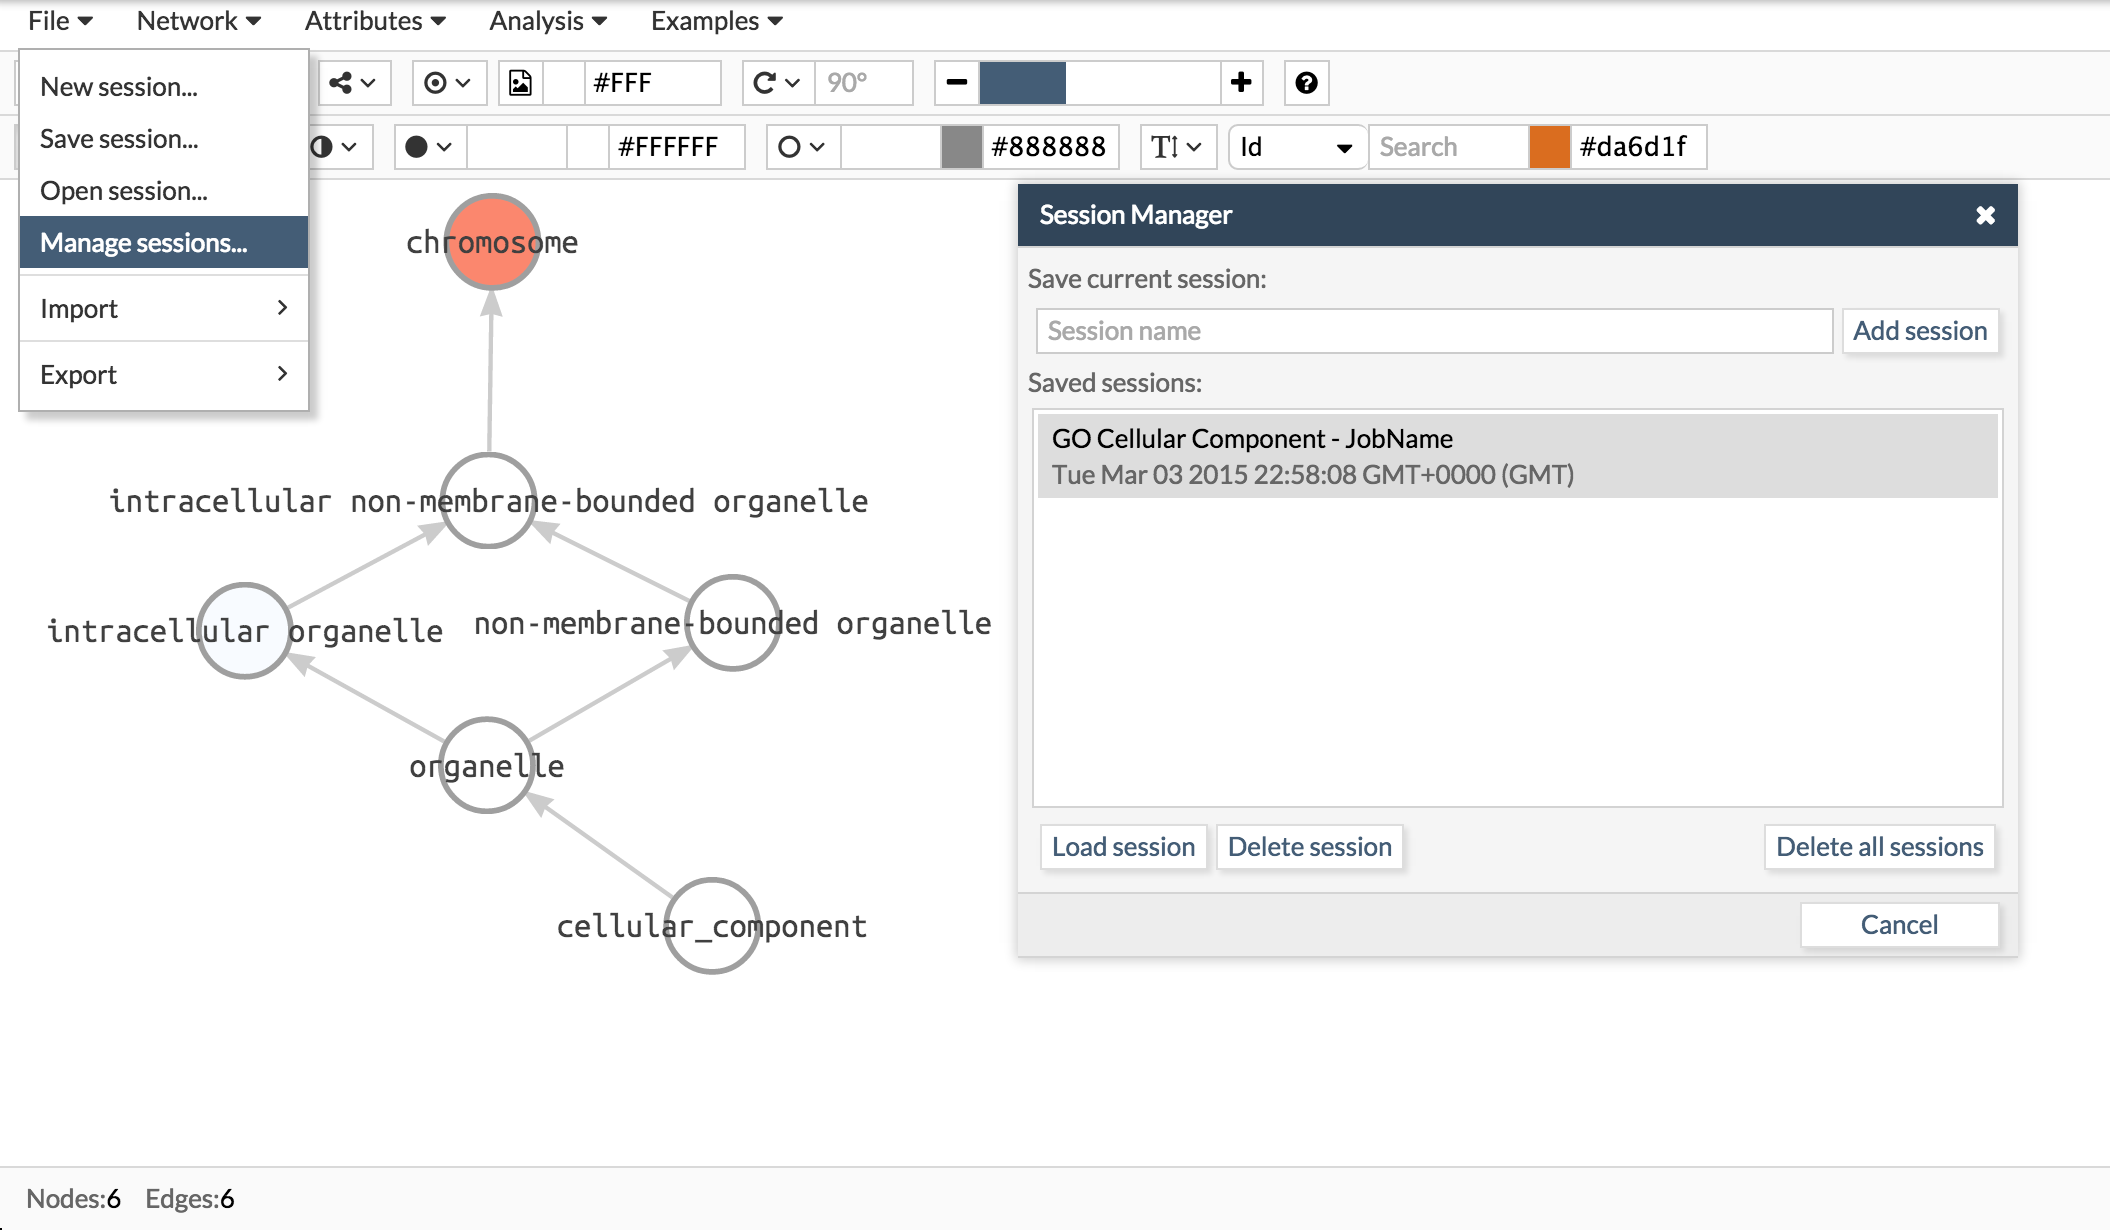
Finally, you can save each network as a CellMaps session.
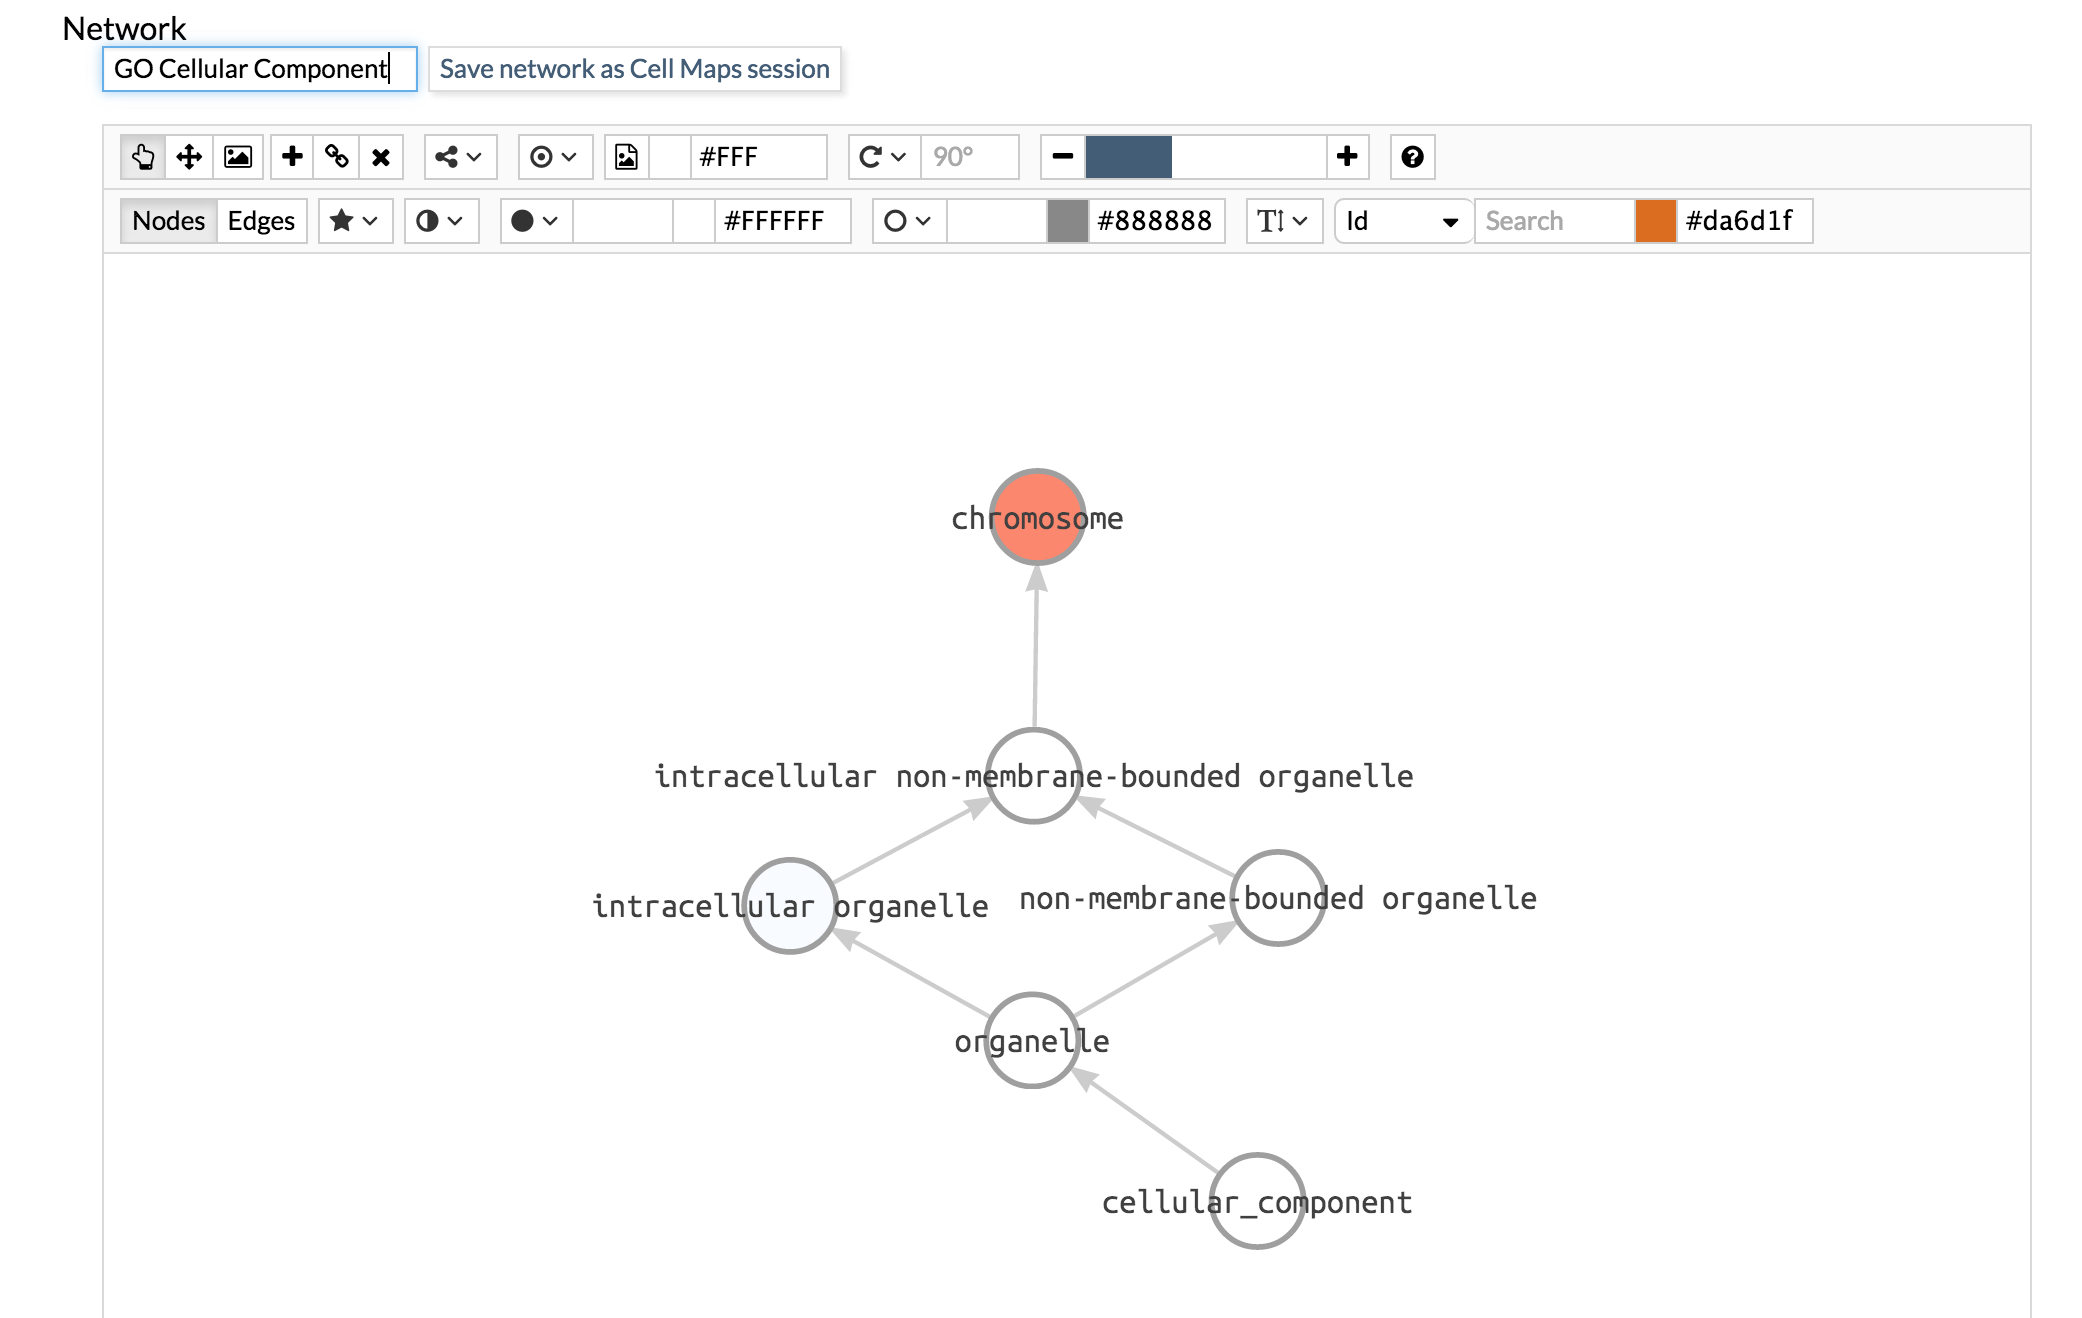
This sessions can be open in the main CellMaps page for a more efficient exploration. Go to the main menu File > Manage sessions, look for the GO network you saved and open it.
