Track Performance Tuning for v1.1
We have got a benchmark in v1.0 on FIX interface.
| e2e(us) | v1.0 FIX DisruptorBusySpin/5000 ord/Sec | v1.1 TCP_bg0.0_lt5000.1(20180120) | v1.1 TCP_bg0.0_lt20000.1(20180120) |
|---|---|---|---|
| count | 570 | 38135 | 37656 |
| mean | 2622.309851 | 99.57961463 | 144.5254868 |
| std | 2577.818449 | 36.67257949 | 55.64656159 |
| min | 833.247 | 59.074 | 64.908 |
| 25% | 1652.72725 | 86.788 | 122.16 |
| 50% | 2227.8865 | 90.434 | 140.392 |
| 75% | 2816.447 | 110.855 | 159.719 |
| 90% | 3638.2798 | 125.806 | 179.775 |
| 95% | 4569.12775 | 140.028 | 192.903 |
| 99% | 12110.48814 | 206.76 | 235.3668 |
| max | 35210.053 | 1844.427 | 5050.115 |
note: huge improvement, because v1.1 use TCP directly without the cost of FIX storage IO. v1.1 TCP continue to use FIX format/directionary and also translated to/from qfj message. note: v1.0 use ms previously, because it is slow. us is used in v1.1 since TCP is used directly. note: v1.0DisruptorBusySpin/5000 ord/Sec - background order: 5000 order per second with 10 sockets. 1 latency sender with 1 order per second. note: TCP_bg0.0_lt5000.1 means no bg(background) order. The latency order was sending with 5000/second with single client/socket.
- See https://github.com/baoyingwang/OrderBook/wiki/Track-Performance-Tuning-for-v1.0 for the detail data.
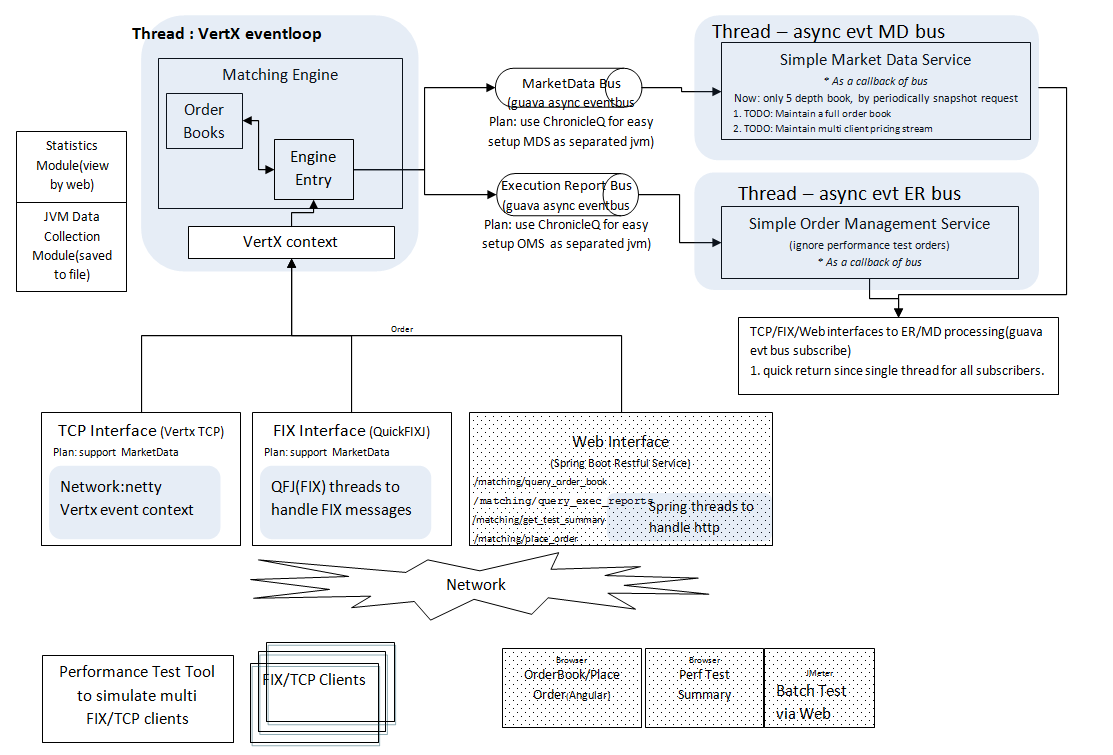
- See https://github.com/baoyingwang/OrderBook/wiki/ for the architecture diagram.
- the above number is FIX PersistMessages=N. Max 4000 order per second for FIX with PersistMessages=Y. It can reach 5000 and higher(how high?) with PersistMessages=N. PersistMessages=Y means it will save the outgoing message to session file before sending out. That is helpful if there is network disconnection to avoid message loss. This single flag is NOT enough. More detail from application level should be considered to guarantee message delivery.
Next, I hope to improve the e2e(end to end) performance, since that is the speed the client can feel.
- it is simple. The document is also clean http://vertx.io/docs/vertx-core/java/
- the performance is good. It is about 51 us with 1024 bytes + delimiter. See : https://github.com/baoyingwang/LibrariesEvaluation/wiki/TCP-Latency-of-Netty-and-Vert.x-TCP Comparing the current 1000+ us latency, 51 us is good enough currently.
- to make dev quick, I re-use FIX format. Because the performance of FIX message marshal/unmarshal is also ok. Marshal(obj->string): 1.6us, unmarshal(string->obj):2.3us. See : https://github.com/baoyingwang/QuickFixJTutorial/wiki/QFJ-performance Comparing the current 1000+ us latency, 1~2 us is good enough currently.
The 70000 are not accurate, since it cannot afford such highload. It try to send with 70k, but finally just about 50k. Some 60000 are not accurate. For some configuration, it cannot afford 60k. These(70k, 60k) should be removed from report, finally.
| us/TCP/bgX.1/lt1.1 | bg50.1 | bg500.1 | bg5000.1 | bg20000.1 | bg50000.1 | bg60000.1 | bg70000.1 |
|---|---|---|---|---|---|---|---|
| count | 450 | 450 | 450 | 450 | 450 | 450 | 450 |
| mean | 1402 | 1125 | 520 | 522 | 2031 | 2724 | 10831 |
| std | 1331 | 837 | 910 | 385 | 2428 | 2825 | 24203 |
| min | 365 | 364 | 258 | 295 | 367 | 335 | 345 |
| 25% | 756 | 676 | 333 | 392 | 920 | 1053 | 6195 |
| 50% | 1229 | 1009 | 378 | 449 | 1200 | 1860 | 8332 |
| 75% | 1744 | 1337 | 457 | 520 | 2026 | 3133 | 10279 |
| 90% | 2118 | 1662 | 593 | 663 | 4057 | 6120 | 13467 |
| 95% | 2560 | 2170 | 795 | 842 | 6745 | 9098 | 17906 |
| 99% | 5146 | 3702 | 2721 | 2444 | 13516 | 13842 | 79259 |
| max | 16842 | 12722 | 15619 | 5576 | 21963 | 18337 | 456208 |
| us/TCP/bgX.10/lt1.1 | bg50.10 | bg500.10 | bg5000.10 | bg20000.10 | bg50000.10 | bg60000.10 | bg70000.10 |
|---|---|---|---|---|---|---|---|
| count | 450 | 450 | 450 | 450 | 450 | 450 | 450 |
| mean | 1262 | 1779 | 533 | 4151 | 45150 | 25044 | 65758 |
| std | 979 | 6209 | 490 | 15150 | 25782 | 8966 | 36512 |
| min | 360 | 329 | 272 | 318 | 418 | 559 | 767 |
| 25% | 620 | 646 | 368 | 460 | 29587 | 19648 | 45868 |
| 50% | 1179 | 932 | 428 | 667 | 43087 | 24317 | 67759 |
| 75% | 1586 | 1271 | 510 | 1513 | 56920 | 29631 | 87417 |
| 90% | 1953 | 1598 | 728 | 6383 | 72865 | 36308 | 106403 |
| 95% | 2532 | 2364 | 1011 | 13437 | 90925 | 40954 | 117545 |
| 99% | 3782 | 24834 | 2629 | 87705 | 127213 | 50873 | 141203 |
| max | 13676 | 72910 | 7425 | 164101 | 202750 | 57489 | 330261 |
- revised the test tool
- single background java process for both bid and offer
- support adjust client number(sockets number) for each test case. e.g. bg1000.1 means 10 order per second with 1 client/socket. Similar for lt20000.30 - 20,000 order per second with 30 clients/sockets.
Here is the latency of end to end (us:10^-6, client ---order--> matching engine ---ER--->client)
| us/TCP/sorted by 90/95/99 | bg0.0_lt5000.1 | bg0.0_lt5000.10 | bg0.0_lt20000.10 | bg0.0_lt5000.30 | bg0.0_lt20000.30 | bg0.0_lt20000.1 | bg5000.500_lt1.1 | bg5000.100_lt1.1 | bg5000.10_lt1.1 | bg50000.100_lt1.1 | bg0.0_lt50.10 | bg1000.10_lt1.1 | bg0.0_lt50.1 | bg50000.10_lt1.1 | bg50000.500_lt1.1 | bg1000.500_lt1.1 | bg0.0_lt50.30 | bg1000.100_lt1.1 | bg500.100_lt1.1 | bg500.500_lt1.1 | bg50.100_lt1.1 | bg500.10_lt1.1 | bg50.500_lt1.1 | bg50.10_lt1.1 |
|---|---|---|---|---|---|---|---|---|---|---|---|---|---|---|---|---|---|---|---|---|---|---|---|---|
| count | 38135 | 38134 | 37656 | 38134 | 37656 | 37656 | 450 | 450 | 450 | 450 | 22500 | 450 | 22500 | 450 | 450 | 450 | 22500 | 450 | 450 | 450 | 450 | 450 | 450 | 450 |
| mean | 99.57961463 | 100.7821507 | 130.592519 | 163.9468011 | 139.3938456 | 144.5254868 | 376.6583978 | 396.0750511 | 510.74952 | 738.9769289 | 744.915939 | 813.7304467 | 755.6759878 | 801.8775489 | 825.3143378 | 864.3697689 | 798.7529131 | 920.48294 | 1356.324953 | 1326.381078 | 1546.853378 | 1351.5893 | 1545.298416 | 1625.965836 |
| std | 36.67257949 | 55.9948512 | 77.30068698 | 1306.426497 | 93.05878391 | 55.64656159 | 268.9568754 | 247.3093754 | 377.5687467 | 379.8930982 | 355.1255613 | 693.8636553 | 468.6335422 | 278.3371913 | 289.7722662 | 513.8826661 | 813.7717477 | 801.9938681 | 770.672446 | 366.0000942 | 562.3696073 | 810.2478801 | 781.2283999 | 1003.562788 |
| min | 59.074 | 59.074 | 55.428 | 59.803 | 55.792 | 64.908 | 236.297 | 254.53 | 246.143 | 341.682 | 68.555 | 284.431 | 74.39 | 444.151 | 334.753 | 407.684 | 80.953 | 284.066 | 382.888 | 361.374 | 438.316 | 431.388 | 395.287 | 387.264 |
| 25% | 86.788 | 87.153 | 109.397 | 78.766 | 114.138 | 122.16 | 308.86325 | 324.27025 | 342.2295 | 592.92925 | 666.59 | 578.5255 | 667.32 | 636.41525 | 683.82075 | 676.89125 | 568.498 | 651.822 | 1158.51125 | 1164.436 | 1395.3545 | 1088.40625 | 1392.8935 | 1368.6435 |
| 50% | 90.434 | 91.164 | 123.253 | 93.352 | 129.818 | 140.392 | 343.8705 | 361.556 | 409.5085 | 701.962 | 742.439 | 732.7755 | 728.217 | 739.157 | 771.976 | 780.9095 | 771.976 | 807.165 | 1303.279 | 1306.561 | 1498.005 | 1233.812 | 1489.618 | 1516.4195 |
| 75% | 110.855 | 111.584 | 141.213 | 114.502 | 150.602 | 159.719 | 383.891 | 403.67375 | 538.6875 | 800.784 | 811.723 | 892.85925 | 807.34725 | 889.85075 | 916.4705 | 939.8085 | 932.789 | 1023.5885 | 1423.2505 | 1453.517 | 1641.31525 | 1413.31325 | 1638.306 | 1799.30125 |
| 90% | 125.806 | 127.264 | 161.907 | 161.907 | 175.764 | 179.775 | 448.162 | 472.9945 | 861.9007 | 946.4634 | 1052.76 | 1057.6104 | 1058.595 | 1059.2882 | 1067.9671 | 1100.0204 | 1160.334 | 1265.7193 | 1579.505 | 1630.0827 | 1741.632 | 1750.1285 | 1771.5699 | 2131.0841 |
| 95% | 140.028 | 141.121 | 177.952 | 248.4584 | 197.643 | 192.903 | 523.40815 | 543.00895 | 1010.7706 | 1084.4313 | 1091.414 | 1330.1722 | 1101.259 | 1250.7322 | 1210.47385 | 1320.8195 | 1286.86905 | 1433.9344 | 1703.30615 | 1785.9732 | 1881.9688 | 2101.34605 | 2041.9437 | 2311.8613 |
| 99% | 206.76 | 219.523 | 246.87145 | 961.47588 | 302.664 | 235.3668 | 911.68304 | 1274.65715 | 1545.02759 | 1516.34755 | 1154.5 | 3005.22453 | 1220.14164 | 2096.66705 | 1800.59268 | 2051.26782 | 1858.3324 | 3064.62351 | 3059.80615 | 2745.51369 | 3069.97988 | 3644.40425 | 2978.1598 | 4765.00848 |
| max | 1844.427 | 5219.315 | 5294.798 | 187851.209 | 10841.574 | 5050.115 | 5424.616 | 4759.849 | 5133.985 | 7624.583 | 31485.453 | 10253.02 | 46709.822 | 2512.476 | 4662.121 | 10133.048 | 54774.179 | 14825.8 | 15376.431 | 4156.344 | 9556.163 | 14304.707 | 16009.473 | 17064.421 |
note: still on same laptop(loopback network) - win7 64bit. note: from above it can handle 50k order per second. note: the best e2e is on bg0.0_lt5000.1/bg0.0_lt5000.10/bg0.0_lt20000.10. It is about 206.76/219.523/246.87145 us on 99%. Looks like the behavior of assigning timestamp does NOT impact(or just minor) on performance. why? In these cases, background java process is DOWN. That means only matching engine and latency sender are sharing the same laptop. Any other reason?
TODO: deploy the background sender and latency sender to another box in same intranet and try again. That will be slower than above, because the real NIC processing(above is loopback)
20180118 - max throughput vertx TCP performance is about 60k(both matching engine and test tools on same laptop)
- env : win7 64bit / java 8 / intel i7 6600 2.6GHz
- 4 java processes - matching engine, background bid(10 sockets), background offer(10 sockets), latency(1 per second)
- note: only deals from latency process will be recorded with the timestamps for profiling.
- note: hard to reach 60k on other setup(ok for bg 60k with 10 sockets/clients + 1 latency sernder with 1 clients (1 ord/s). But 50k can be promised for most setup.
The bottleneck is cpu. My CPU is almost 100%
- engine : 60+%
- background clients java bid side(30k/sec) : 20%
- background clients java offer side(30k/sec): 20%
round latency (us:10^-6, client ---order--> matching engine ---ER--->client)
| us/TCP/lt1perS | bg50pS | bg500pS | bg1000pS | bg5000pS | bg10000pS | bg20000pS | bg40000pS | bg50000pS | bg60000pS |
|---|---|---|---|---|---|---|---|---|---|
| count | 570 | 570 | 570 | 571 | 570 | 570 | 570 | 570 | 571 |
| mean | 3042 | 2361 | 1953 | 2008 | 1468 | 1693 | 1211 | 1832 | 1570 |
| std | 3599 | 1695 | 1177 | 1117 | 942 | 1213 | 518 | 783 | 951 |
| min | 339 | 430 | 516 | 470 | 358 | 539 | 515 | 580 | 523 |
| 25% | 2254 | 1519 | 1347 | 1501 | 796 | 1108 | 941 | 1350 | 1193 |
| 50% | 2654 | 2002 | 1762 | 1829 | 1390 | 1389 | 1122 | 1643 | 1401 |
| 75% | 3116 | 2740 | 2259 | 2278 | 1799 | 1779 | 1349 | 2160 | 1715 |
| 90% | 4011 | 3837 | 2788 | 2916 | 2345 | 2673 | 1632 | 2665 | 2193 |
| 95% | 4938 | 4698 | 3365 | 3508 | 2956 | 3435 | 1808 | 3169 | 2487 |
| 99% | 10329 | 7827 | 6242 | 5940 | 4642 | 6823 | 2883 | 4248 | 3728 |
| max | 65555 | 19344 | 15374 | 15873 | 10744 | 14240 | 8288 | 10337 | 15600 |
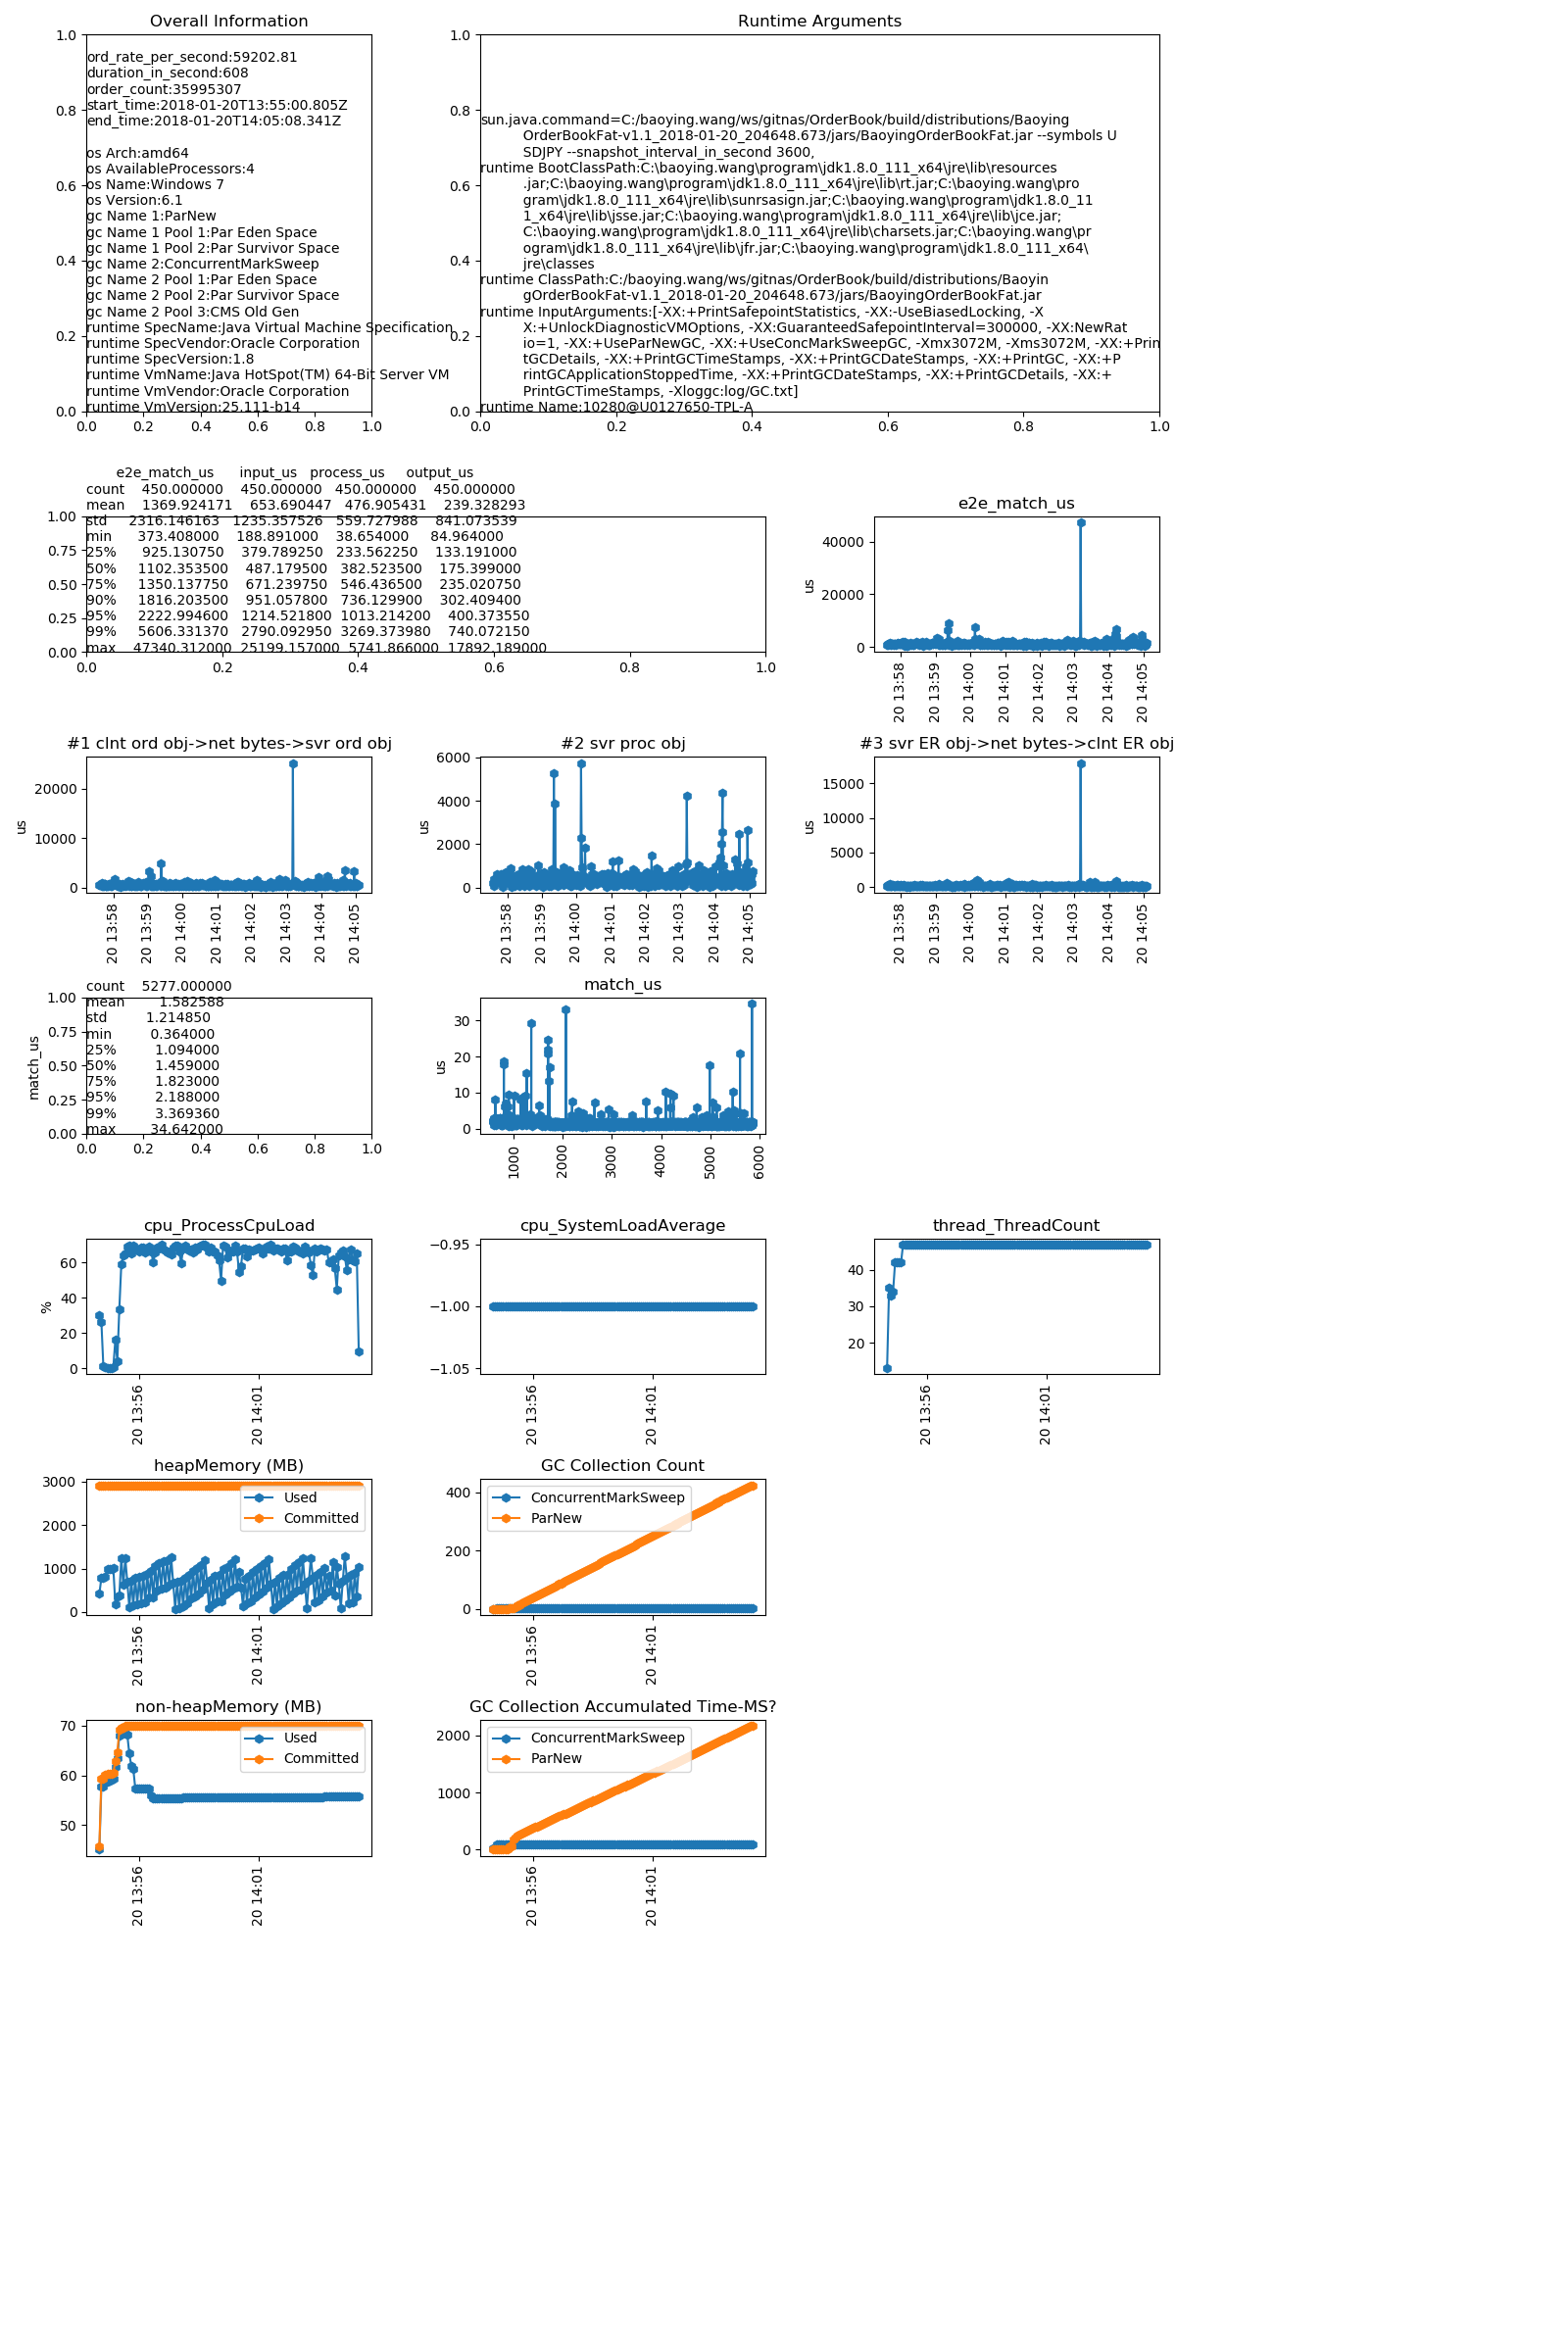
Diagram of performance summary of 60,000 order per second(TCP_bg60000.10_lt1.1_600S_20180120_215413_latency_overall.png).
20180116 - first drop of v1.1 - replace FIX with VertX TCP(replace inputQ with VertX even loop); New ER is skipped on match.
- note: FIX interface is still supported, and the testtool for FIX is upgraded with round pattern(not sending next order until recving previous ER), too.
- note: the test tool will NOT send next order, until receive the match ER. This will help for performance data, since it will avoid stuffing all data to TCP buffers.
- note: Please make sure the testtool is fast enough to consume the received message from matching engine. Otherwise, all data will be Queued in TCP buffer.