Track Performance Tuning for v1.0
- latency orders are sent and measured, while background order are sending. E.g. 2 latency orders per second, and 200 background orders per second.
- on latency orders, the matching app will record the start/end time(sys nano) of each phase.
- FIX test tool(my own code) is used to send orders(both latency order and background orders)
- web monitor supports to see the current test status(aka test summary), e.g. start time, end time(current time), total orders( both background and latenty), latency order count, tail 200 latency order latency data and chart. Angular is used to show data; c3chart is used for chart.
- latency data statistics are calculated by python, with pandas module. Just the basic data frame.describe( multi percentiles) is used.
- GC took time is also parsed on every web monitor refresh( test summary). Java code. TODO: use python rather than java.
note: jmeter is NOT used anymore, because web interface is too slow to send trades(TODO: why so slow?). FIX test tool is prepared(including related scripts - run_multi_scenarios.sh)
-
the match_us is very stable on any load(see Dec 26, 2017 result and later)
-
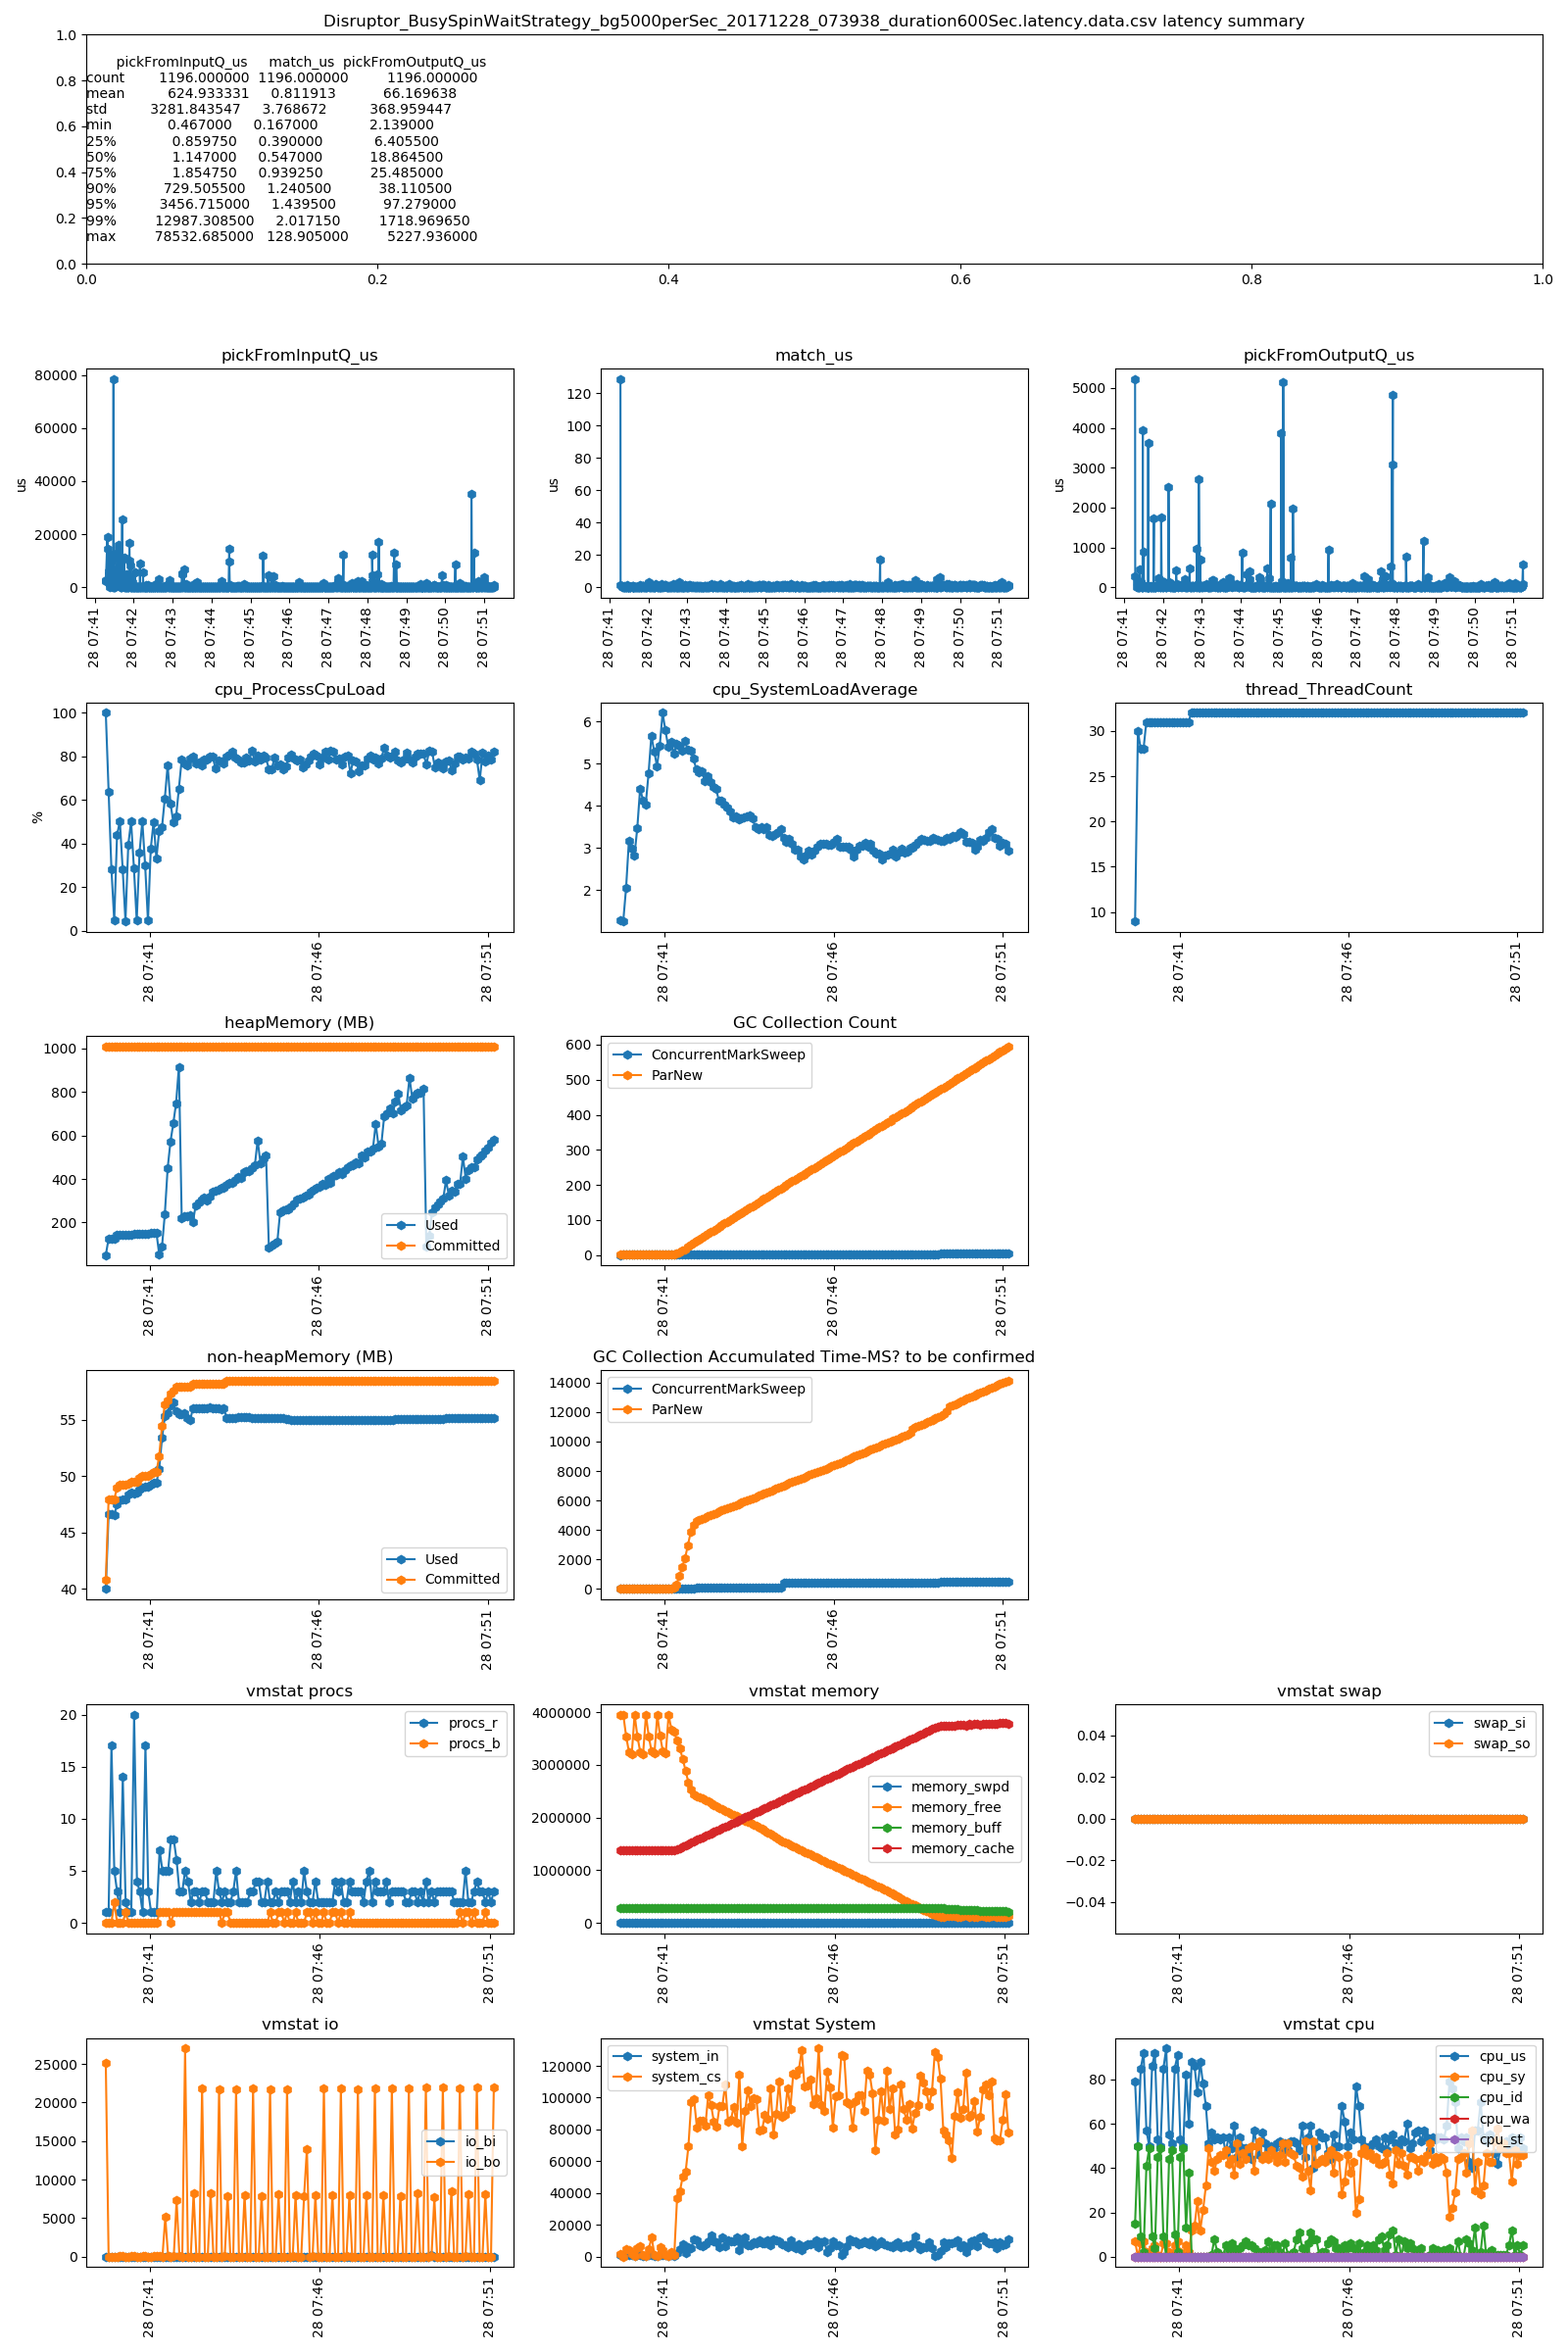
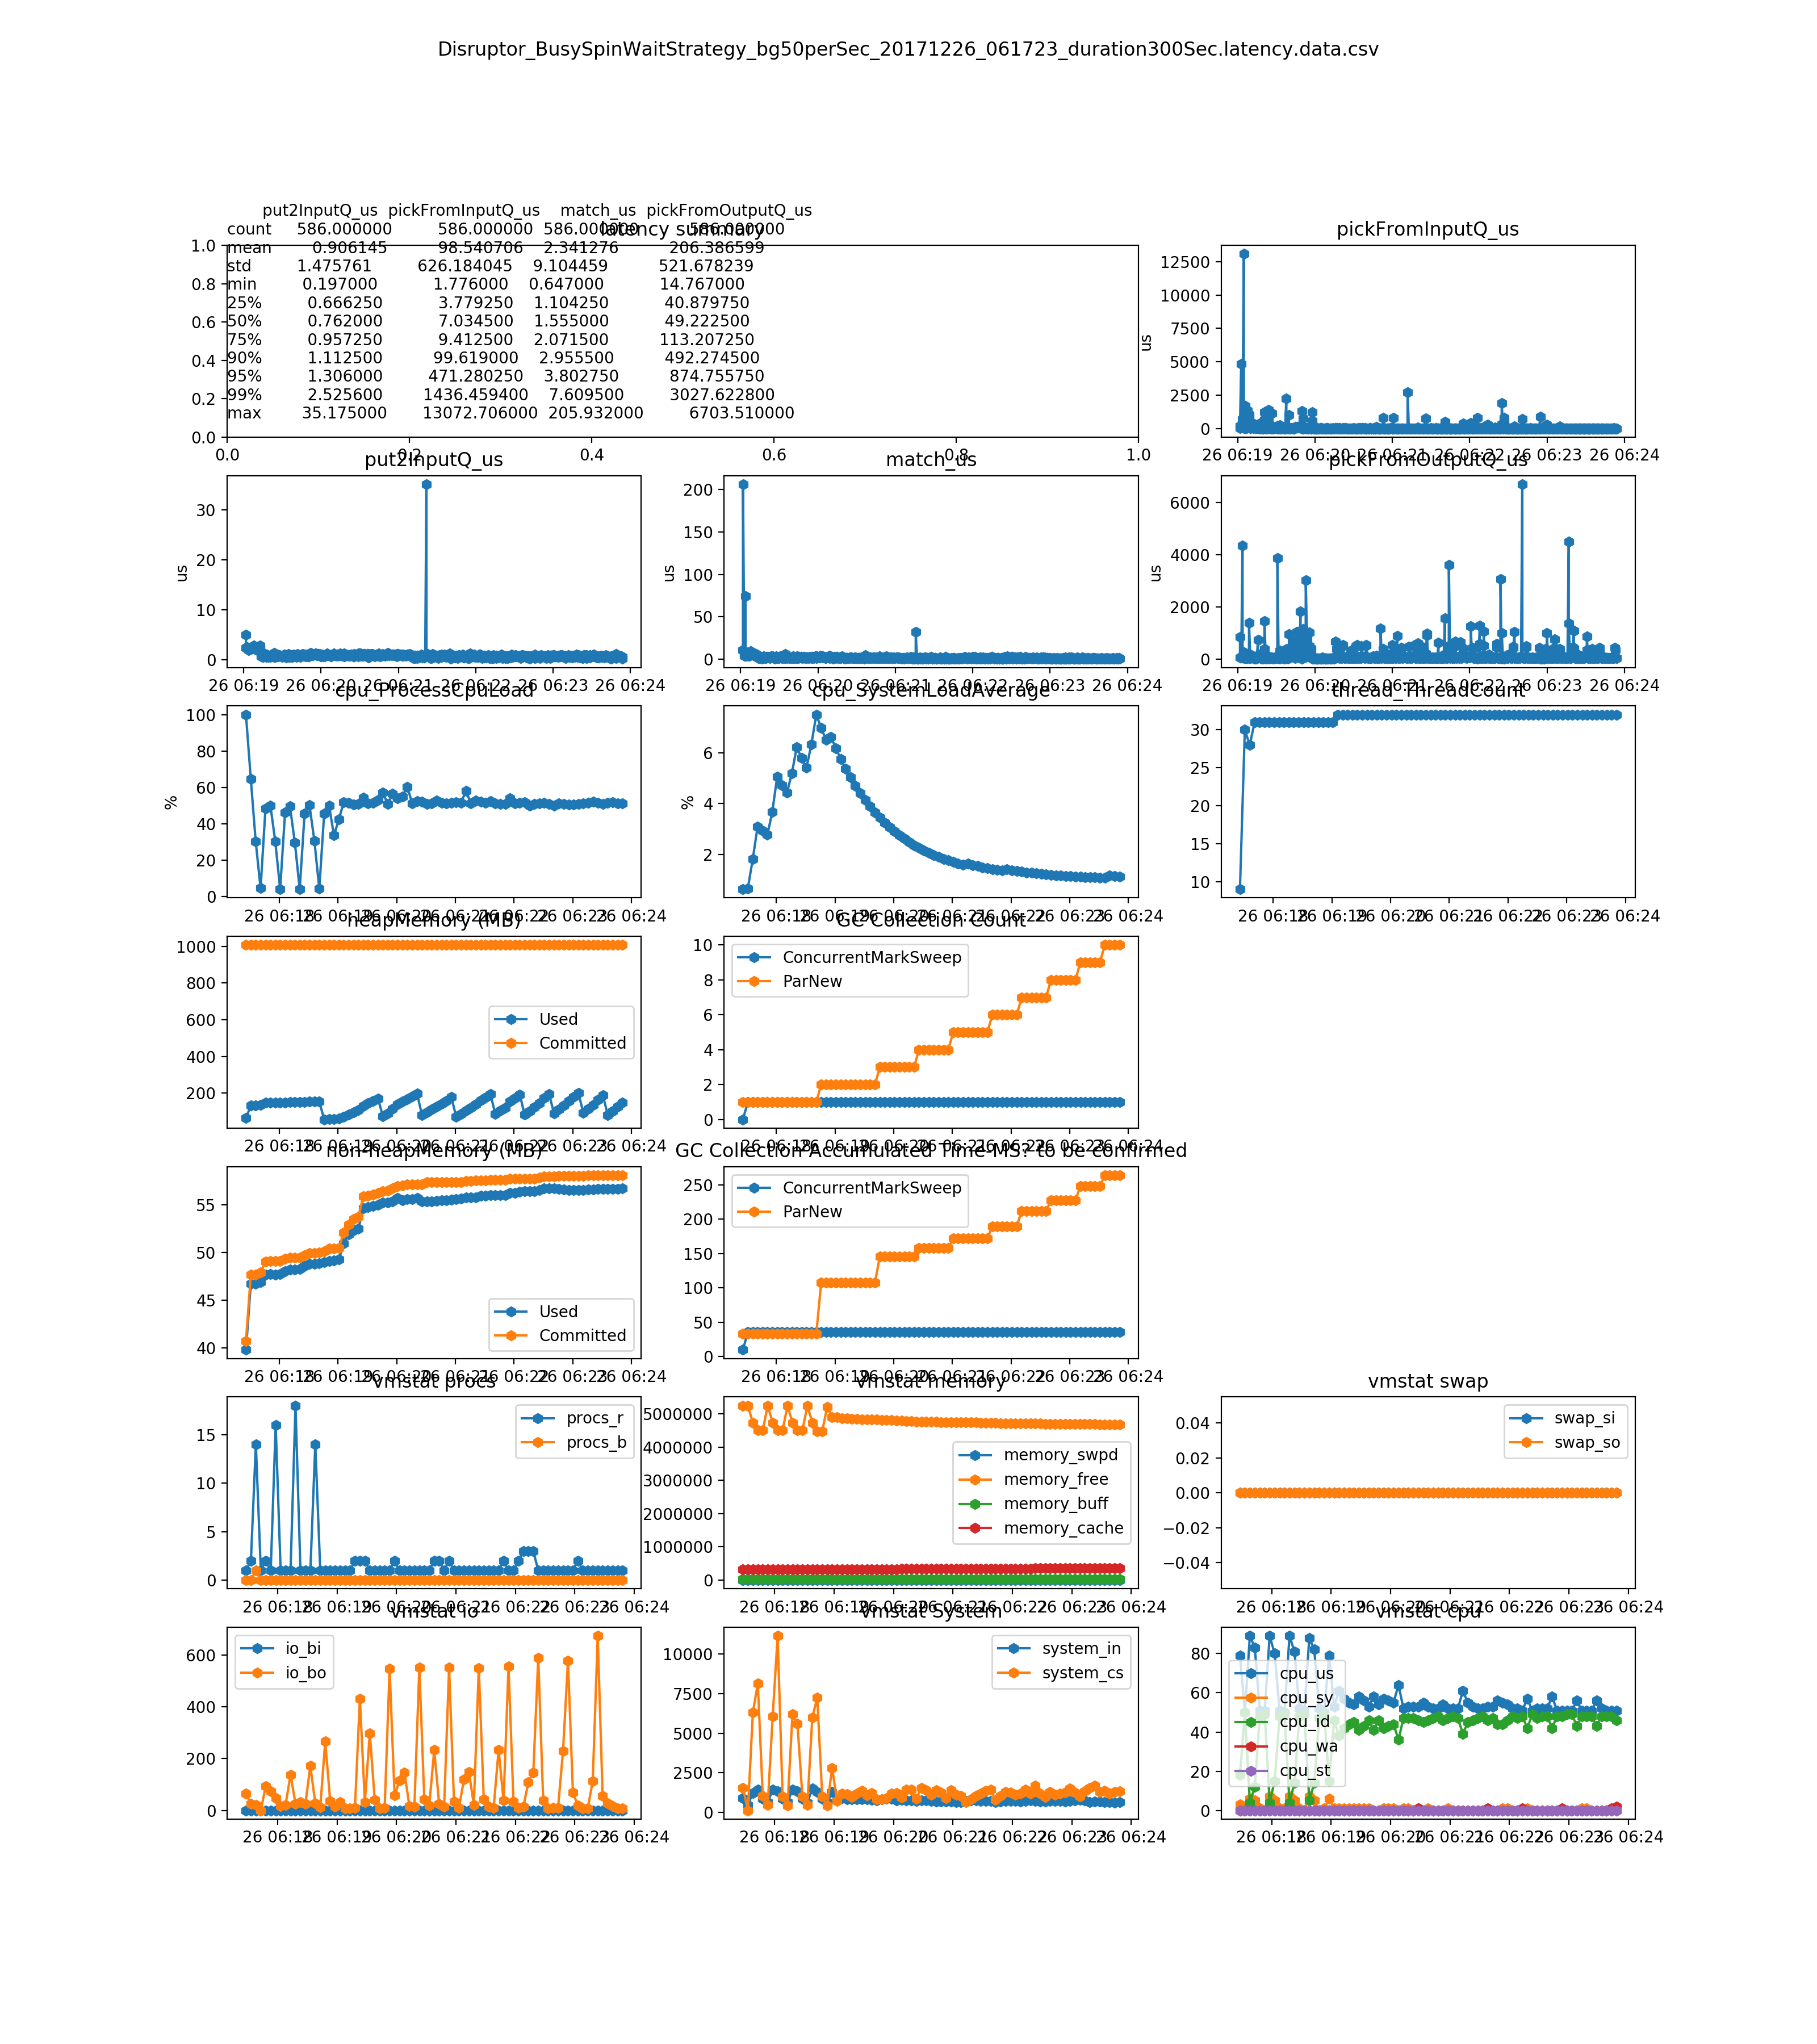
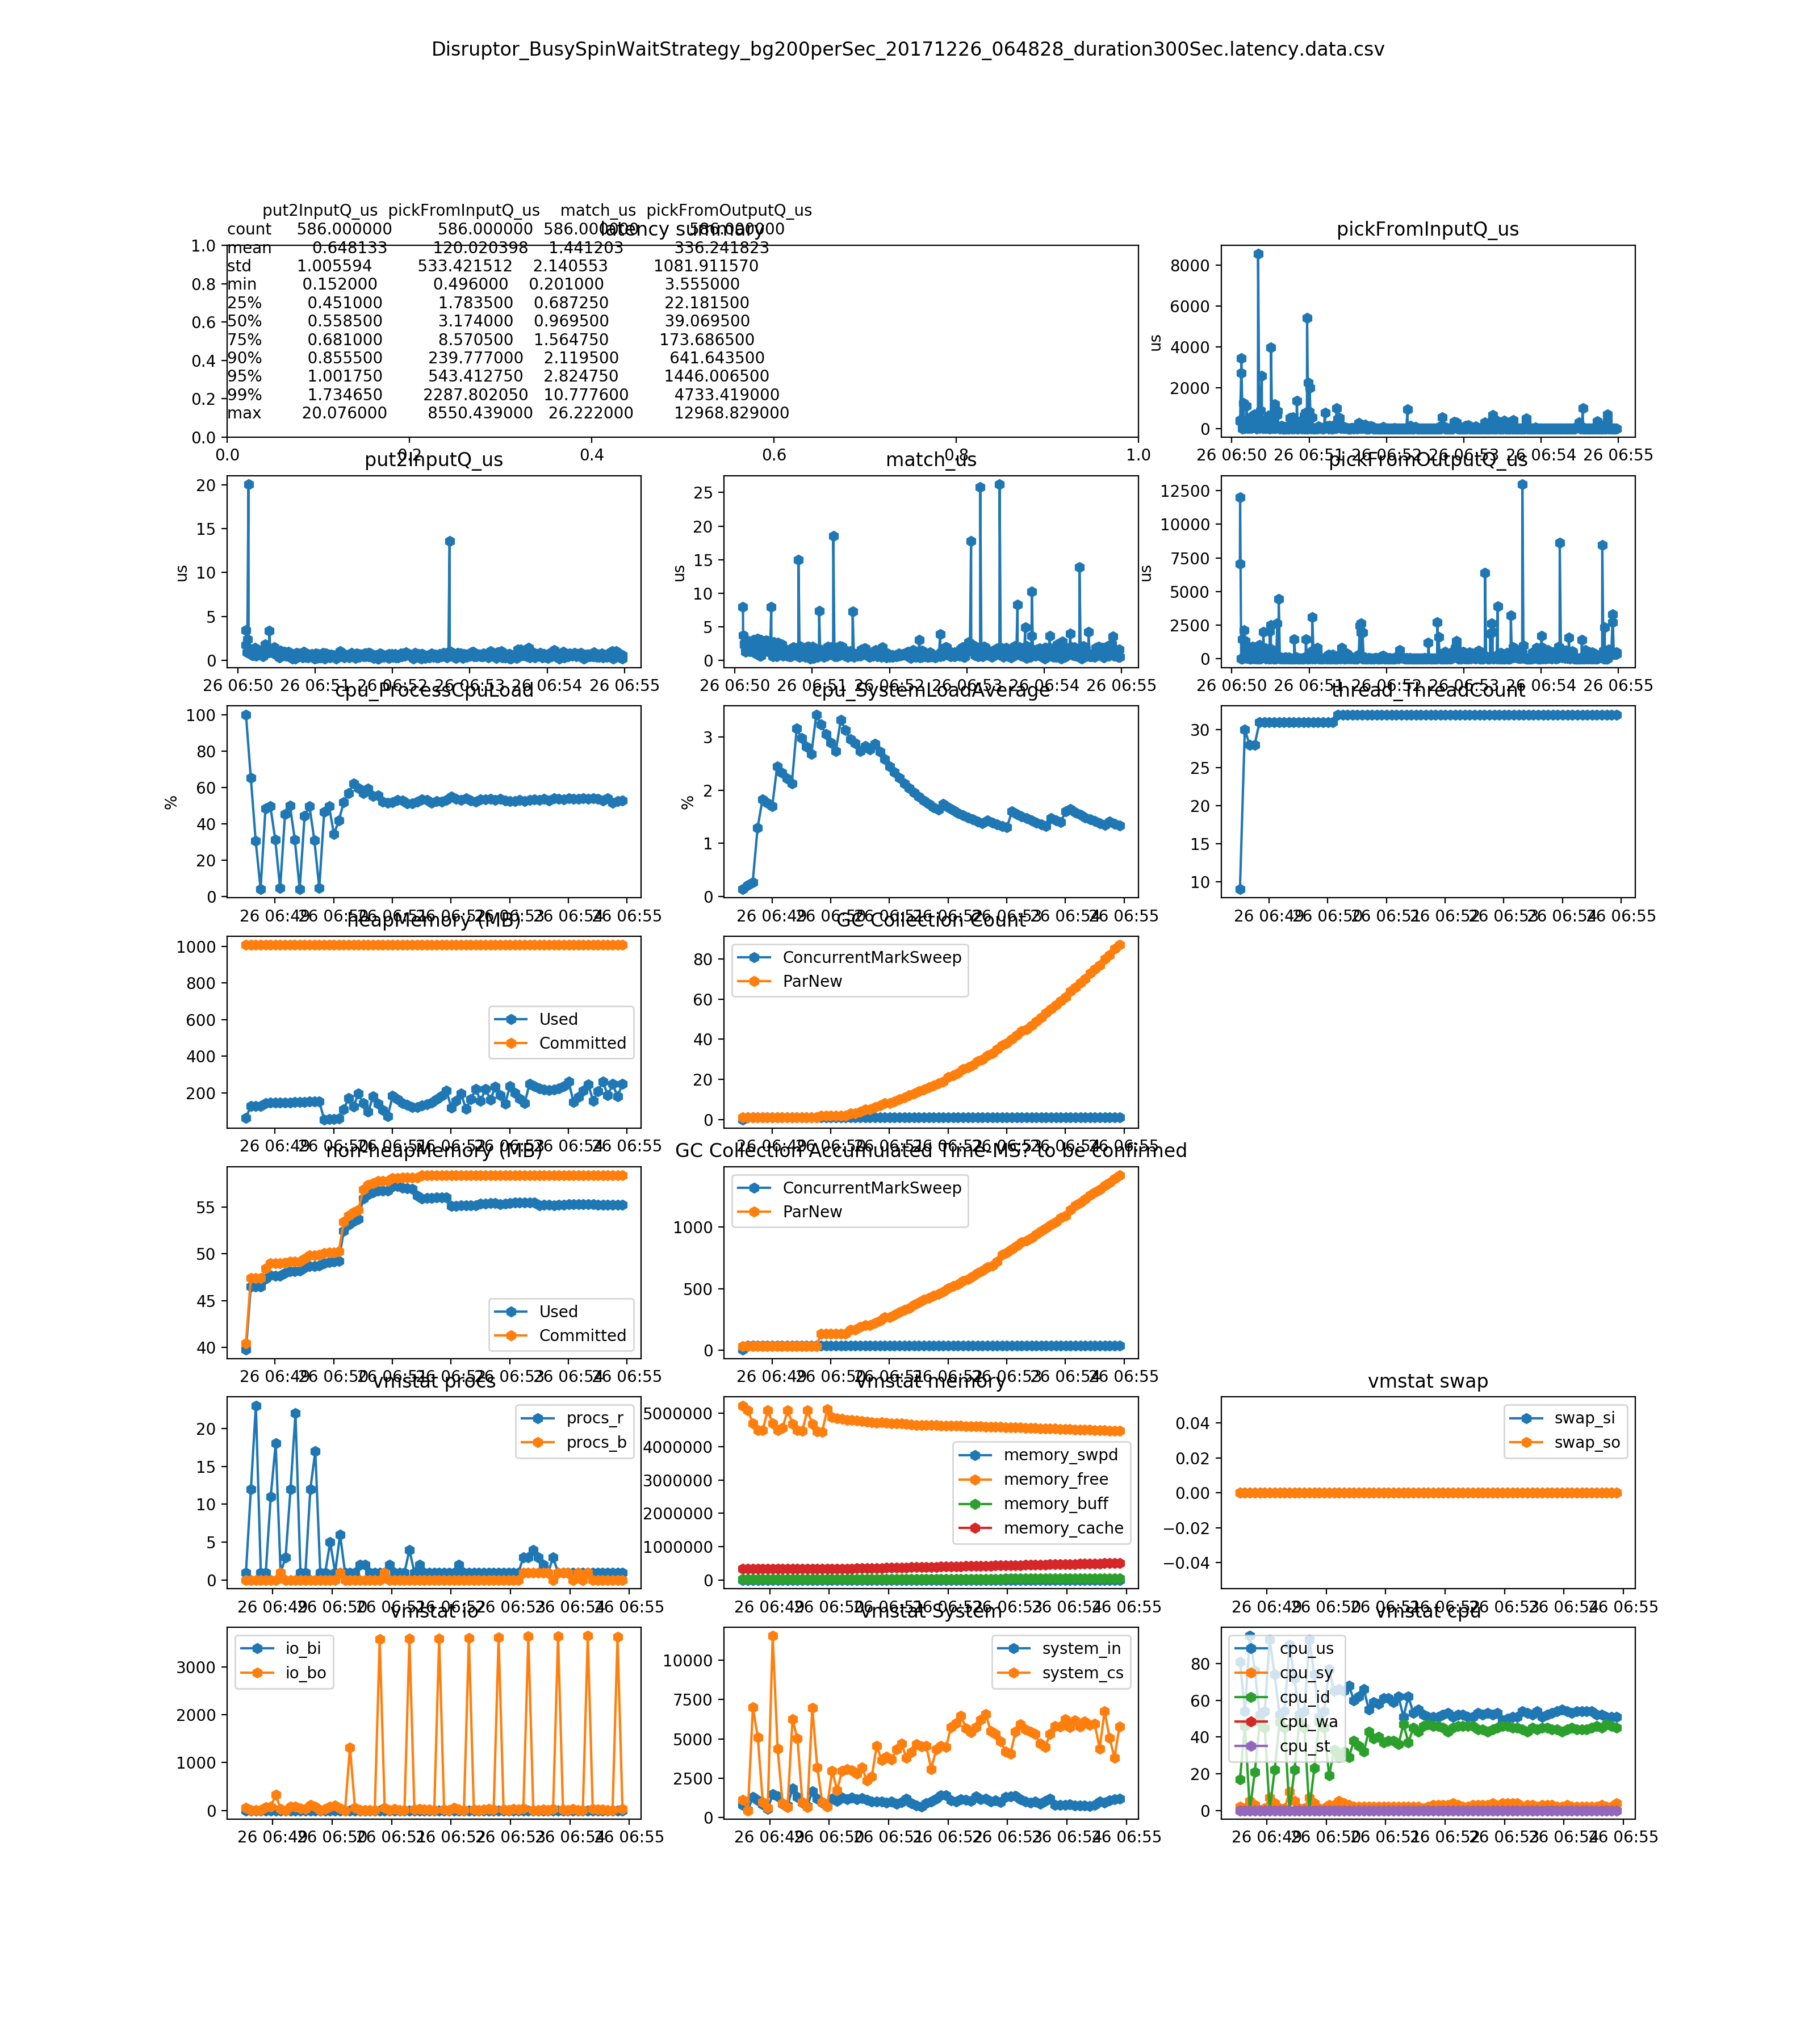
no much difference between the Disruptor_BusySpinWaitStrategy and Disruptor_BusySpinWaitStrategy. The Disruptor document says BusySpinWaitStrategy is for low latency , and BusySpinWaitStrategy is for ultra low latency. We could only use BusySpinWaitStrategy for performance tuning, since they use similar resource(mainly on CPU) (see Dec 26, 2017 result)
-
tried several aspect improvements, and gain much better performance. Good performance on 5000 order/second
- CPU - save cpu by avoid toString while loging - logger.debug("xyz:{}", obj), rather than logger.debug("xyz:{}", obj.toString())
- DiskIO - FIX client test level is setup with warn. The tool is on same box with engine. I hope to minimize the impact to engine. The client tool FIX storage is already disabled previously. FIX storage on client is not required for our test, since we are verifying the performance of matching engine.
- Network IO - slow FIX client consuming caused sending side(engine FIX) blocked. Multi-thread clients are used.
- Memory - stop saving latency orders to OMS. OMS is not key in this phase. In the future, we will use some persist way for OMS, or split OMS to another separate process(rather inside of engine)
-
By checking the GC logs, it is too frequent(every second) on minor GC. The young size is too small(150M). We only have little object in old generation. Increase young GC side helped the performance data. These 2 articles are very helpful to understand GC and some basic tuning: http://mp.weixin.qq.com/s/t1Cx1n6irN1RWG8HQyHU2w https://engineering.linkedin.com/garbage-collection/garbage-collection-optimization-high-throughput-and-low-latency-java-applications BTW: why/who use 1G bytes in young generation? They are cleaned on every minor gc? Easy to find out by check with jvisualvm sampler.
-
note for performance tuning
- don't rush to change the code. Profiling and analyze current report firstly. If you have some ideas, note them.
- I stopped myself to continuously change the code for performance(because I have many ideas on how to tune it). Analyze the output, and evaluate your ideas.
- the visualvm cpu sampling and profiling does not work for such ultra latency test because . the calculation of how long a method use cpu in a period is meaningless. We hope to track the latency of each message processing. . the sampling rate(every 50 ms?) is too big. . the profiling instrument will cause performance impact.
- warm up is helpful in some case(why and how? See JVM feature). Evaluate and try it.
- note: disabled server FIX storage for better e2e to void DISKIO on the critical path. It can be added back if you need it, by a simple configuration change(of qfj configuration file). For ultra low-latency app, it is recommended to use OMS(or post trade system) for the possible data loss(and data sync) with client.
- note: the internal snapshot request rate is extended from 1 second to 3600 seconds while performance test. Such rate will be upgraded to around 15 minutes when MarketDataService is used. During web GUI, rate 1 second is still required, before MDS is ready.
- note - v1.1 is introduced. InputQ is removed, by reusing QFJ single thread of acceptor. See diagram here: https://raw.githubusercontent.com/wiki/baoyingwang/OrderBook/attachments/ME_1.1/ME_1.1_architecture_20180107.png(maybe update with new pictures later)
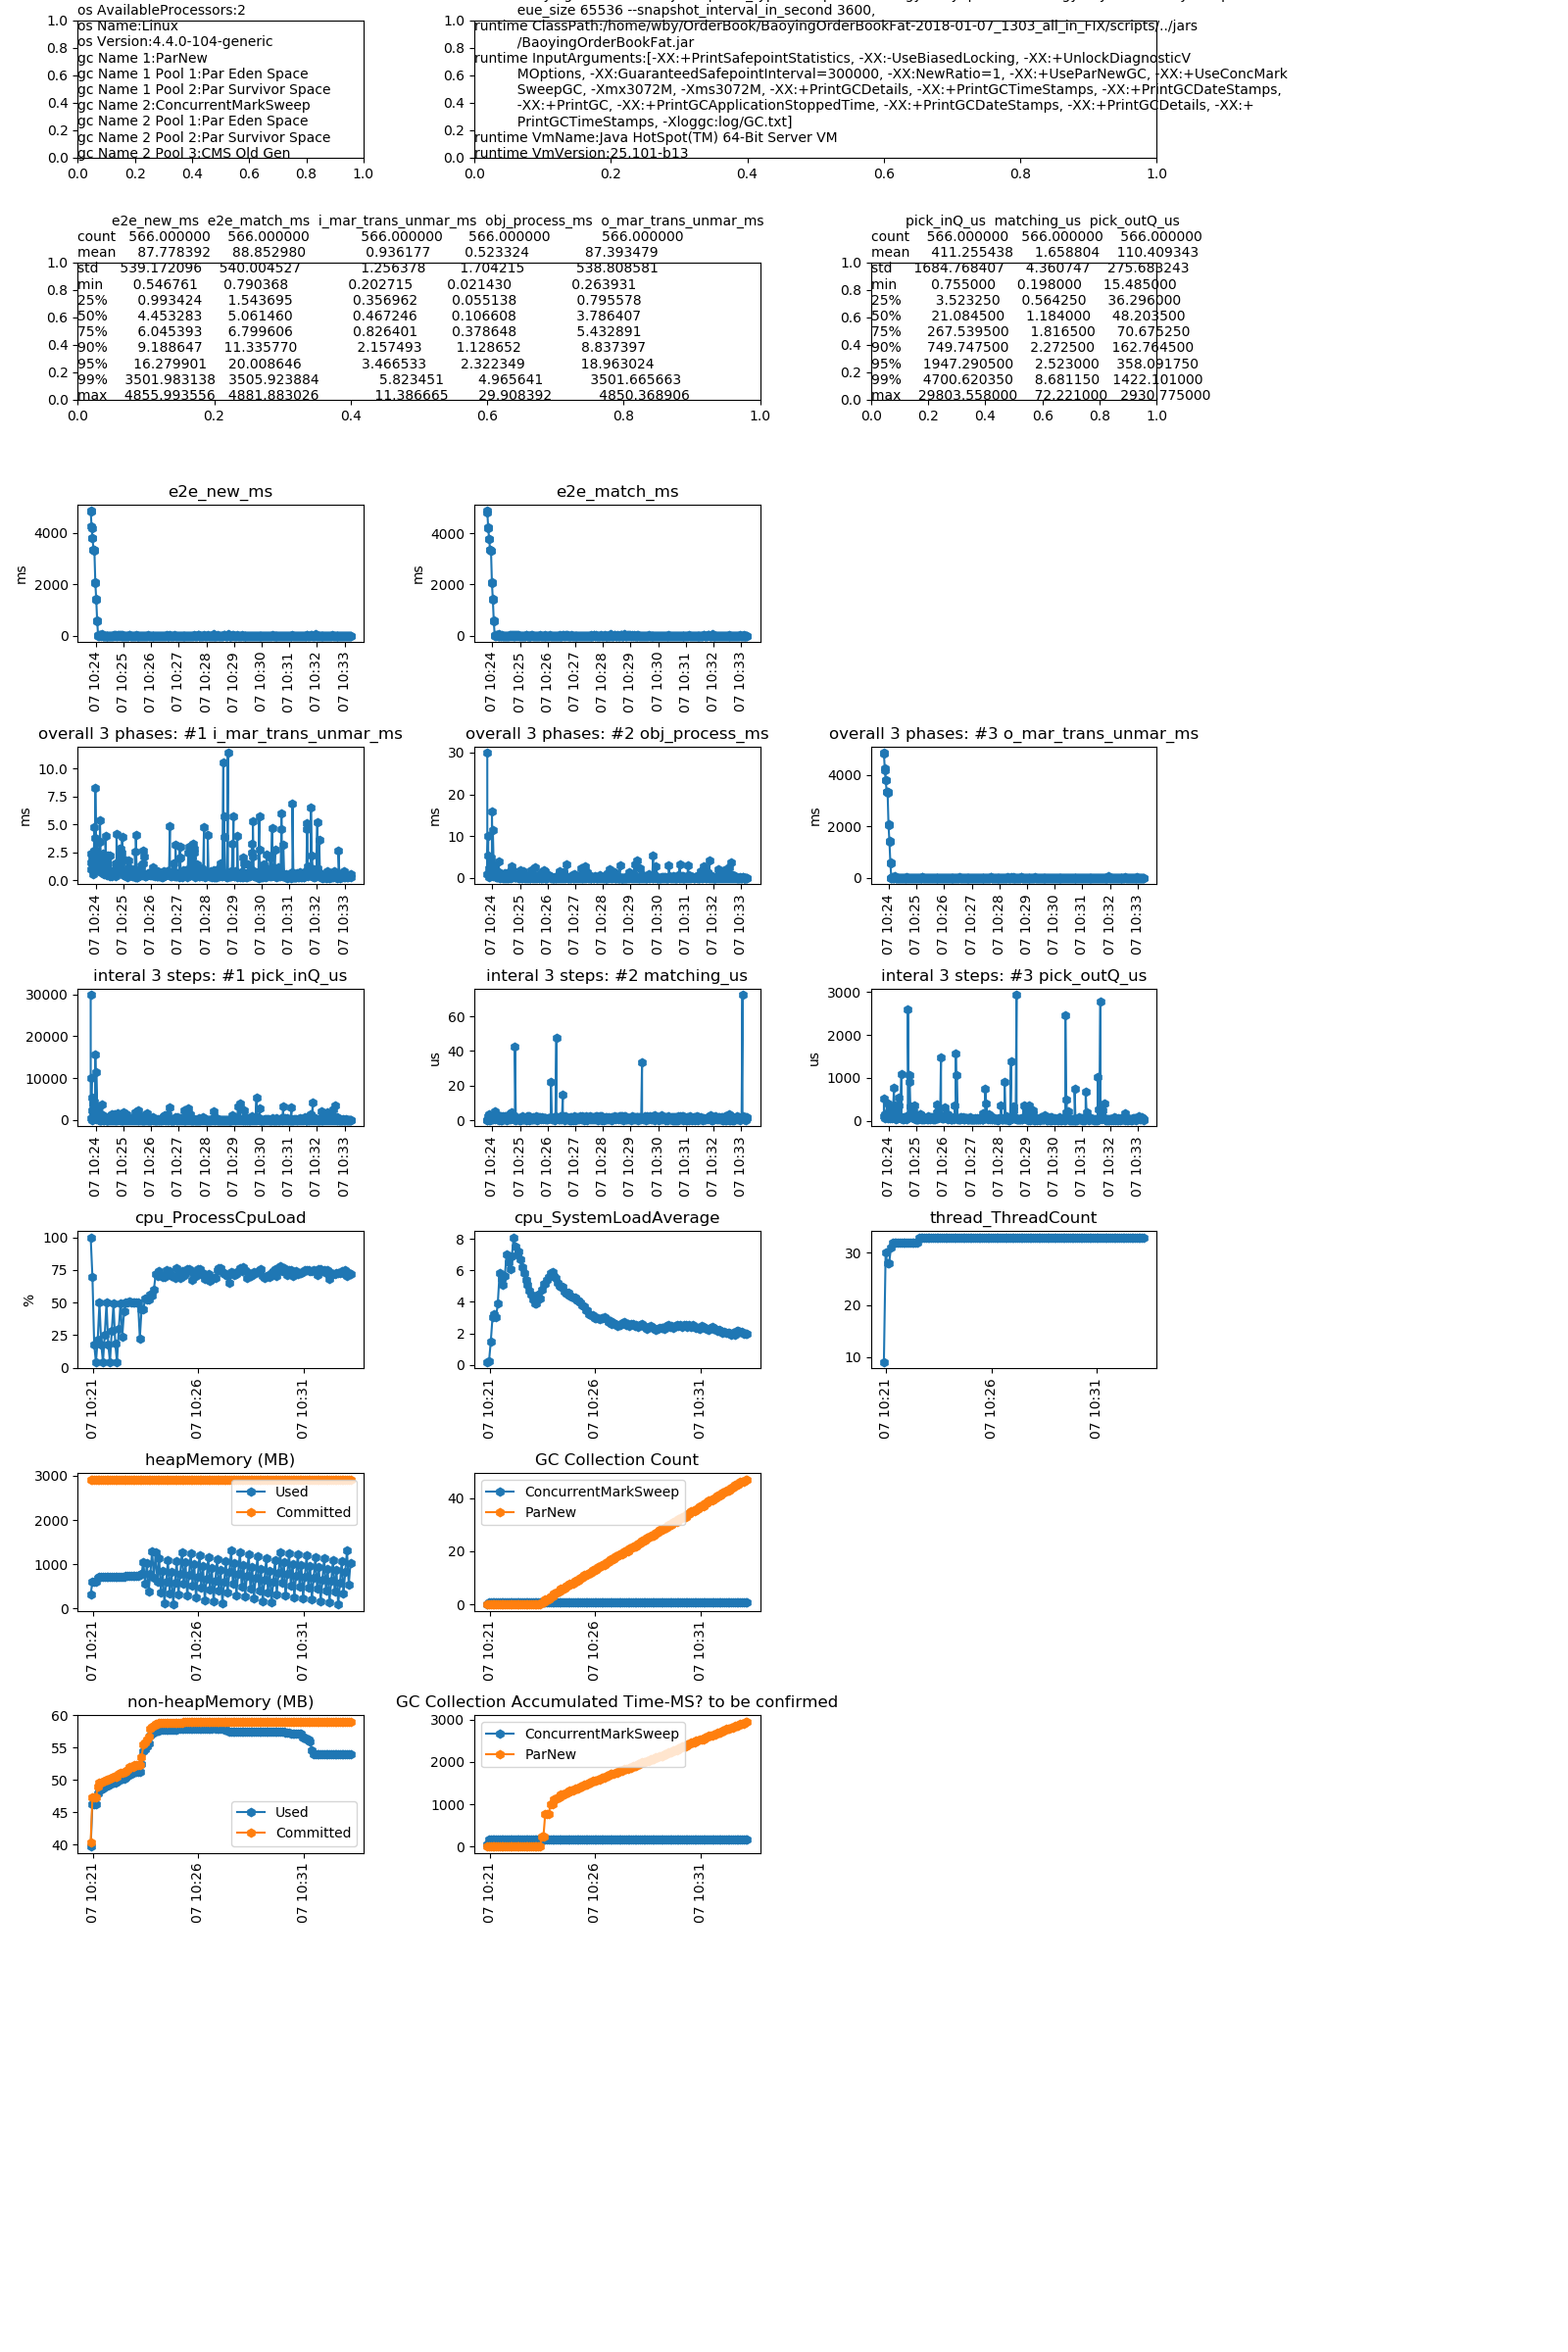
current performance - Disruptor_BusySpinWaitStrategy_bg5000perSec_lt60perMin_duration600sec_20180107_102049 (more links see the links after this diagram)
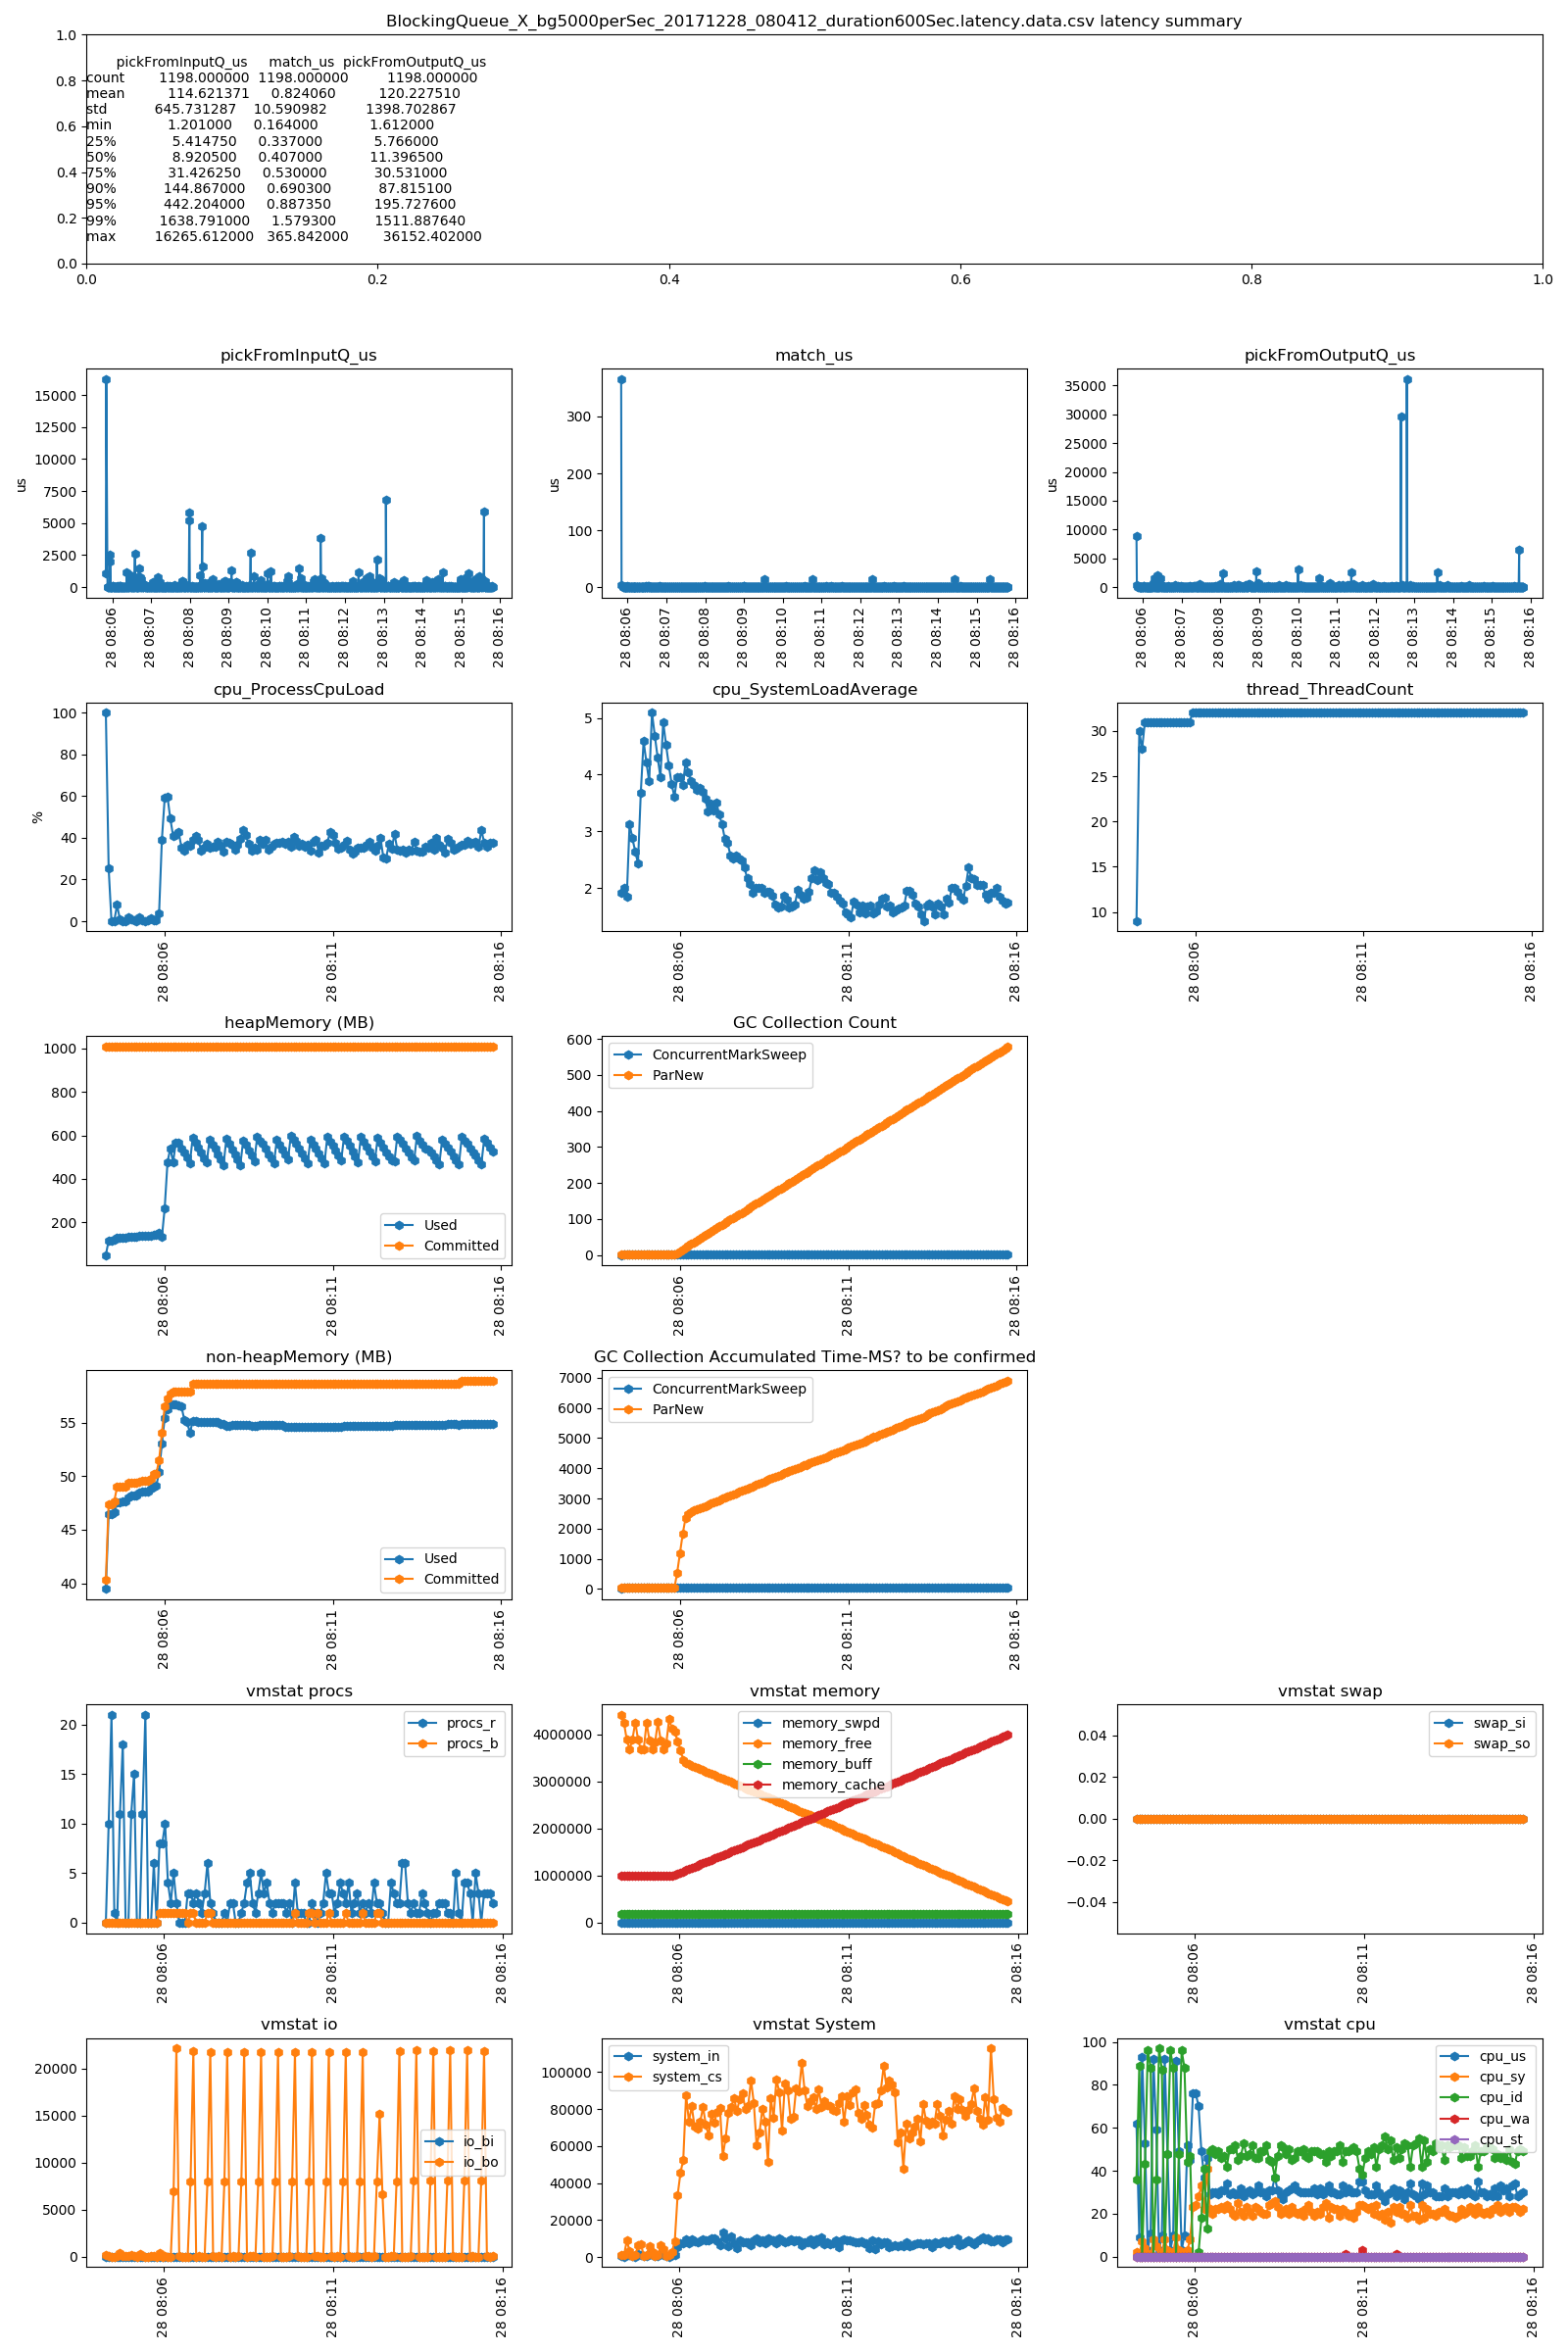
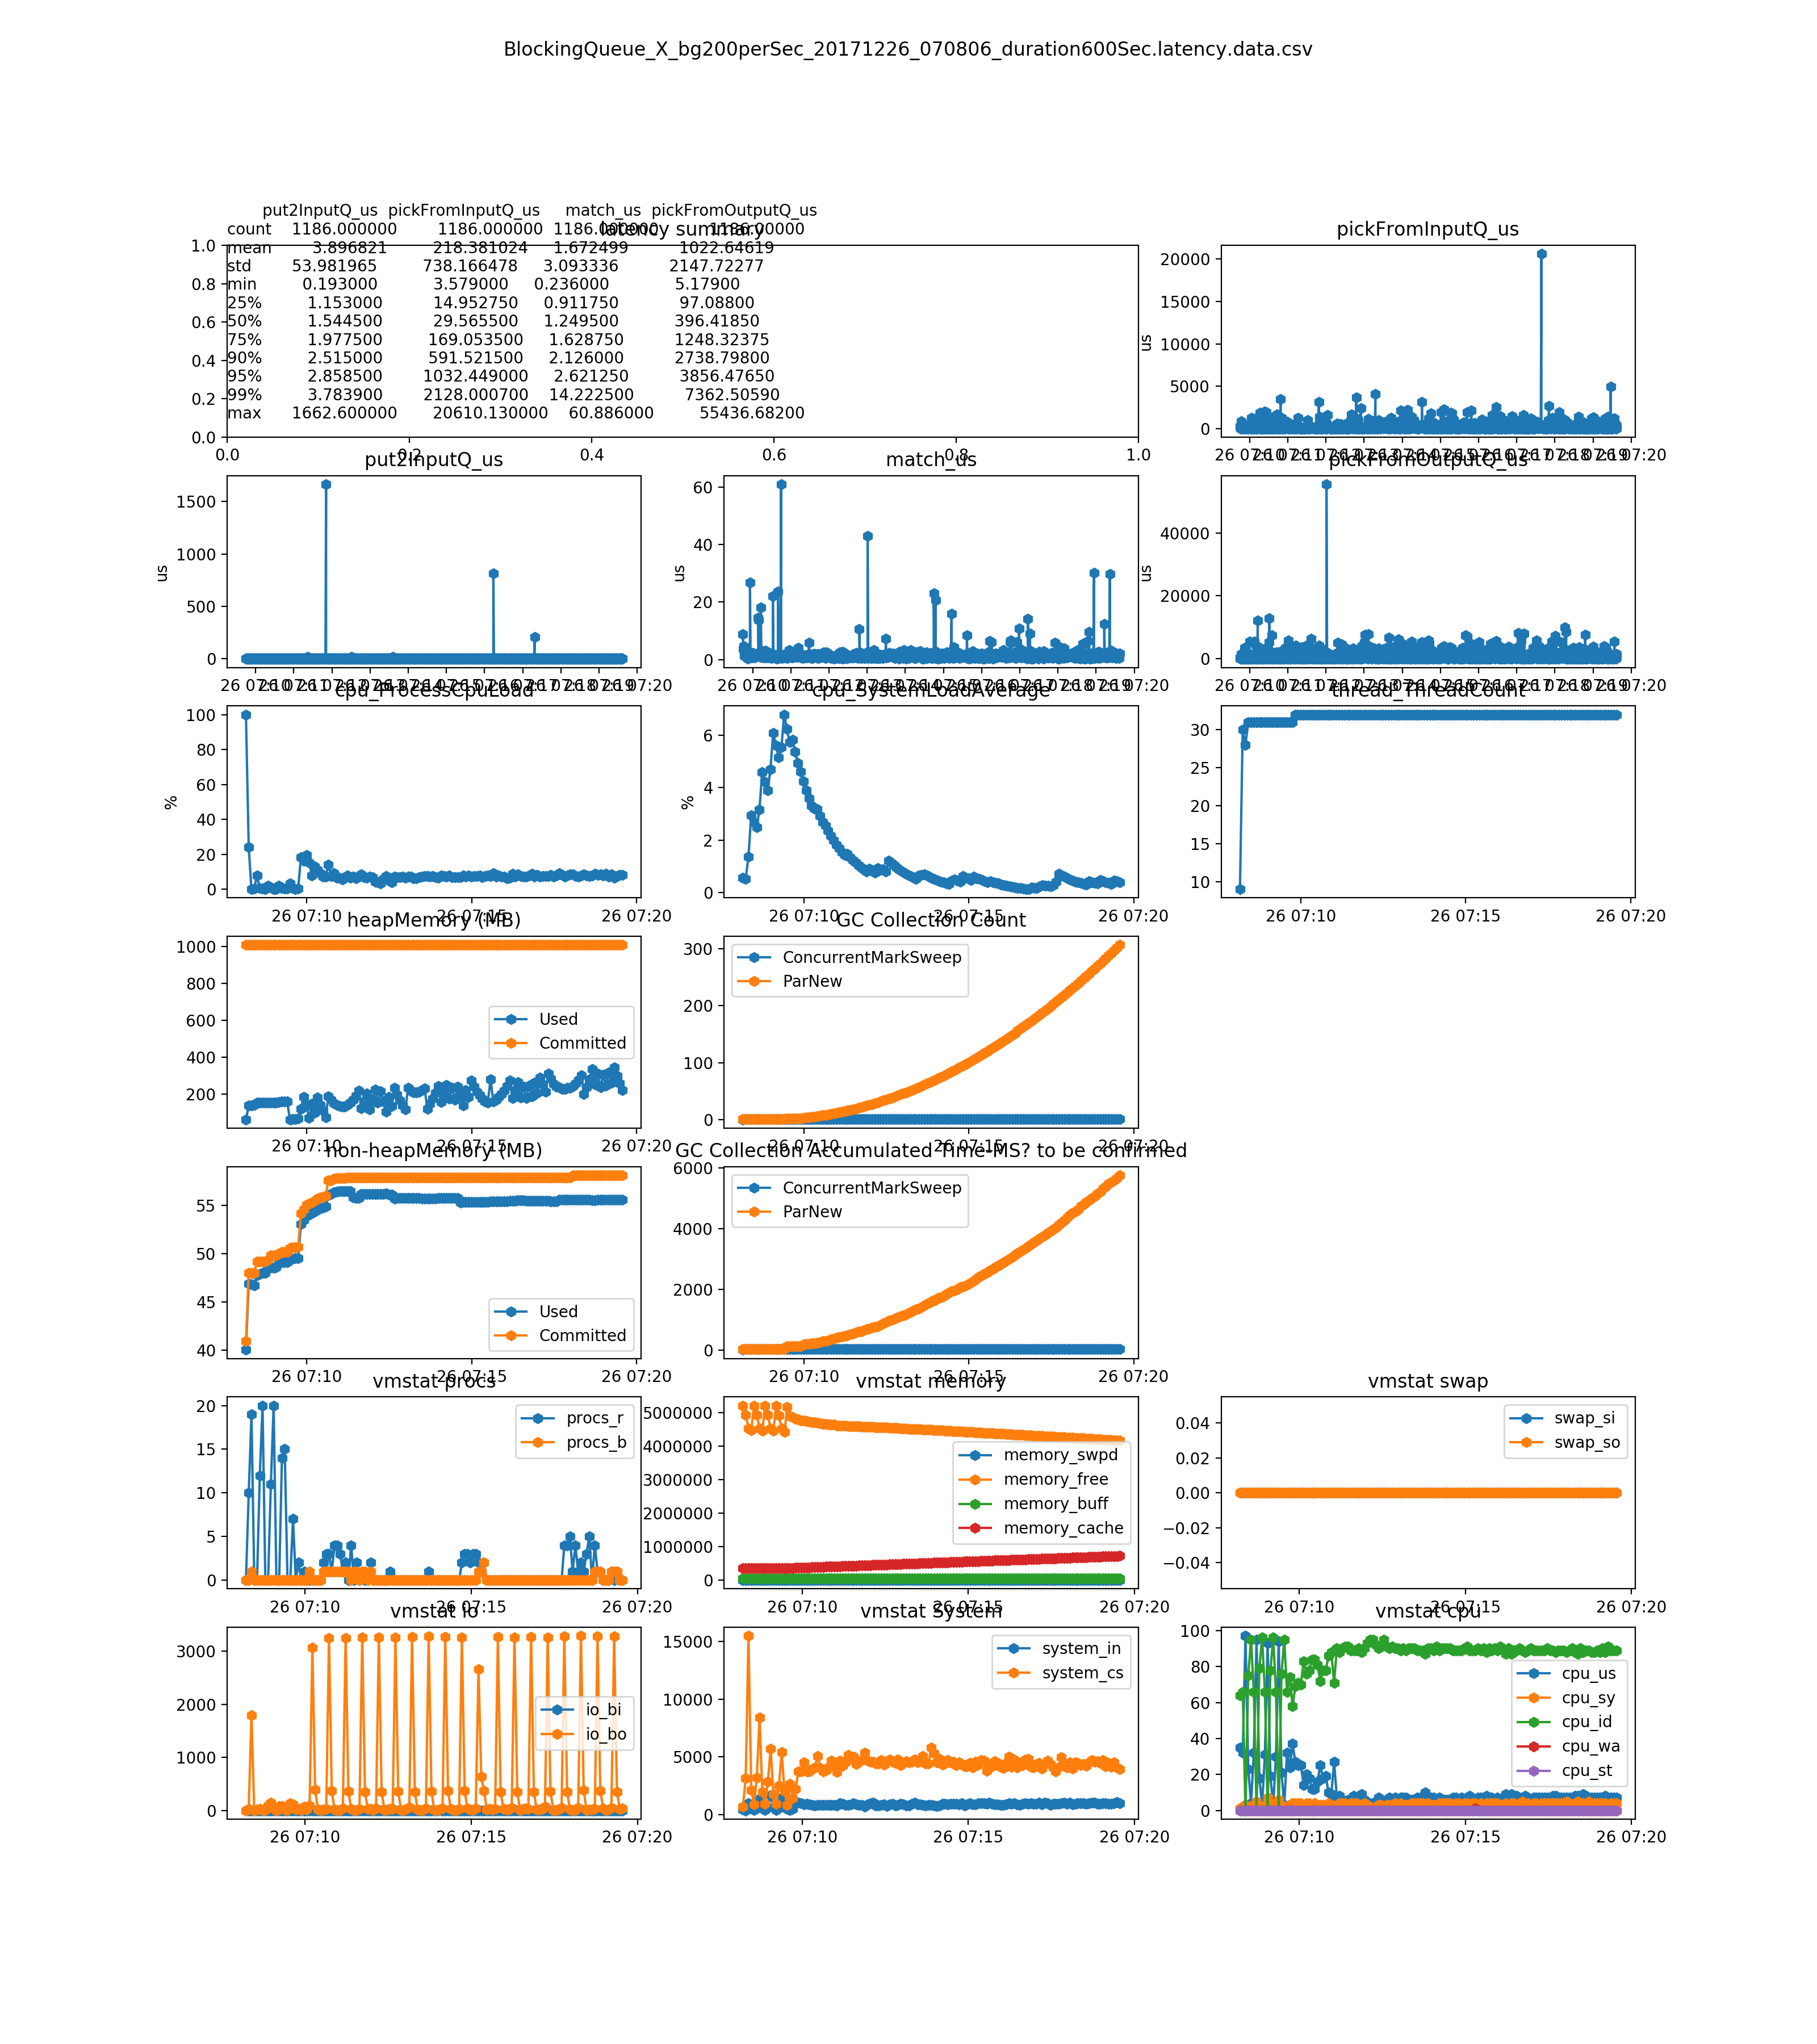
- linux BlockingQueue_X_bg5000perSec
- linux BlockingQueue_X_bg3000perSec
- linux BlockingQueue_X_bg1000perSec
- linux BlockingQueue_X_bg500perSec
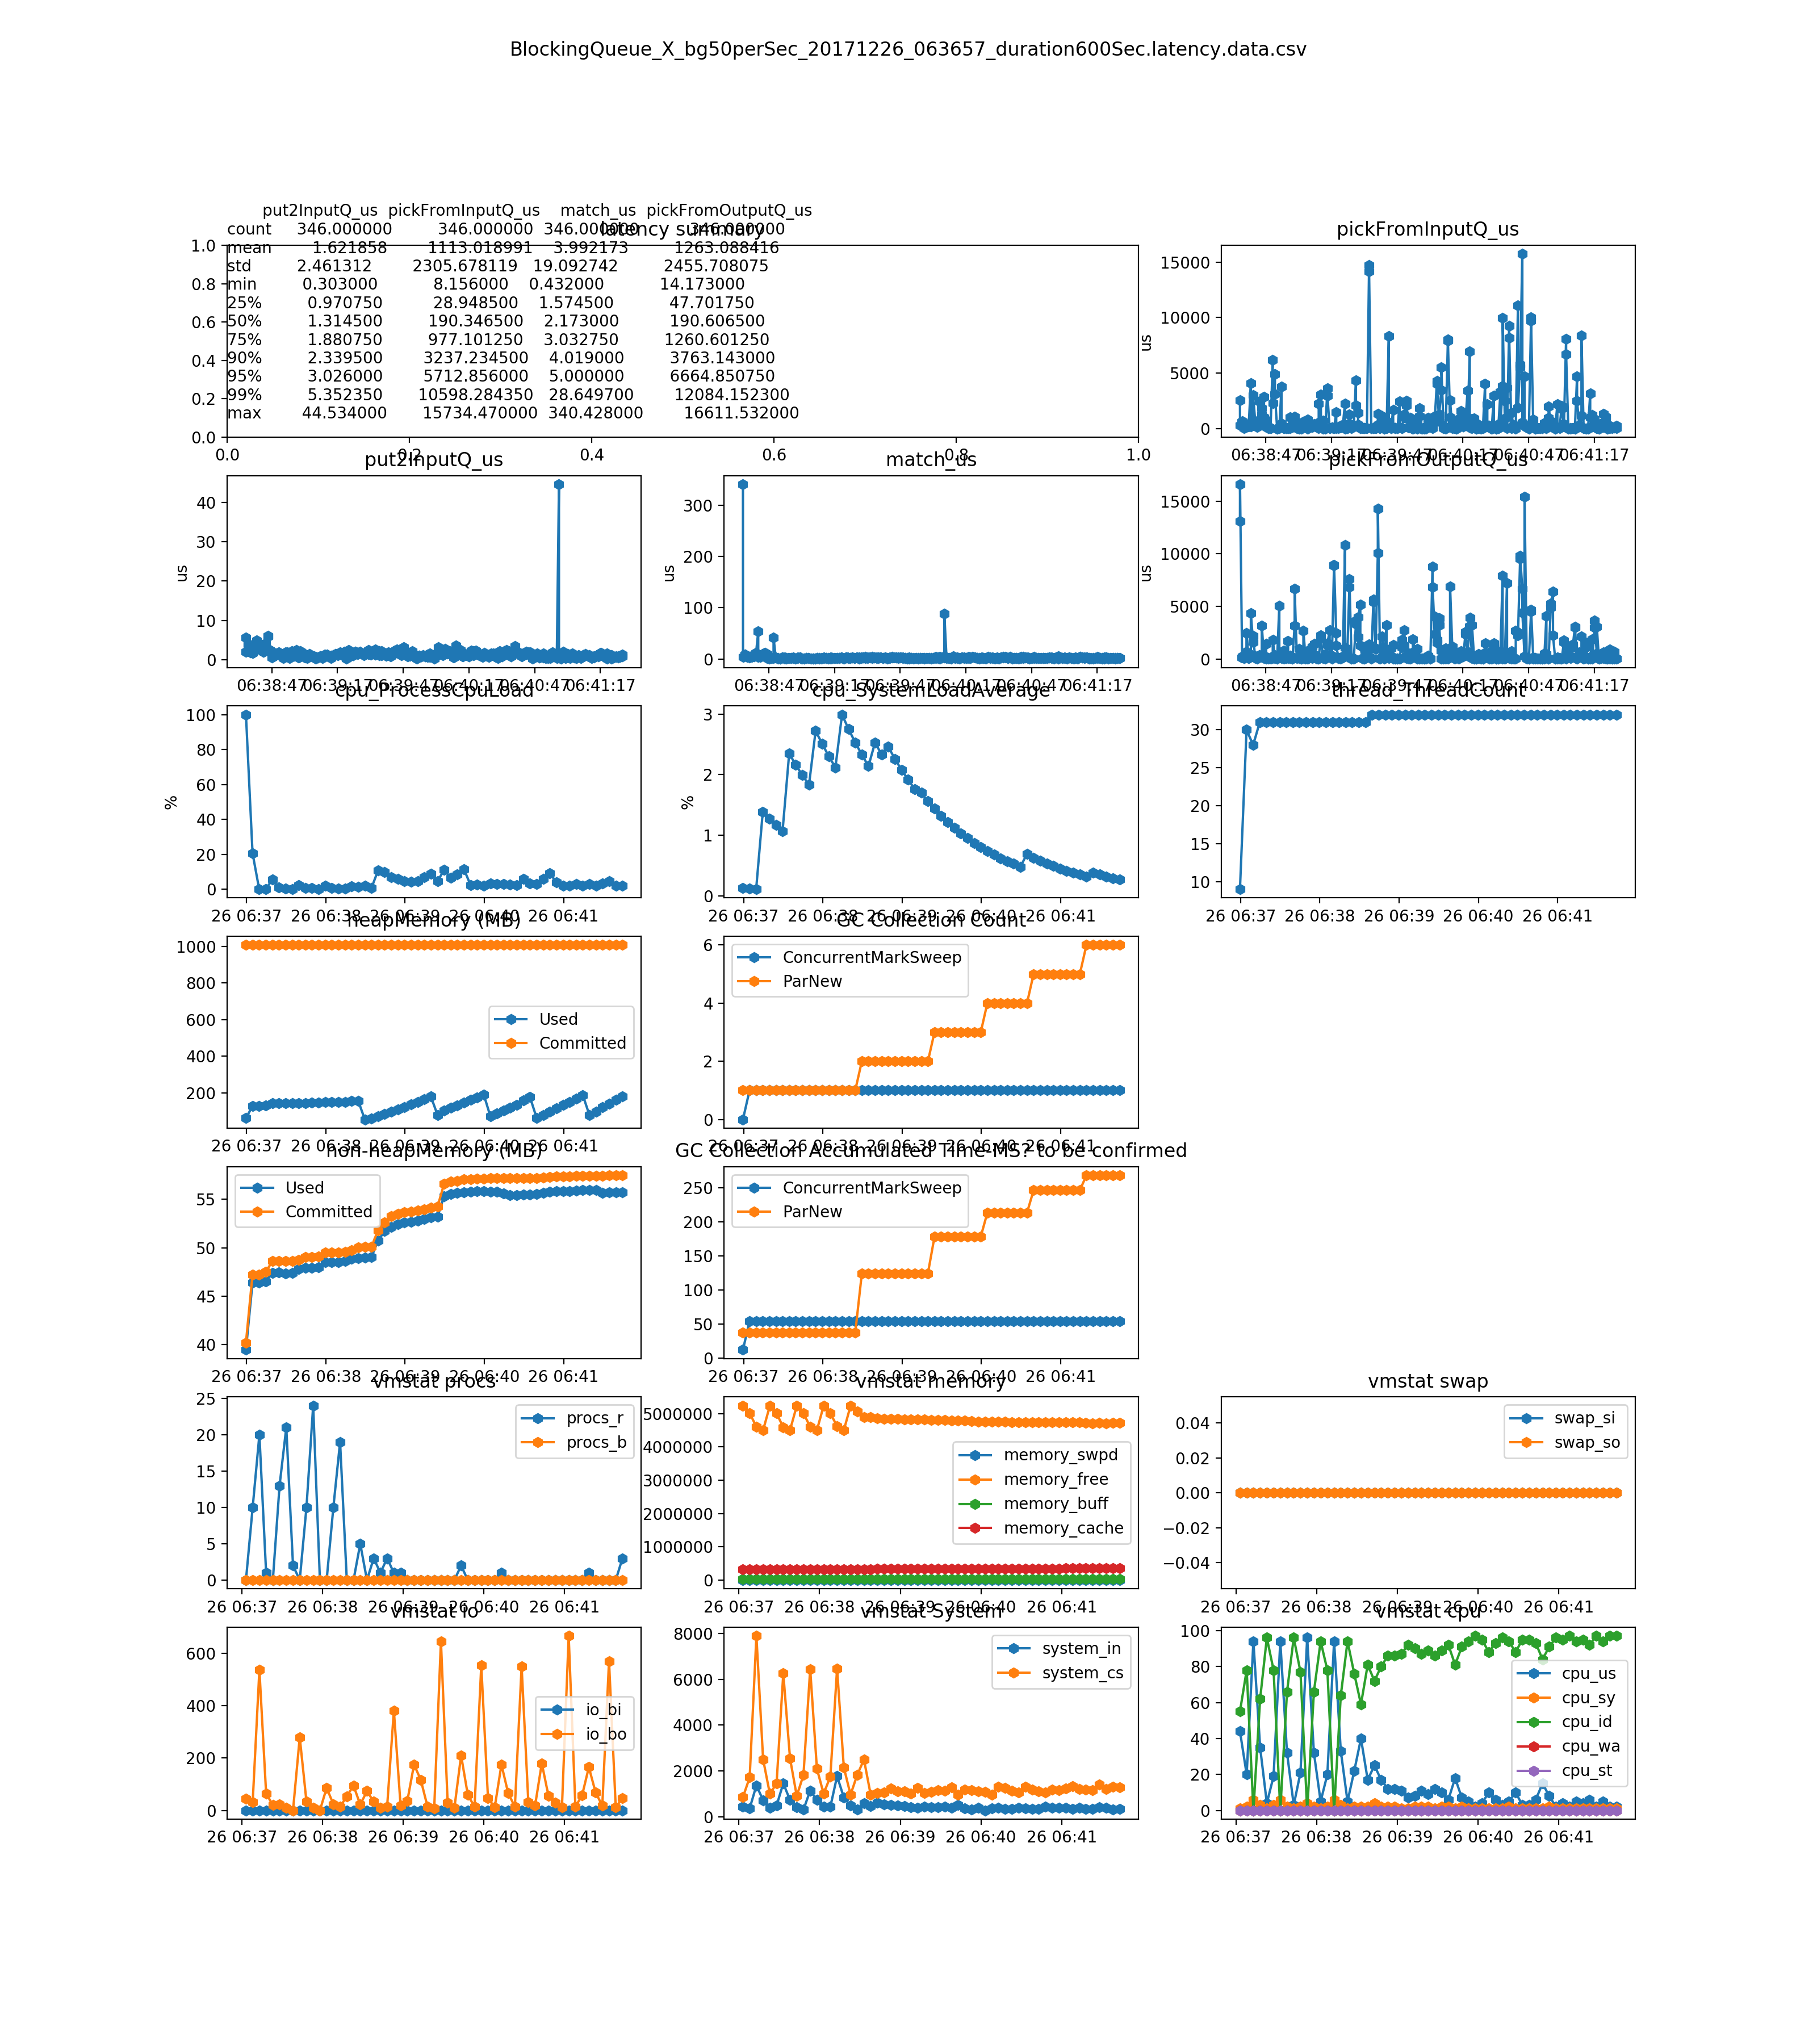
- linux BlockingQueue_X_bg50perSec
- linux Disruptor_BusySpinWaitStrategy_bg5000perSec
- linux Disruptor_BusySpinWaitStrategy_bg3000perSec
- linux Disruptor_BusySpinWaitStrategy_bg1000perSec
- linux Disruptor_BusySpinWaitStrategy_bg500perSec
- linux Disruptor_BusySpinWaitStrategy_bg50perSec
test result data - linux vm: https://raw.githubusercontent.com/wiki/baoyingwang/OrderBook/attachments/ME_1.0/ME_1.0_test.result_20180107.zips_linux.zip
- win BlockingQueue_X_bg5000perSec
- win BlockingQueue_X_bg3000perSec
- win BlockingQueue_X_bg1000perSec
- win BlockingQueue_X_bg500perSec
- win BlockingQueue_X_bg50perSec
- win Disruptor_BusySpinWaitStrategy_bg5000perSec
- win Disruptor_BusySpinWaitStrategy_bg3000perSec
- win Disruptor_BusySpinWaitStrategy_bg1000perSec
- win Disruptor_BusySpinWaitStrategy_bg500perSec
- win Disruptor_BusySpinWaitStrategy_bg50perSec
Jan 4, 2018 - compare windows and "linux vm on windows"; warm up with high rate(3000/s and 30 seconds with 60 latency/s)
test case running. note: bias lock is already disabled (-XX:-UseBiasedLocking), because we found many stop app for revoke biased lock note: extended safepoint interval to 300 seconds(-XX:+UnlockDiagnosticVMOptions, -XX:GuaranteedSafepointInterval=300000), to avoid possible app thread stop.(we found them from console) note: it supports to run on windows now(git bash is required).
Dec 31, 2017 - happy new year - 1) on 5000 order/S, session. FIX related threads(session.Send 44M/s and NIO Processor 15+15/S) are generating too many temp objects on young gen. 2) on 50 order/S, the "application stop' is very frequent.
-
on 5000 order/S, session. FIX related threads(session.Send 44M/s and NIO Processor 15+15/S) are generating too many temp objects on young gen. Object more detail from jvisualvm output(sampler - memory). It is related FIX message marshalling/un-marshalling. TODO: try to use FIX to convey JSON, to reduce FIX dictionary translations.
-
on 50 order/S, the "application stop' is very frequent. After adding "-XX:+PrintSafepointStatistics -XX:PrintSafepointStatisticsCount=1", we can see that some are RevokeBias, and others are "no vm operation". I haven't count how many of each.
arguments="--queue_type ${queue_type} --strategy ${strategy} --symbols USDJPY --queue_size 65536"
VisualVMOptions="-Dcom.sun.management.jmxremote.port=3333  -Dcom.sun.management.jmxremote.ssl=false  -Dcom.sun.management.jmxremote.authenticate=false"
GCPrintOptions="-XX:+PrintGCDetails -XX:+PrintGCTimeStamps -XX:+PrintGCDateStamps -XX:+PrintGC -XX:+PrintGCApplicationStoppedTime -XX:+PrintGCDateStamps -XX:+PrintGCDetails -XX:+PrintGCTimeStamps -Xloggc:log/GC.txt"
JVMOptions="${VisualVMOptions} -XX:+PrintSafepointStatistics -XX:PrintSafepointStatisticsCount=1 -XX:NewRatio=1 -XX:+UseParNewGC -XX:+UseConcMarkSweepGC -Xmx3072M -Xms3072M ${GCPrintOptions}"
java $JVMOptions -jar  ${jarfile} ${arguments} &
155.250: RevokeBias                       [      40          0              0    ]      [     0     0     0     0     0    ]  0
         vmop                    [threads: total initially_running wait_to_block]    [time: spin block sync cleanup vmop] page_trap_count
155.251: RevokeBias                       [      40          0              0    ]      [     0     0     0     0     0    ]  0
         vmop                    [threads: total initially_running wait_to_block]    [time: spin block sync cleanup vmop] page_trap_count
156.183: RevokeBias                       [      40          0              0    ]      [     0     0     0     0     0    ]  0
         vmop                    [threads: total initially_running wait_to_block]    [time: spin block sync cleanup vmop] page_trap_count
158.183: no vm operation                  [      40          1              0    ]      [     1     0     1     0     0    ]  0
         vmop                    [threads: total initially_running wait_to_block]    [time: spin block sync cleanup vmop] page_trap_count
161.188: no vm operation                  [      40          0              0    ]      [     0     0     0     0     0    ]  0
         vmop                    [threads: total initially_running wait_to_block]    [time: spin block sync cleanup vmop] page_trap_count
165.190: no vm operation                  [      40          0              0    ]      [     0     0     2     0     0    ]  0
found a useful article about the application stop time: https://www.lmax.com/blog/staff-blogs/2015/08/05/jvm-guaranteed-safepoints/ After disable the bias lock(TODO: why? AND why not?), my application stop is about every 1 second. It is consistent with 1000 on GuaranteedSafepointInterval (java -XX:+UnlockDiagnosticVMOptions -XX:+PrintFlagsFinal 2>&1 | grep Safepoint).
TODO: should I disable biased lock? -XX:-UseBiasedLocking , why and why not? TODO: should I increase the GuaranteedSafepointInterval(-XX:+UnlockDiagnosticVMOptions -XX:GuaranteedSafepointInterval=300000) ? e.g. to 300000(300 seconds), why and why not? see above link and ready more. (GuaranteedSafepointInterval, rather than GuaranteedSafepointTime - the value from the link is wrong on java 8). Looks like the performance data is rather good, after adding -XX:-UseBiasedLocking -XX:+UnlockDiagnosticVMOptions -XX:GuaranteedSafepointInterval=300000. The test is on going. I need sometime to determine whether these should be applied.
| young gen=150M | young gen=1400M | |||||
|---|---|---|---|---|---|---|
| inputQ_us | match_us | outputQ_us | inputQ_us | match_us | outputQ_us | |
| 1198 | 1198 | 1198 | count | 1196 | 1196 | 1196 |
| 174.4 | 1.71 | 81.72 | mean | 162.22 | 0.7 | 49.49 |
| 596.39 | 21.05 | 327.68 | std | 985.80 | 3.92 | 218.53 |
| 0.483 | 0.171 | 2.172 | min | 0.834 | 0.157 | 1.63 |
| 8.24975 | 0.56 | 9.92 | 25% | 5.08 | 0.35 | 5.715 |
| 20.031 | 0.812 | 17.7755 | 50% | 14.472 | 0.446 | 10.4905 |
| 69.7145 | 1.24075 | 37.4235 | 75% | 33.2265 | 0.565 | 24.48425 |
| 385.0197 | 1.445 | 128.7143 | 90% | 155.6775 | 0.8265 | 57.2885 |
| 740.0291 | 1.6326 | 308.6618 | 95% | 528.15925 | 1.0495 | 145.5985 |
| 2861.886 | 2.23918 | 1156.13663 | 99% | 3477.3479 | 2.2233 | 715.37735 |
| 9273.4 | 710.382 | 6689.444 | max | 22391.588 | 129.804 | 3194.357 |
note: 'pickFrom' is removed from header, to make the table easily reading on without horizontal scrollbar.
before change: minor gc every second -XX:+UseParNewGC, -XX:+UseConcMarkSweepGC, -Xmx3072M, -Xms3072M note: default ratio of new vs old (2)
2017-12-29T02:38:44.187+0000: 611.086: [GC (Allocation Failure) 2017-12-29T02:38:44.187+0000: 611.086: [ParNew: 139255K->3547K(153344K), 0.0229920 secs] 628263K->492555K(3128704K), 0.0230535 secs] [Times: user=0.04 sys=0.00, real=0.02 secs]
2017-12-29T02:38:44.211+0000: 611.110: Total time for which application threads were stopped: 0.0239491 seconds, Stopping threads took: 0.0000664 seconds
2017-12-29T02:38:45.221+0000: 612.119: [GC (Allocation Failure) 2017-12-29T02:38:45.221+0000: 612.119: [ParNew: 139867K->2912K(153344K), 0.0259835 secs] 628875K->491920K(3128704K), 0.0260498 secs] [Times: user=0.03 sys=0.00, real=0.03 secs]
2017-12-29T02:38:45.247+0000: 612.145: Total time for which application threads were stopped: 0.0312989 seconds, Stopping threads took: 0.0050753 seconds
2017-12-29T02:38:46.177+0000: 613.075: [GC (Allocation Failure) 2017-12-29T02:38:46.177+0000: 613.075: [ParNew: 139232K->3204K(153344K), 0.0161876 secs] 628240K->492213K(3128704K), 0.0162461 secs] [Times: user=0.03 sys=0.00, real=0.02 secs]
2017-12-29T02:38:46.193+0000: 613.092: Total time for which application threads were stopped: 0.0164855 seconds, Stopping threads took: 0.0000510 seconds
2017-12-29T02:38:47.178+0000: 614.077: [GC (Allocation Failure) 2017-12-29T02:38:47.178+0000: 614.077: [ParNew: 139524K->2971K(153344K), 0.0155237 secs] 628533K->491980K(3128704K), 0.0155831 secs] [Times: user=0.03 sys=0.00, real=0.02 secs]
2017-12-29T02:38:47.194+0000: 614.093: Total time for which application threads were stopped: 0.0157783 seconds, Stopping threads took: 0.0000319 seconds
2017-12-29T02:38:48.178+0000: 615.077: [GC (Allocation Failure) 2017-12-29T02:38:48.178+0000: 615.077: [ParNew: 139291K->2868K(153344K), 0.0174023 secs] 628300K->491878K(3128704K), 0.0174582 secs] [Times: user=0.03 sys=0.00, real=0.02 secs]
2017-12-29T02:38:48.195+0000: 615.094: Total time for which application threads were stopped: 0.0176585 seconds, Stopping threads took: 0.0000294 seconds
2017-12-29T02:38:49.177+0000: 616.076: [GC (Allocation Failure) 2017-12-29T02:38:49.177+0000: 616.076: [ParNew: 139188K->2841K(153344K), 0.0160903 secs] 628198K->491852K(3128704K), 0.0175685 secs] [Times: user=0.03 sys=0.00, real=0.02 secs]
2017-12-29T02:38:49.195+0000: 616.094: Total time for which application threads were stopped: 0.0178737 seconds, Stopping threads took: 0.0000374 seconds
2017-12-29T02:38:50.177+0000: 617.076: [GC (Allocation Failure) 2017-12-29T02:38:50.177+0000: 617.076: [ParNew: 139161K->2884K(153344K), 0.0157959 secs] 628172K->491895K(3128704K), 0.0158495 secs] [Times: user=0.03 sys=0.00, real=0.02 secs]
--BlockingQueue_X_bg5000perSec_20171229_022833_duration600Sec.GC.txt
after change: minor GC per 10 seconds with bigger young generation(1415616K) -XX:NewRatio=1, -XX:+UseParNewGC, -XX:+UseConcMarkSweepGC, -Xmx3072M, -Xms3072M
2017-12-29T08:45:05.656+0000: 576.504: [GC (Allocation Failure) 2017-12-29T08:45:05.656+0000: 576.504: [ParNew: 1261305K->2911K(1415616K), 0.0137893 secs] 1290985K->32620K(2988480K), 0.0138477 secs] [Times: user=0.02 sys=0.00, real=0.01 secs]
2017-12-29T08:45:05.670+0000: 576.518: Total time for which application threads were stopped: 0.0141363 seconds, Stopping threads took: 0.0000715 seconds
2017-12-29T08:45:14.841+0000: 585.689: [GC (Allocation Failure) 2017-12-29T08:45:14.841+0000: 585.689: [ParNew: 1261279K->2912K(1415616K), 0.0135910 secs] 1290988K->32624K(2988480K), 0.0136448 secs] [Times: user=0.02 sys=0.01, real=0.02 secs]
2017-12-29T08:45:14.855+0000: 585.703: Total time for which application threads were stopped: 0.0138769 seconds, Stopping threads took: 0.0000689 seconds
2017-12-29T08:45:24.003+0000: 594.851: [GC (Allocation Failure) 2017-12-29T08:45:24.003+0000: 594.851: [ParNew: 1261280K->2923K(1415616K), 0.0141921 secs] 1290992K->32639K(2988480K), 0.0142494 secs] [Times: user=0.03 sys=0.00, real=0.02 secs]
2017-12-29T08:45:24.017+0000: 594.865: Total time for which application threads were stopped: 0.0144154 seconds, Stopping threads took: 0.0000326 seconds
2017-12-29T08:45:33.226+0000: 604.074: [GC (Allocation Failure) 2017-12-29T08:45:33.226+0000: 604.074: [ParNew: 1261291K->2907K(1415616K), 0.0132034 secs] 1291007K->32627K(2988480K), 0.0132546 secs] [Times: user=0.03 sys=0.00, real=0.01 secs]
2017-12-29T08:45:33.240+0000: 604.088: Total time for which application threads were stopped: 0.0134510 seconds, Stopping threads took: 0.0000267 seconds
2017-12-29T08:45:42.401+0000: 613.249: [GC (Allocation Failure) 2017-12-29T08:45:42.401+0000: 613.249: [ParNew: 1261275K->2952K(1415616K), 0.0114524 secs] 1290995K->32675K(2988480K), 0.0115035 secs] [Times: user=0.02 sys=0.00, real=0.02 secs]
2017-12-29T08:45:42.413+0000: 613.261: Total time for which application threads were stopped: 0.0160465 seconds, Stopping threads took: 0.0043239 seconds
--BlockingQueue_X_bg5000perSec_20171229_083529_duration600Sec.GC.txt
Question: why/who is generation 1G objects within 10 seconds? Is it normally? TODO: use visualvm to find the related thread(sampler -> memory -> per thread allocation -> delta) - The visualvm told me that it is the "QFJ Message Processor" which allocated the huge memory. This is the thread which invokes the callback of my own logic.
- bug fix on the rate calc on test tool while bigger than 200; Previously, it was not 500, but 4000 per second.
- OMS ignore latency order too; Memory usage is lower down.
- testtool use multi threads to avoid possible tcp block on huge traffic
See the test result on much higher load - 5000 orders per second
The different strategies are similar on the test result. So, we just check one of them. Dumped the heap while re-running, and found that
-
the OMS used too many memory(200M+). TODO: OMS should ignore latency orders. Right now, it only ignore background orders. One instance of "baoying.orderbook.app.SimpleOMSEngine" loaded by "sun.misc.Launcher$AppClassLoader @ 0xcaf702a8" occupies 233,014,992 (30.12%) bytes. The memory is accumulated in one instance of "java.util.concurrent.ConcurrentHashMap$Node[]" loaded by "".
-
the FIX IO used too many memory(150M + 130M). I suspect it is because of slow consumer issue. The FIX testtool clients cannot handle such high volume messages. TODO: re-test, after improving the performance of FIX testtool clients, e.g. switch multi threads, or improve the logging, or both. Right now, the testtool client has disable FIX storage. One instance of "org.apache.mina.transport.socket.nio.NioSocketSession" loaded by "sun.misc.Launcher$AppClassLoader @ 0xcaf702a8" occupies 158,170,400 (20.45%) bytes. One instance of "org.apache.mina.transport.socket.nio.NioSocketSession" loaded by "sun.misc.Launcher$AppClassLoader @ 0xcaf702a8" occupies 132,223,776 (17.09%) bytes.
-
executor(since thread) of event bus queued too many tasks Since the FIX IO was blocked. The tasks(which invoke FIX IO) cannot proceed, then all queued here. We still need focus on FIX IO. One instance of "java.util.concurrent.ThreadPoolExecutor" loaded by "" occupies 154,390,240 (19.96%) bytes. The instance is referenced by com.google.common.eventbus.Subscriber$SynchronizedSubscriber @ 0xcc6ff340 , loaded by "sun.misc.Launcher$AppClassLoader @ 0xcaf702a8".
-
the engine cannot handle messages after 2 minutes. You can see many metric changes at that time(around 07:44 - Blocking Q 500msg), e.g. vmstat memory cache(Linux vmstat命令实战详解 https://www.cnblogs.com/ggjucheng/archive/2012/01/05/2312625.html)
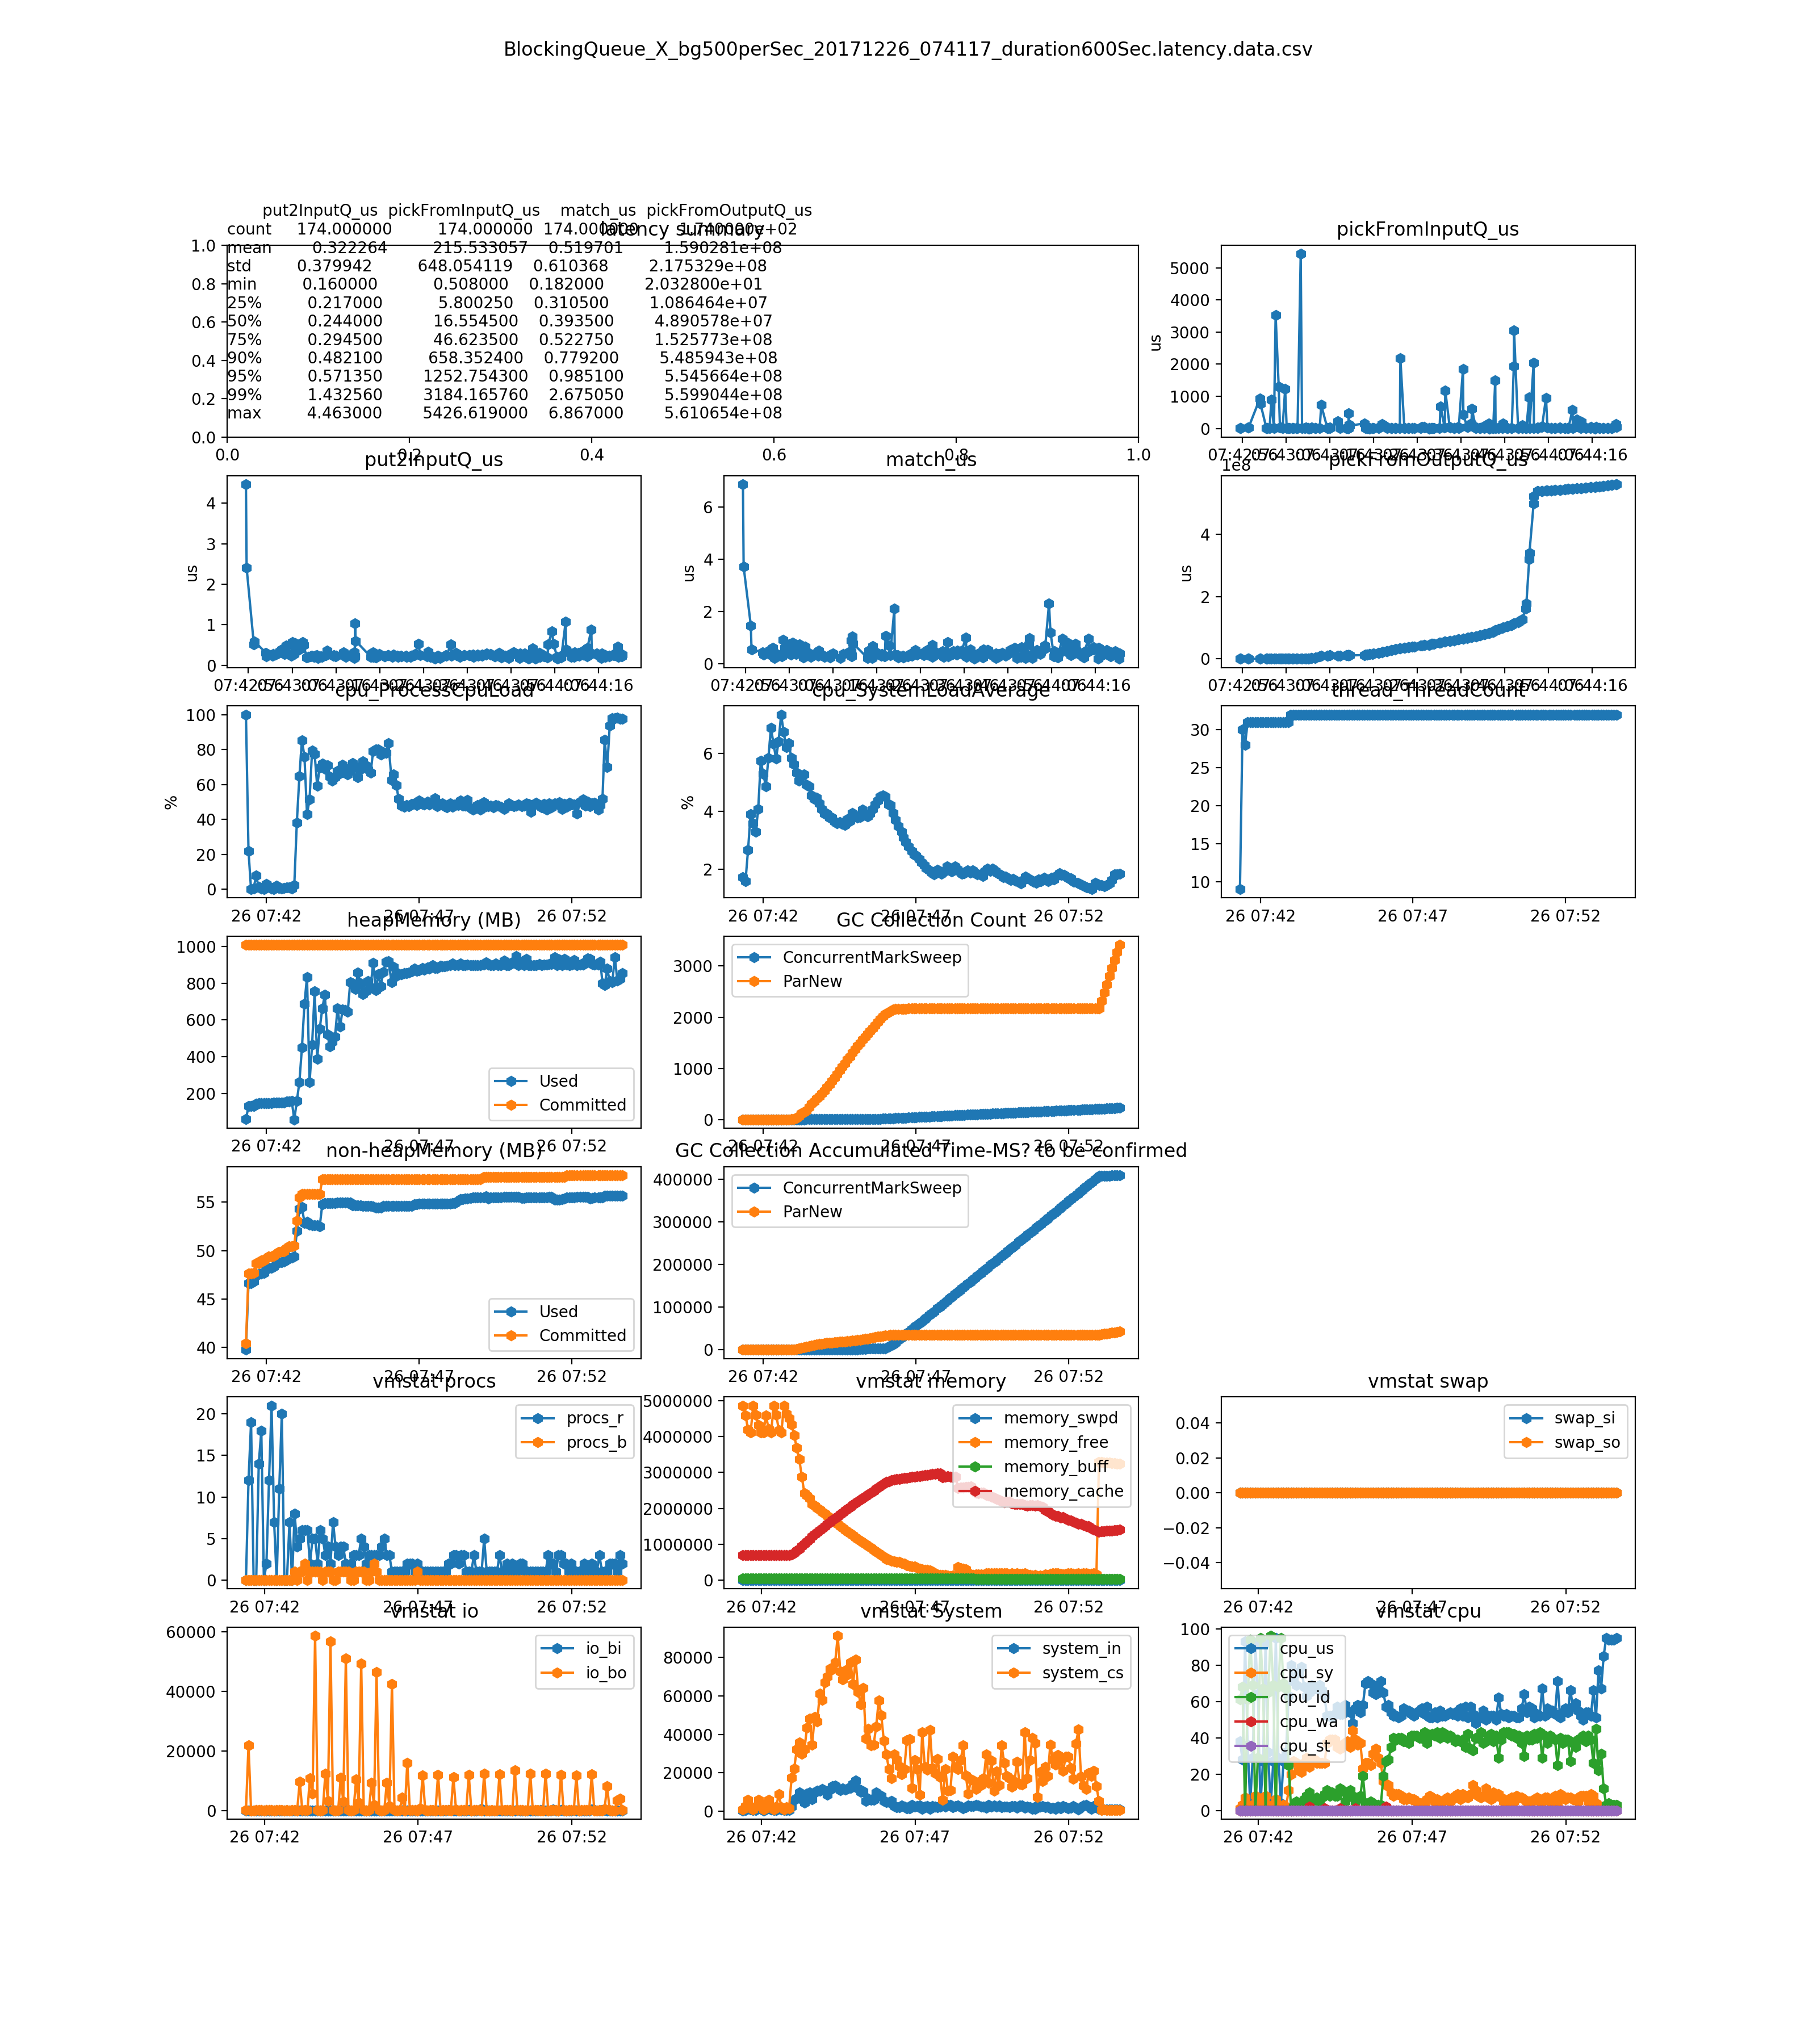
btw - performance of single cpu is very very bad ( my vm was assigned with single cpu initially)
Test System Basic Info - It is a linux VM on win 7 64bit
gc Name 1:ParNew
gc Name 1 Pool 1:Par Eden Space
gc Name 1 Pool 2:Par Survivor Space
gc Name 2:ConcurrentMarkSweep
gc Name 2 Pool 1:Par Eden Space
gc Name 2 Pool 2:Par Survivor Space
gc Name 2 Pool 3:CMS Old Gen
os Arch:amd64
os AvailableProcessors:2
os Name:Linux
os Version:4.4.0-104-generic
runtime Name:7716@BaoyingUbuntu
runtime SpecName:Java Virtual Machine Specification
runtime SpecVendor:Oracle Corporation
runtime SpecVersion:1.8
runtime VmName:Java HotSpot(TM) 64-Bit Server VM
runtime VmVendor:Oracle Corporation
runtime VmVersion:25.101-b13
Summary
- the match_us is very stable on any load
- the pickFromOutputQ_us dramatically increases on load 500 order per second. It is related with the 1) thread model. Single thread on ER bus to update local cache(OMS) and to send external FIX tool. It can be mitigated by setup a new dedicated thread for sending orders to external FIX tool. 2) during high load, it prints much more logs 3) and memory usage are increasing, because the messages cannot be consumed in time
- no much difference between the Disruptor_BusySpinWaitStrategy and Disruptor_BusySpinWaitStrategy. The Disrtuptor document says BusySpinWaitStrategy is for low latency , and BusySpinWaitStrategy is for ultra low latency. We could only use BusySpinWaitStrategy for performance tuning, since they use similar resource(mainly on CPU)
Test Result Data is here: 20171226_test_result_data.zip note: looks like not easy to understand, if you haven't read the code or this wiki.

500 per second on diff strategies(the system cannot handle this load. You can see it from the pickFromOutputQ_us sub-plot)
diagrams are removed, since the testtool has a bug on rate calculation. It is rate is 4000+ during that, rather than expected 500.
| type | put2InputQ_us | pickFromInputQ_us | match_us | pickFromOutputQ_us |
|---|---|---|---|---|
| count | 449.0 | 449.0 | 449.0 | 449.0 |
| mean | 0.626 | 268.639 | 1.603 | 194.84 |
| std | 0.5526 | 3131.712 | 2.628 | 550.56 |
| min | 0.0 | 0.365 | 0.364 | 2.187 |
| 25% | 0.365 | 4.376 | 1.094 | 13.856 |
| 50% | 0.365 | 5.469 | 1.458 | 17.138 |
| 75% | 0.729 | 6.928 | 1.823 | 125.074 |
| 90% | 0.73 | 116.0304 | 2.188 | 564.0354 |
| 95% | 1.094 | 548.4284 | 2.917 | 737.3152 |
| 99% | 2.917 | 825.12152 | 5.13416 | 1923.83112 |
| max | 6.563 | 50235.161 | 53.967 | 8923.994 |
LMAX DISRUPTOR - https://github.com/LMAX-Exchange/disruptor/wiki/Getting-Started
Replace only pickFromInputQ with DISRUPTOR(+BusySpinWaitStrategy). We can see the performance is improved signifigantly(see the pickFromInputQ_us column).
- note: But CPU usage is high(50% for my 4 cores cpu - intel i7-6600u 2.60GHz)
- note: similar performance with ArrayBlockingQueue, if default strategy(SleepingWaitStrategy) is used.
| type | put2InputQ_us | pickFromInputQ_us | match_us | pickFromOutputQ_us |
|---|---|---|---|---|
| count | 121.0 | 121.0 | 121.0 | 121.0 |
| mean | 0.66 | 18.777 | 2.1426 | 225.59499173553718 |
| std | 0.29 | 81.192 | 0.438 | 1693.880477760186 |
| min | 0.364 | 4.74 | 1.094 | 8.022 |
| 25% | 0.365 | 5.835 | 1.823 | 10.939 |
| 50% | 0.729 | 6.563 | 2.188 | 12.398 |
| 75% | 0.729 | 7.293 | 2.188 | 14.585 |
| 90% | 1.094 | 8.386 | 2.553 | 138.924 |
| 95% | 1.094 | 8.751 | 2.917 | 634.457 |
| 99% | 1.459 | 514.2748 | 3.282 | 996.827399999999 |
| max | 1.824 | 654.877 | 3.646 | 18588.879 |
note: this data has removed heading 50 latency data, avoid the warm up impact(which did impact-to be investigated).
Test Data
{
	"start_time":"2017-12-17T02:40:27.120Z",
	"rate_per_second":"4.52",
	"order_count":2203,
	"end_time":"2017-12-17T02:48:35.018Z",
	"duration_in_second":487,
	"latency_data_count":173
}
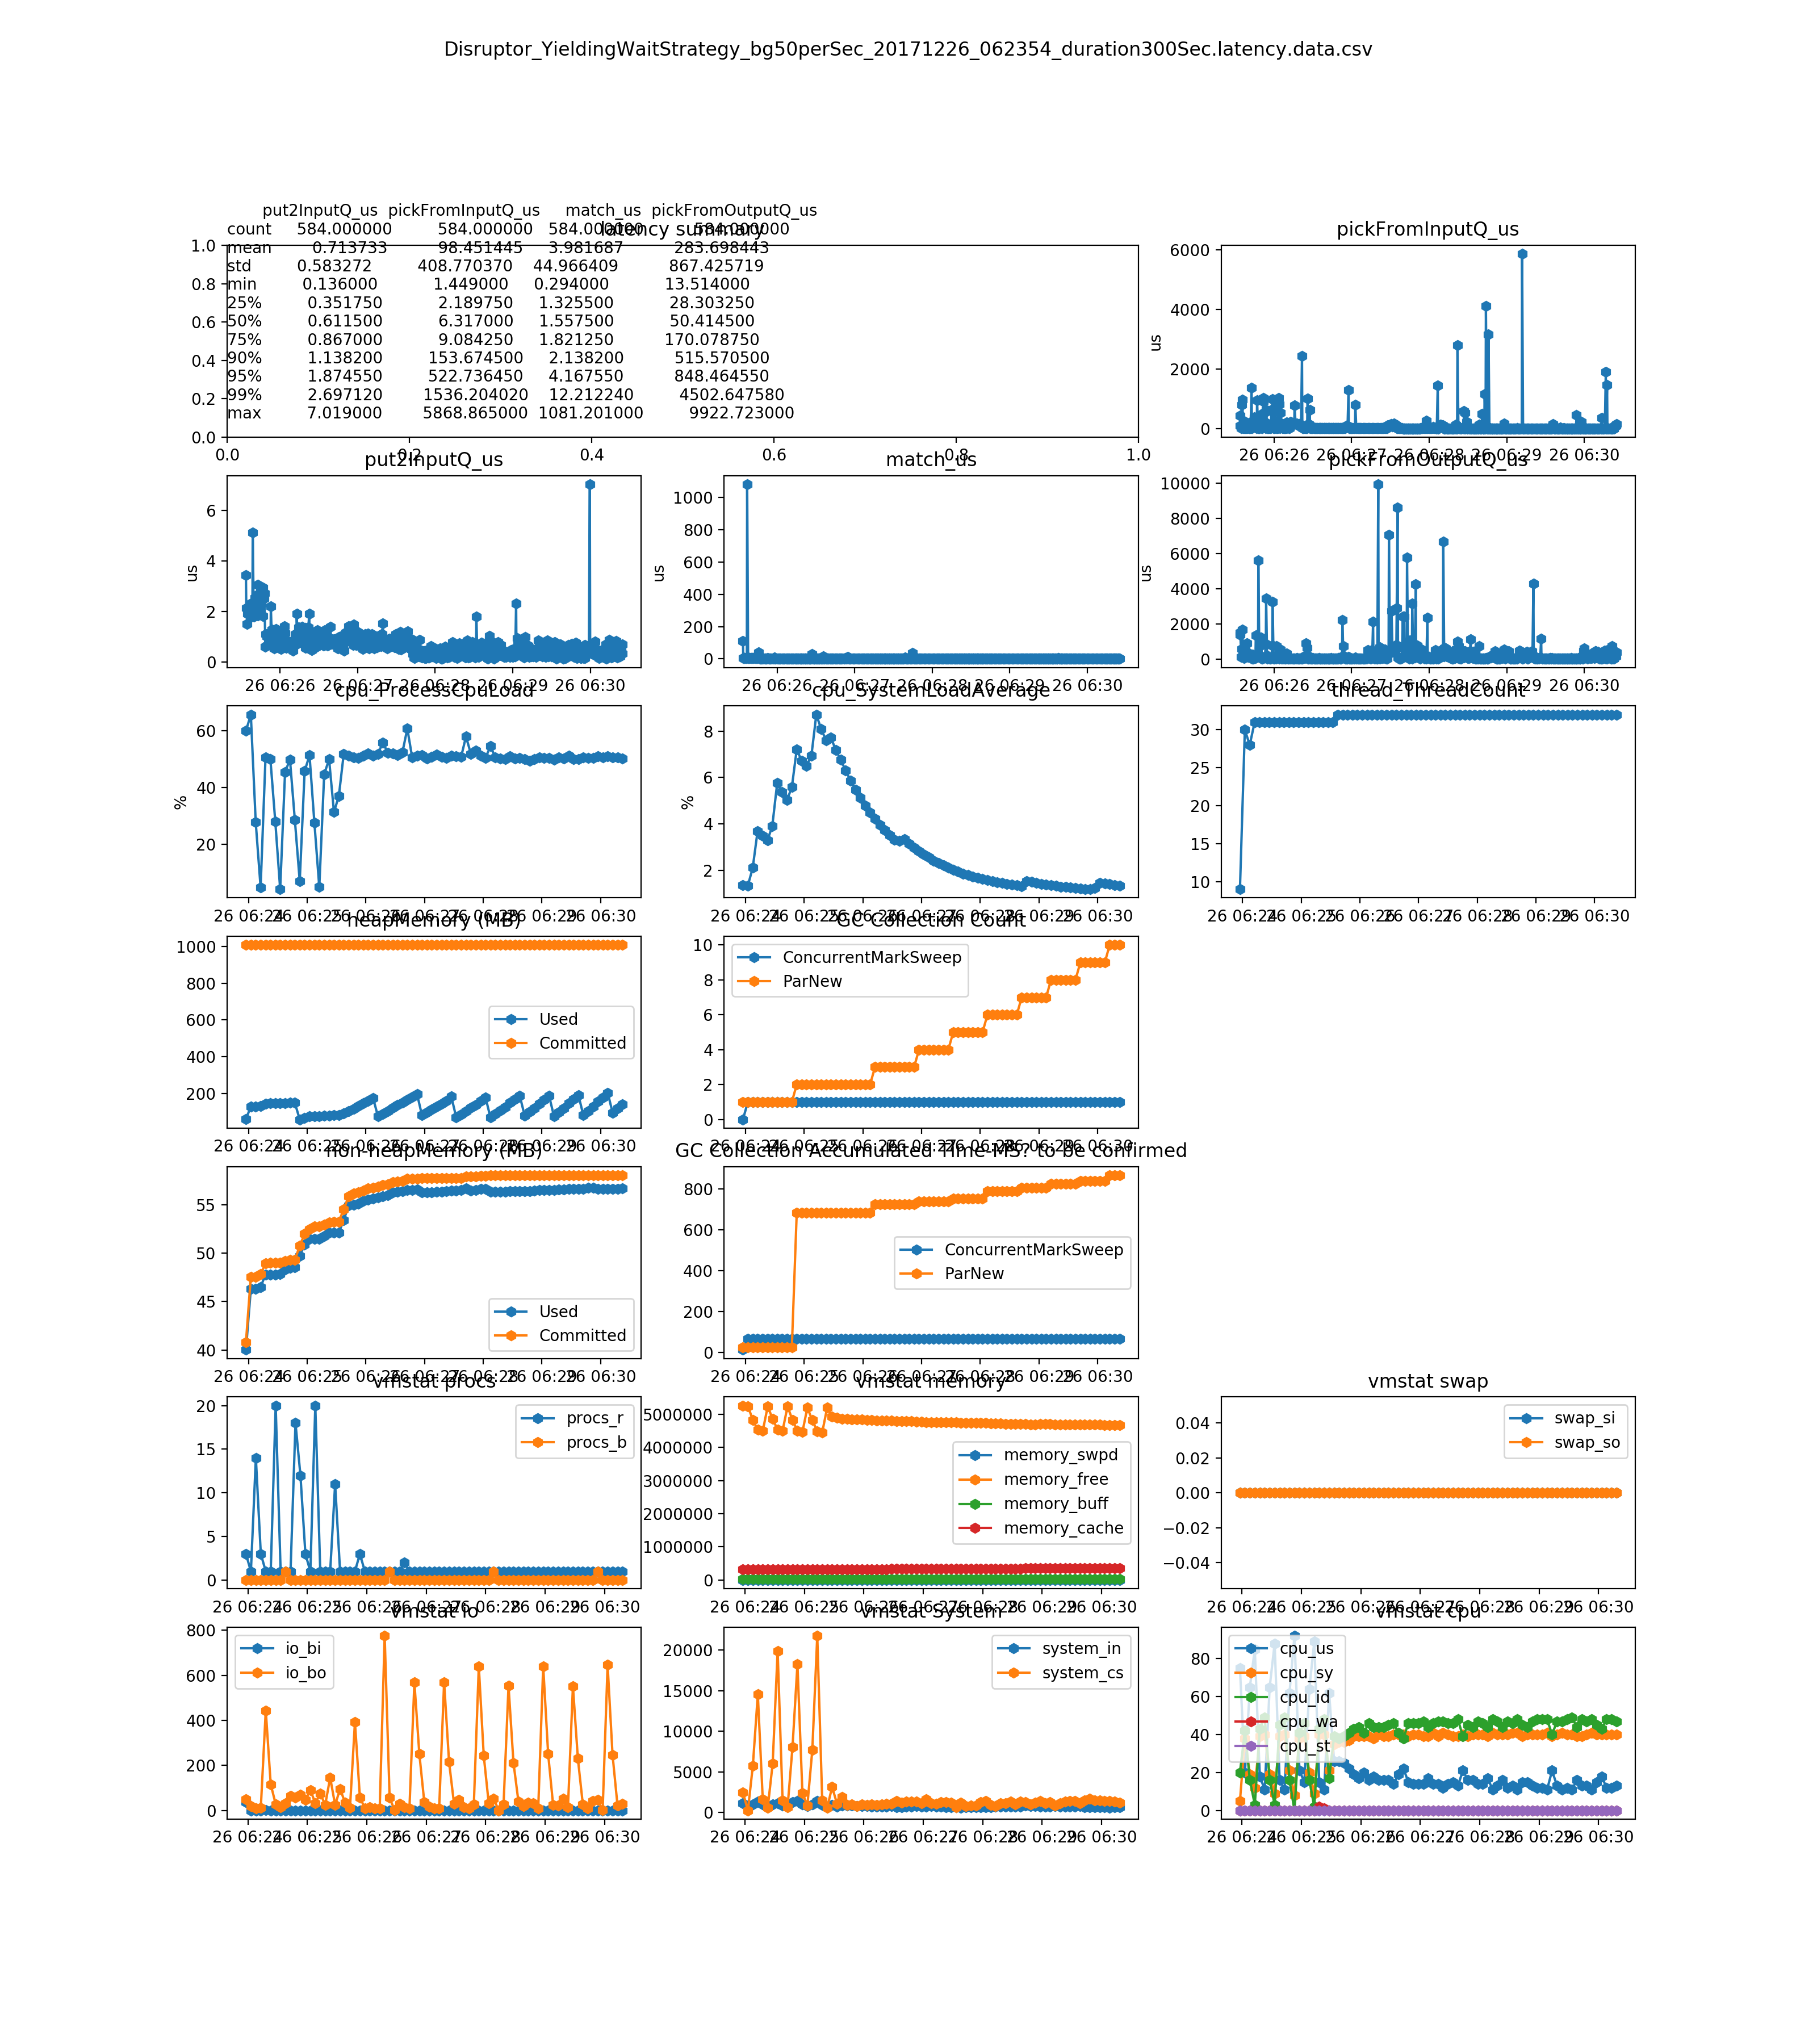
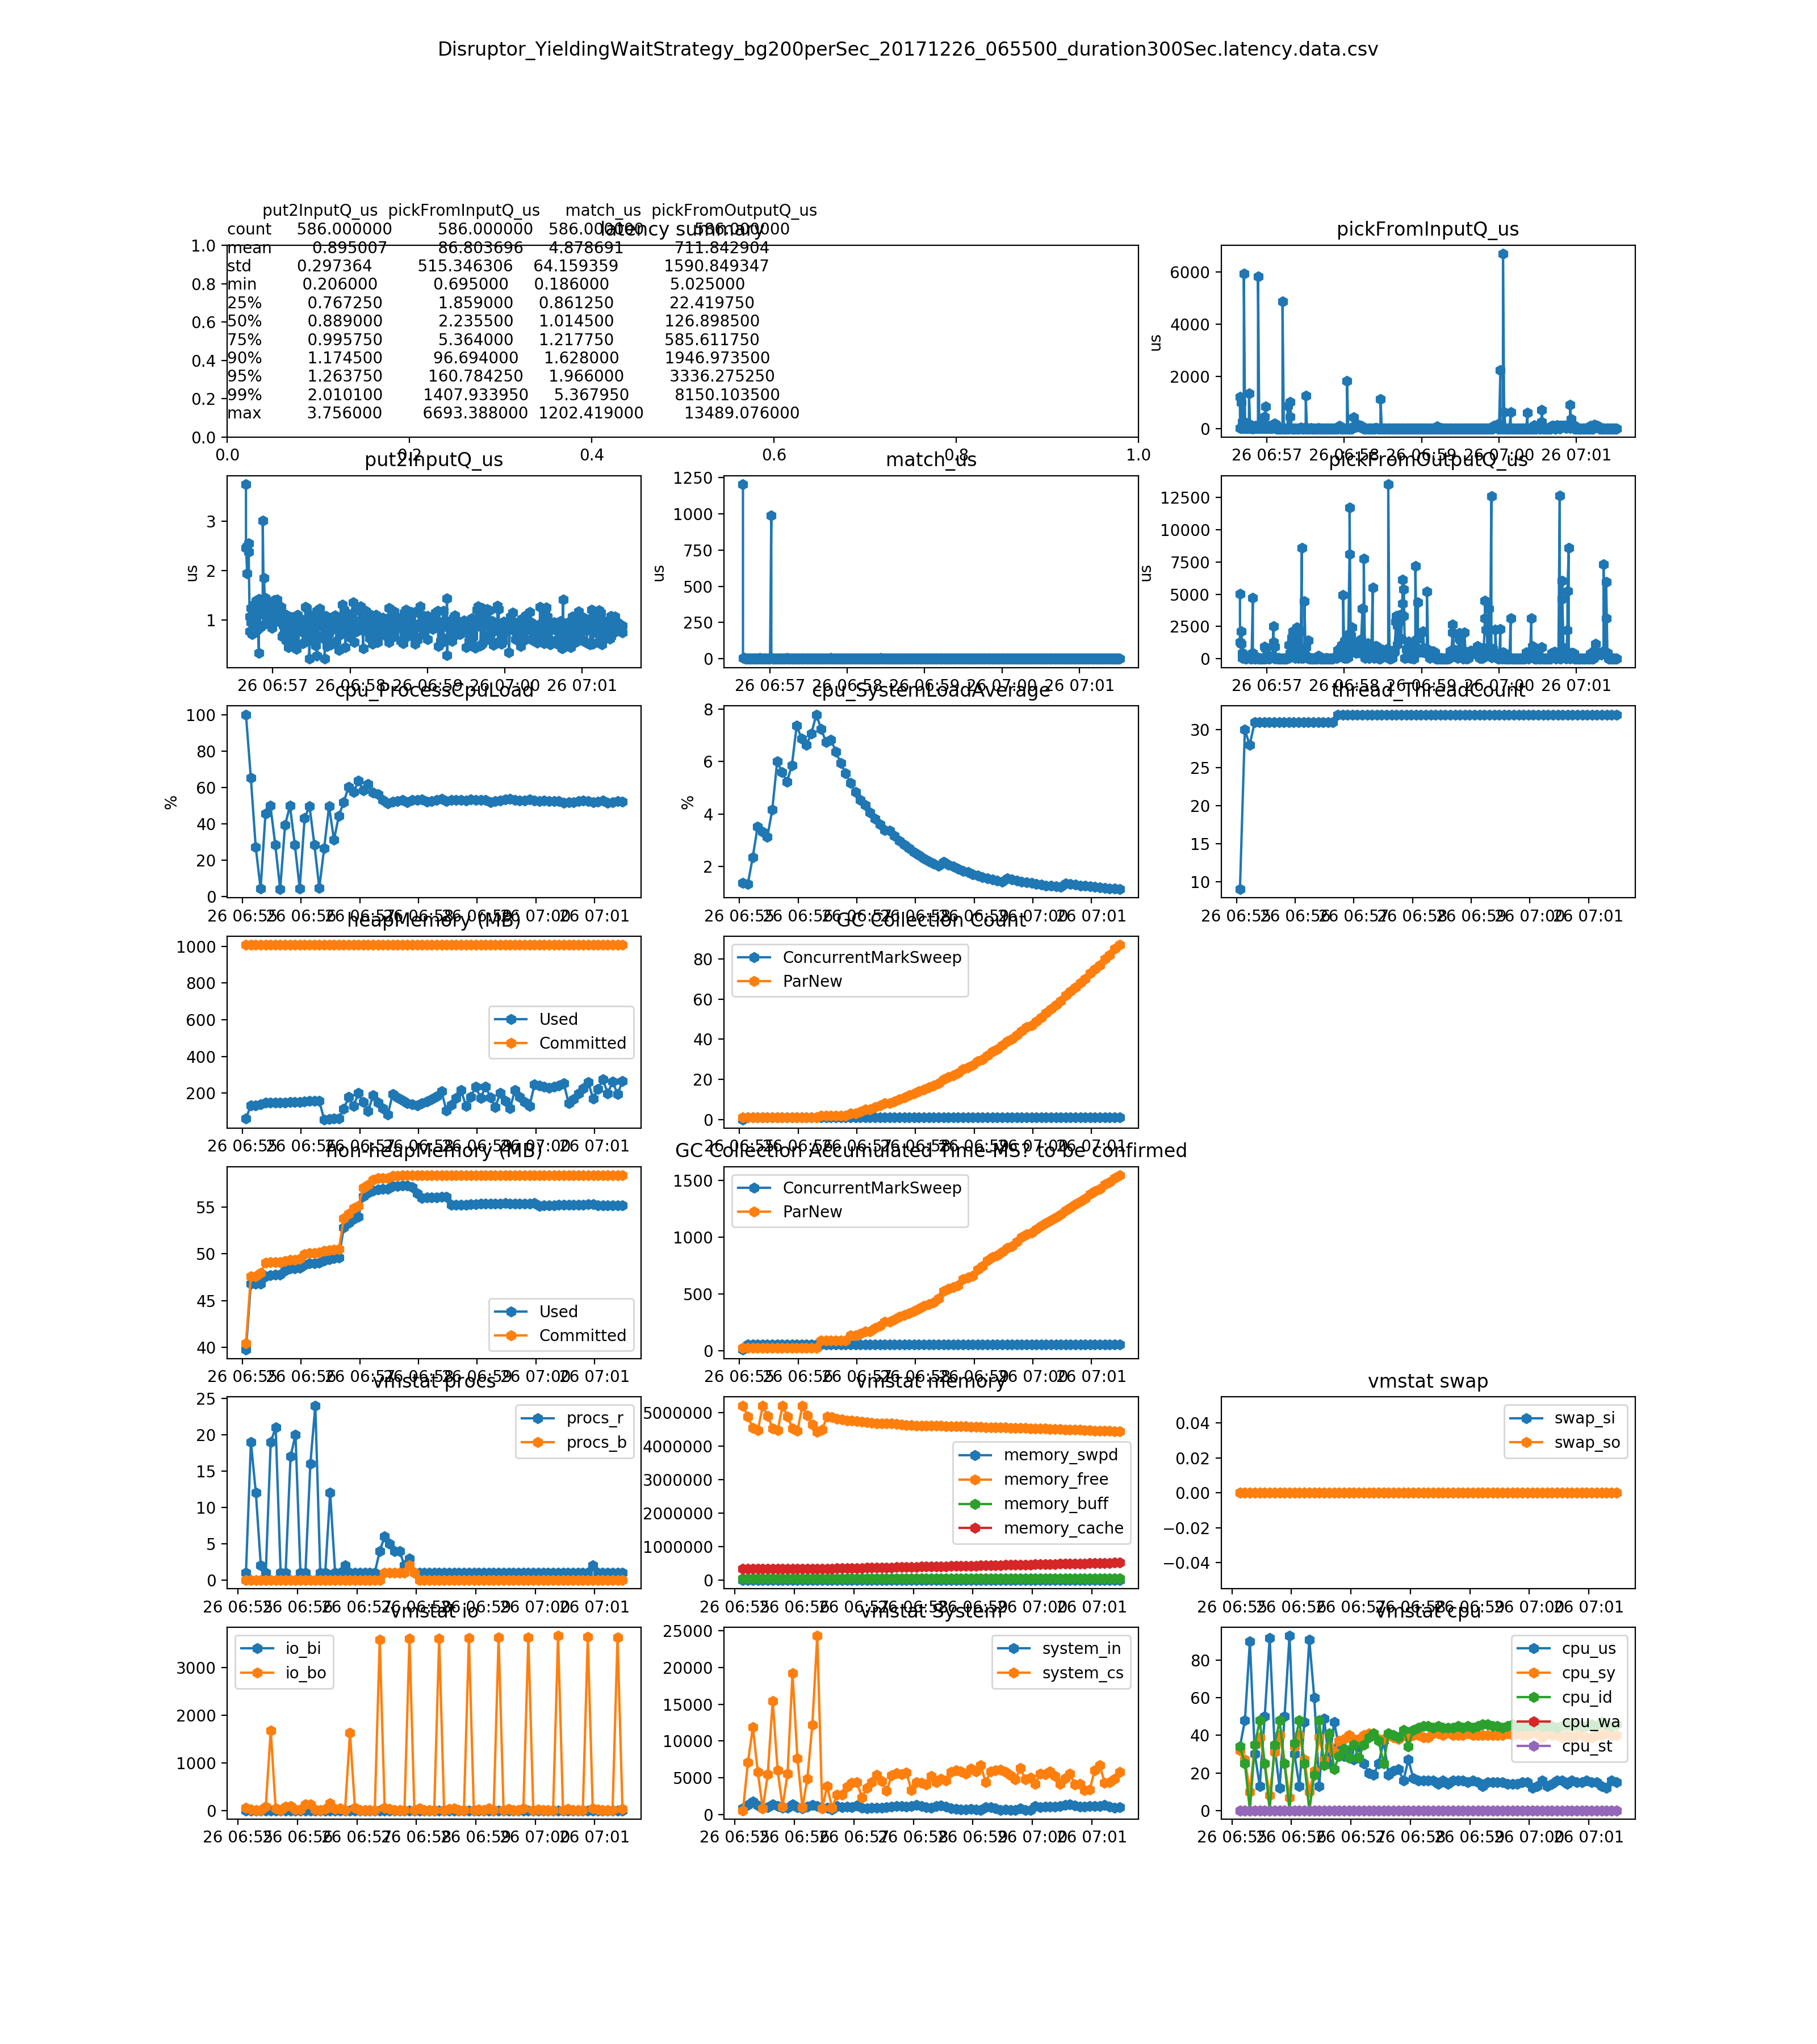
YieldingWaitStrategy - low latency systems It took more CPU - around 60~70 on my win 7 (it is higher than the BusySpinWaitStrategy - 50%). But performance is not as good as BusySpinWaitStrategy)
| type | put2InputQ_us | pickFromInputQ_us | match_us | pickFromOutputQ_us |
|---|---|---|---|---|
| count | 207.0 | 207.0 | 207.0 | 207.0 |
| mean | 0.6817 | 72.244 | 1.8214 | 241.23057487922708 |
| std | 0.951 | 277.021 | 0.5125 | 452.59852395855114 |
| min | 0.0 | 1.094 | 0.364 | 2.187 |
| 25% | 0.365 | 5.104 | 1.459 | 11.668 |
| 50% | 0.729 | 5.47 | 1.823 | 13.491 |
| 75% | 0.729 | 6.563 | 2.188 | 490.9755 |
| 90% | 0.73 | 91.085 | 2.188 | 661.0024000000001 |
| 95% | 0.9841 | 538.4867 | 2.552 | 757.9946 |
| 99% | 2.14426 | 1258.52312 | 2.917 | 1778.4871799999992 |
| max | 11.303 | 2984.139 | 4.376 | 3777.211 |
BTW: other enhancements
- web monitor(http://localhost:8080/test_summary.html) support view latency(tail 400) as graph).
- GC pause times are analyzed online, but not yet integrated the result to web monitor
Glad to have two day vacations, and weekend to tune this engine
- only record latency(nanoTime) for latency orders
- refactor to return Tuple, rather than as part of parameters in match method
- add time on picking order from input Q
- only calculate the latency on taker side(by record related timestamps in filled execution report), since maker side maybe sit in book long time.
- python scripts to calculate the statistics of latency
- GC output parsing java code
Got below result
- pick from Q(both input and output) took more time, and the matching process is fast(avg 5.3 us, 95% 12 us)
- cpu usage is very low, since LinkedBlockingQueue is used.(similar test result with ArrayBlockingQueue, which is expected, but not used because I don't want introduce logic to control the out-of-capacity for this phase).
- cannot identify obvious relationship between GC(and app thread stop) with the spike Q picking latency
| type | put2InputQ_us | pickFromInputQ_us | match_us | pickFromOutputQ_us |
|---|---|---|---|---|
| count | 478.0 | 478.0 | 478.0 | 478.0 |
| mean | 1.261725941422594 | 748.6533933054393 | 5.363443514644351 | 221.17526569037656 |
| std | 1.3463244342974796 | 1932.4899826558315 | 6.229908042497636 | 1024.58946151024 |
| min | 0.0 | 7.293 | 0.365 | 7.657 |
| 25% | 0.729 | 54.42100000000001 | 2.917 | 26.345 |
| 50% | 1.093 | 70.738 | 4.741 | 32.817 |
| 75% | 1.094 | 737.46525 | 5.47 | 63.9015 |
| 90% | 2.188 | 1559.7446 | 6.928000000000001 | 424.6493000000001 |
| 95% | 4.74 | 2685.687749999995 | 12.086749999999991 | 827.6025499999997 |
| 99% | 6.564 | 11369.258260000042 | 20.054229999999997 | 2907.322100000022 |
| max | 7.658 | 17678.031 | 117.411 | 17108.478 |
Test Data
{
	"start_time":"2017-12-16T13:21:32.485Z",
	"rate_per_second":"4.37",
	"un-purged_latency_data_count":10,
	"order_count":6166,
	"end_time":"2017-12-16T13:45:02.681Z",
	"duration_in_second":1410,
	"latency_data_count":479 (this is wrong, it includes header un-expectedly)
}
- matching engine will receive order request from restful api(by spring boot)
- jmeter is used to simulate banks, populate order book, and trigger latency data dump
- several columns . A order will flow like below recvEpochMS - the time that arrives the web server. put2ReqQ - time : arrive web server -> put it to the input request Q of matching engine pickANDmatch - time : pit to input Q -> match done addANDpickOutput - time : match done -> put to output Q -> pick up by consuming thread
- background order- 120 order/minutes - 40 banks( 20 sending bid, and 20 sending offer)
- latency order 2 order/minutes - 5 banks to send bid order - only calculate the latency on these orders
- order book is populated in advance as setup step. It will let both background order and latency order fill in single execution.
- split the pickANDmatch into 2 parts 1) put to input Q -> pick from input Q 2) match
- whether any relationship with minor GC(full GC)
- try it on linux (I have only linux VM , on windows 7 virtual box. What's the diff between linux on VM, and the linux on direct hardware)
- try diff sending rate
- evaluate whether reactor or DISCUPTOR should be used
- comparing with other libraries
- record CPU usage - see JVM trouble shooting summary on how to do that with linux command. I suspect the large latencies were caused by GC.
- is it true that 32bit jvm faster than 64bit one? try it.
- build a fat jar: gradle shadowJar
- start java -jar BaoyingOrderBookFat-2017-12-13_202535.636-all.jar
- run jmeter - OrderBook\src\test\resources\jmeter\OrderBook.jmx
- check test result ~\log\LatencyData_OverallStart_20171213_075645.7Z.csv, ~\log\LatencySummary_OverallStart_20171213_075645.7Z.json.txt
unit : macro seconds ( 1/1000,000). I will use better name in later test report
>>> df.describe()
        recvEpochMS    put2ReqQ   pickANDmatch  addANDpickOutput
count  2.640000e+02  264.000000     264.000000        264.000000
mean   1.513153e+12    1.708663    2857.073818        440.690269
std    4.577423e+05    1.438593   28920.917469       2525.597672
min    1.513152e+12    0.000000       8.752000          7.658000
25%    1.513152e+12    0.730000      51.053000         21.150750
50%    1.513153e+12    1.459000      94.265500         37.195500
75%    1.513153e+12    2.188000    1248.337750         90.071500
max    1.513153e+12   12.034000  467725.726000      30824.003000
Note - for pure matching performance - 170~200 nano second in avg. And each System.nanoTime() will take about 12 nano second in avg. My code get nano time many times. Not high priority but should be noted.
It took about 170~200 nano second in avg for each matching. baoying.orderbook.MatchingEnginePerfTest
int loopCount = 1000_000;
List<MatchingEnginOutputMessageFlag> execReportsAsResult = new ArrayList<>();
List<OrderBookDelta> orderbookDeltasAsResult = new ArrayList<>();
long start = System.nanoTime();
for(int i=0; i<loopCount; i++ ){
	_exchange.match(new ExecutingOrder(b_160_1mio,System.nanoTime()),offerBook,bidBook,execReportsAsResult, orderbookDeltasAsResult);
}
long end = System.nanoTime();
System.out.println("avg nano second per matching:" + (end - start)/loopCount);