Use this script to automate HTTPS SSL Certificate monitoring. It curl's remote server on 443 port and then checks remote SSL Certificate expiration date. You can use it with Zabbix, Nagios/Icinga or other.
Latest release: Download
The script takes on input a file with a list of hostnames:
Usage: check_certificates.sh [-h] [-v] [-s] [-l] [-n] [-A n] [-G] -i input_filename -d domain_name -b backend_name

   -b, --backend-name       Domain list backend name (pastebin, gcs, etc.)
   -i, --input-filename     Path to the list of domains to check
   -d, --domain             Domain name to check
   -s, --sensor-mode        Exit with non-zero if there was something to print out
   -l, --only-alerting      Show only alerting domains (expiring soon and erroneous)
   -n, --only-names         Show only domain names instead of the full table
   -A, --alert-limit        Set threshold of upcoming expiration alert to n days
   -G, --generate-metrics   Generates a Prometheus metrics file to be served by nginx
   -v, --verbose            Enable debug output
-h, --help Show helpDomain list backends allow you to manage configuration in a centralised manner.
You can use a PasteBin paste as a source of domain names to be checked. We encorage you to register on PasteBin and create all your pastes related to check_certificates as Private or at least as Unlisted.
- Create a paste with a valid structure (example)
- Obtain devkey and userkey (documentation)
- Fill out variables in
.configfile
{
  "check_ssl": [
    "example.com",
    "google.com",
    "mail.com",
    "imaginary-domain-9000.com"
  ]
}PASTEBIN_USERKEY=youruserkey
PASTEBIN_DEVKEY=yourdevkey
PASTEBIN_PASTEID=pasteidExample of an input file contents:
example.com
google.com
mail.com
imaginary-domain-9000.com
Output fields:
Hostname Valid Not Before Valid Not After Expires in N Days
Full output (default) example:
imaginary-domain-9000.com  error                error                -1
google.com                 2020-06-30 20:43:12  2020-09-22 20:43:12  66
example.com                2018-11-28 00:00:00  2020-12-02 12:00:00  136
mail.com                   2018-01-15 00:00:00  2021-01-14 12:00:00  179
Domain names only output (with parameters -n -l -A 90) example:
imaginary-domain-9000.com
google.com
The script can generate a file with Prometheus metrics that is to be served by an external web server (eg. nginx or httpd).
Use -G or --generate-metrics parameters to enable this feature.
PROMETHEUS_EXPORT_FILENAME="/path/to/htdocs/metrics"# HELP check_certificates_expiration Days until HTTPs SSL certificate expires (skipped on error)
# TYPE check_certificates_expiration counter
check_certificates_expiration{domain="example.com"} 20
check_certificates_expiration{domain="example.de"} 193
check_certificates_expiration{domain="imaginary-domain-9000.com"} -1
server {

    listen 127.0.0.1:80;
    listen [::1]:80;

    listen 127.0.0.1:443 ssl;
    listen [::1]:443 ssl;

    ssl_certificate /etc/pki/tls/certs/localhost.crt;
    ssl_certificate_key /etc/pki/tls/private/localhost.key;

    server_name localhost;

    access_log  /var/log/nginx/localhost-access.log  main;
    error_log  /var/log/nginx/localhost-error.log;

    location /check_certificates/metrics {
        alias /opt/check_certificates/metrics;
        allow 127.0.0.1/32;
        deny  all;
    }

}global:
scrape_interval: 30s
scrape_configs:
- job_name: 'check_certificates'
scrape_interval: 1h
scheme: https
metrics_path: "check_certificates/metrics"
params:
format: ['prometheus']
static_configs:
- targets: ['localhost']
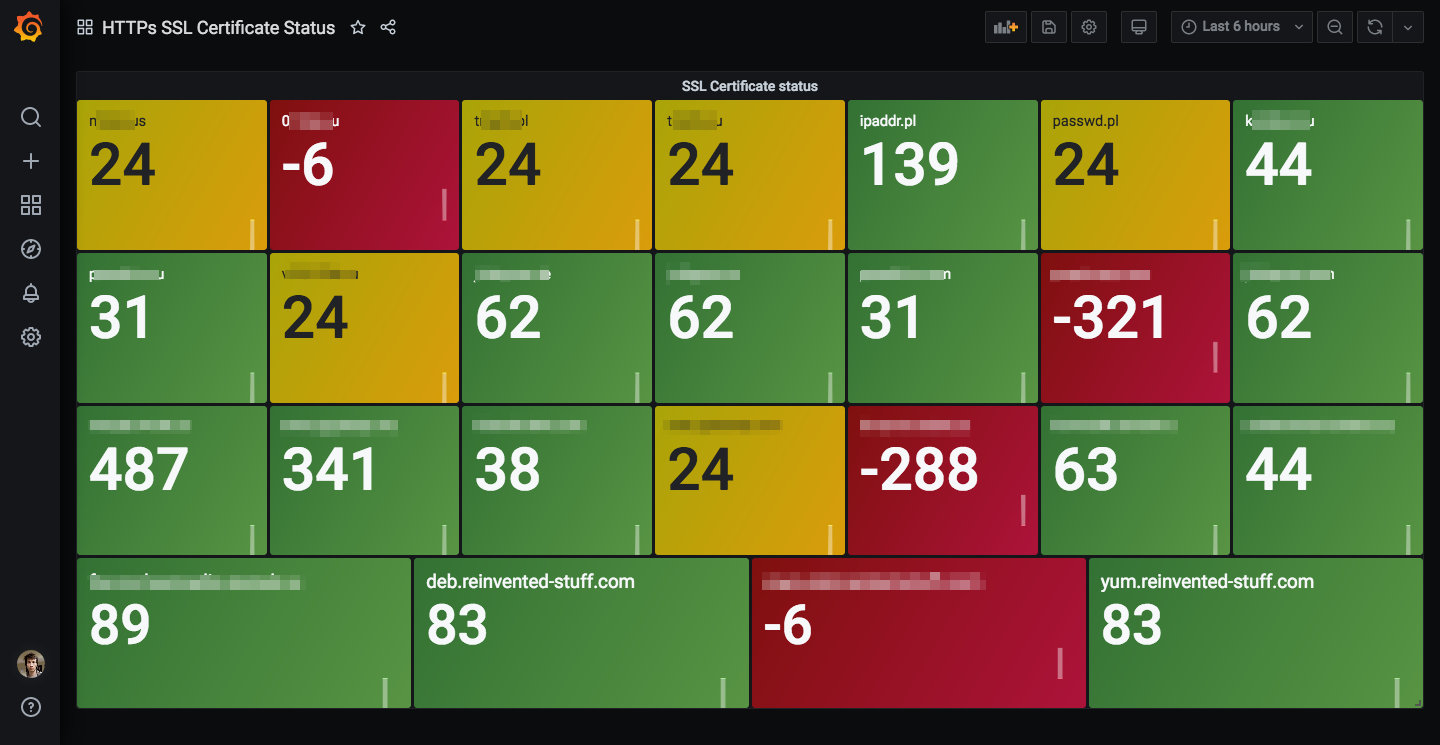
Dashboard can be imported by id 15298.
More informatin: https://grafana.com/grafana/dashboards/15298
The following example of a crontab will provide you with email notfications in 14 days prior to SSL certificate expiration (or in case of other errors). Before that you'll receive no emails. Keep in mind that you'll need to have your Cron and MTA configured properly.
/etc/cron.d/check_certificates:
HOME=/opt/check_certificates
MAILTO="john.doe@example.com"

30 11 * * * nobody bash ./check_certificates.sh -l -A 14 -i corp_domains.txt
35 11 * * * nobody bash ./check_certificates.sh -l -A 14 -d "example.com"You could use --sensor-mode along with other parameters to make the script exit with non-zero code if your remote host has an expiring certificate.
For Zabbix you can create a simple check to monitor your remote SSL certificate. For Nagios/Icinga you can configure a separate service check.
./check_certificates.sh --sensor-mode --only-names --only-alerting --alert-limit 14 --domain example.comThe script executed as displayed above will return 0 in case if example.com has SSL certificate valid for 15 or more days. In case of error (DNS, firewall, etc.) or if certificate will expire in less then 14 days, the script will return 1.
Currently tested on the following platforms:
- CentOS 7, bash 4.2.46, openssl 1.0.2k
- CentOS 8, bash 4.4.19, openssl 1.1.1c
- Mac OS 10.13.6, bash 3.2.57, openssl 1.1.1d