
![]()
The goal of {mgx2r} is to ease the analysis of mesh and cell graph files created with the MorphoGraphX software. MorphoGraphX is a software for 3D visualisation and segmentation of microscopy images.
To cite {mgx2r}, call the R built-in command citation("mgx2r").
Marion Louveaux, & Sébastien Rochette. (2018, October 18). mgx2r: a R package for importing meshes and cell graph files from MorphoGraphX software (Version v0.0.2). Zenodo. http://doi.org/10.5281/zenodo.1466047
You can install the released version of {mgx2r} from GitHub
# install.packages("devtools")
devtools::install_github("marionlouveaux/mgx2r")
# With vignette
devtools::install_github("marionlouveaux/mgx2r",
build_vignettes = TRUE)See full documentation created with {pkgdown} at https://marionlouveaux.github.io/mgx2r/
Two vignettes are available in the package. You can have access to the vignettes if you installed the package using build_vignettes = TRUE.
vignette("vignette_basics", package = "mgx2r")vignette("vignette_time_series", package = "mgx2r")
To open the Rmd files used to build vignettes:
file.edit(system.file(file.path("doc", "vignette_basics.Rmd"), package = "mgx2r"))
file.edit(system.file(file.path("doc", "vignette_time_series.Rmd"), package = "mgx2r"))Some .ply demonstration data coming from my PhD thesis are attached to this package. This dataset is a timelapse recording of the development of a shoot apical meristem of the plant expressing a membrane marker. I took one 3D stack every 12h and have 5 timepoints in total. For more information regarding the generation of this dataset, see help.search("mgx2r-package").
### Full datataset
filePly <- system.file("extdata", "full/mesh/mesh_meristem_full_T0.ply", package = "mgx2r")

fileCellGraph <- system.file("extdata",  "full/cellGraph/cellGraph_meristem_full_T0.ply", package = "mgx2r")
The mesh data are read and converted as mesh 3D using the read_mgxPly function. They contain informatons relative to the geometry of the plant tissue.
library(mgx2r)
mgx_palette <- c("#800000", "#FF0000", "#808000", "#FFFF00",
                "#008000", "#00FF00", "#008080", "#00FFFF",
                "#000080", "#0000FF", "#800080", "#FF00FF")

myMesh <- read_mgxPly(
  file = filePly, ShowSpecimen = FALSE, addNormals = TRUE,
  MatCol = 1, header_max = 30, my_colors = mgx_palette)
#> [1] "Object has 7763 faces and 4158 vertices."
The cell graph data are read and converted as mesh 3D using the read_mgxCellGraph function. They contain data relative to the area of the cells and local curvature of the tissue.
myCellGraph <- read_mgxCellGraph(fileCellGraph = fileCellGraph, header_max = 30)The mesh and cell graph data can be visualised using the package {cellviz3d}:
library(cellviz3d)
meshCellcenter <- myCellGraph$vertices[,c("label","x", "y", "z")]

p1 <- plotlyMesh(meshExample = myMesh,
                 meshColors = myMesh$allColors$Col_label,
                 meshCellcenter = meshCellcenter) %>%
  plotly::layout(scene = list(aspectmode = "data"))

p1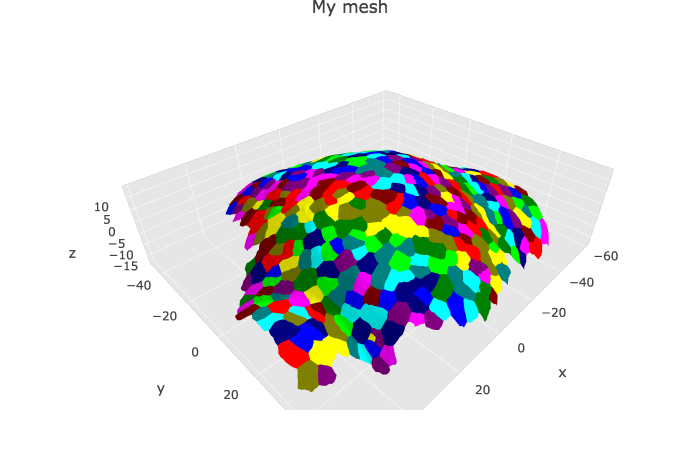
Many thanks to Dr. Soeren Strauss and Dr. Richard Smith from the Max Planck Institute for Breeding Research for their help and advices on the {mgx2r} package.
Please note that this project is released with a Contributor Code of Conduct. By participating in this project you agree to abide by its terms.