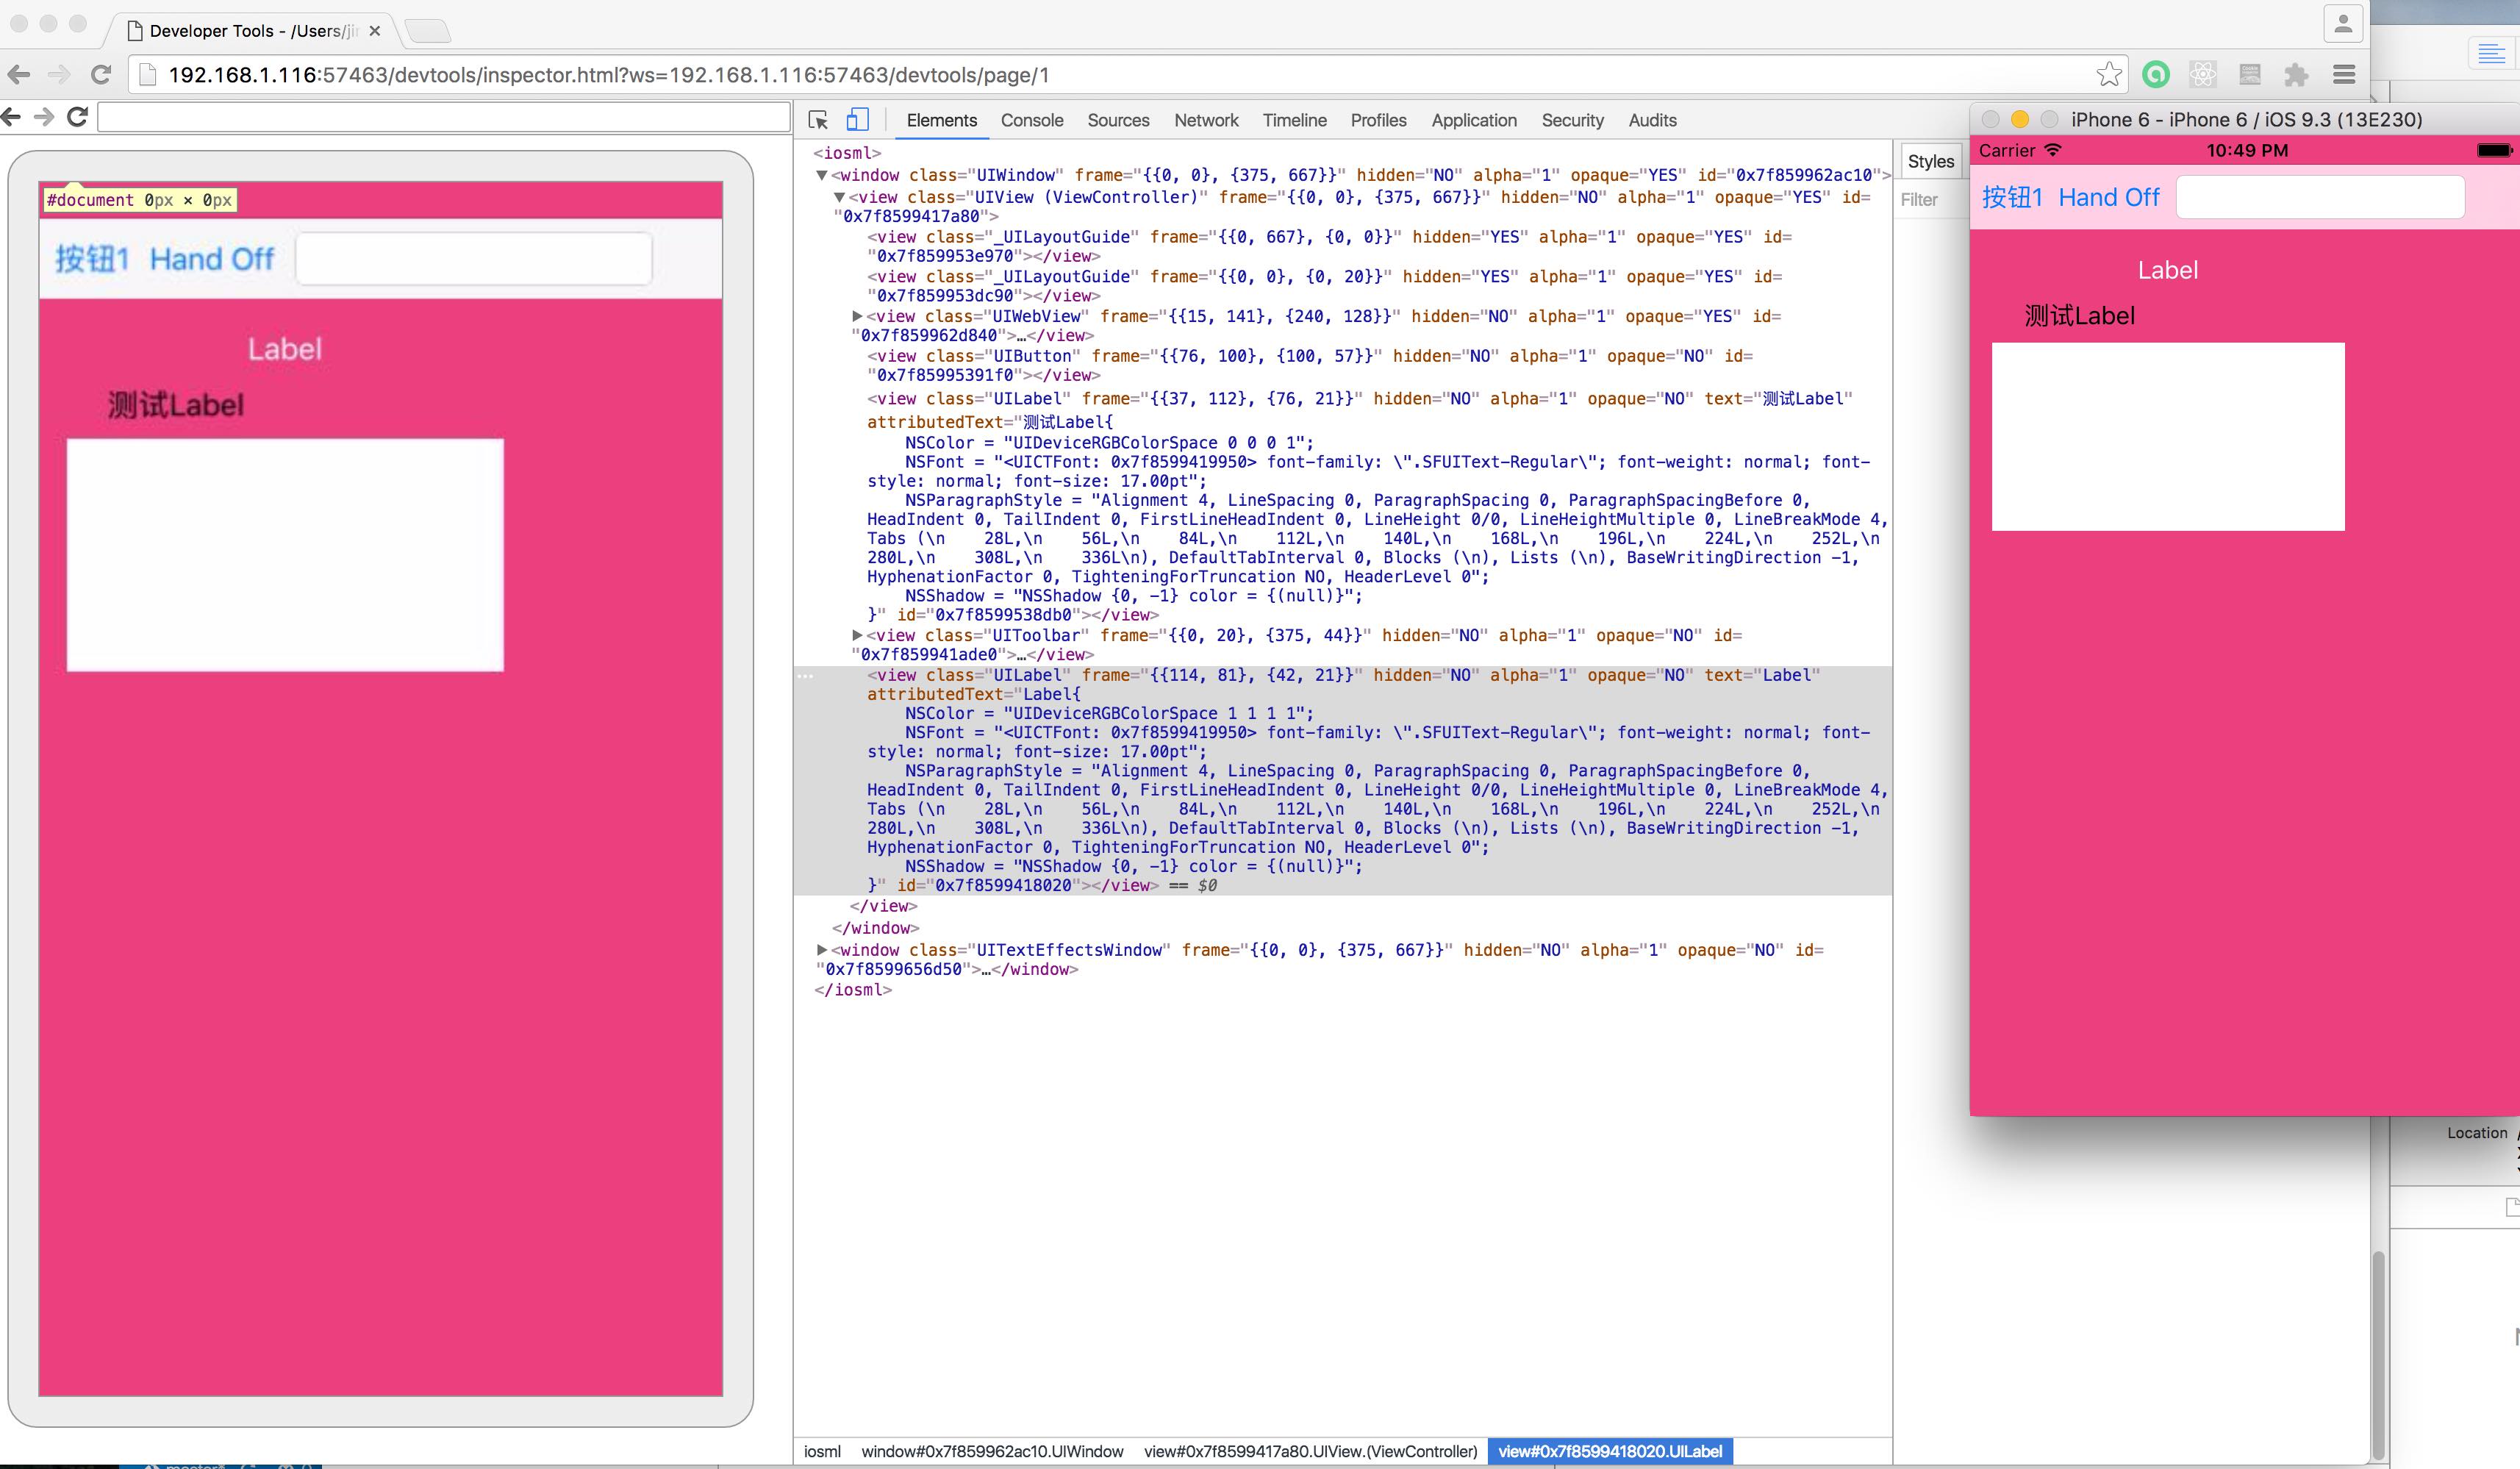
PonyDebugger is a remote debugging toolset. It is a client library and gateway server combination that uses Chrome Developer Tools on your browser to debug your application's network traffic and managed object contexts.
To use PonyDebugger, you must implement the client in your application and connect it to the gateway server. There is currently an iOS client and the gateway server.
PonyDebugger is licensed under the Apache Licence, Version 2.0 (http://www.apache.org/licenses/LICENSE-2.0.html).
This is still a work in progress by huang, shaojun (http://huang.sh/).
Adopted for latest Chrome Debugger Protocol Version tot(tip-of-tree). You can view the latest protocol https://chromedevtools.github.io/debugger-protocol-viewer/tot/
Features added
- Screencast for iOS.
- Local Storage for viewing and editing NSUserDefaults (only support editing string and number values)
- WebSQL for viewing all sqlite3 database in your app
Notes:
- Google no longer distributes chrome devtools via this link (http://storage.googleapis.com/chromium-browser-continuous/Mac/%s/devtools_frontend.zip). As a result, you cannot use ponyd's built-in downloader to download devtools.
- Instead, you should get chrome devtools here: https://chromium.googlesource.com/chromium/src/third_party/WebKit/Source/devtools
- This version is incompatible with devtools downloaded from links like http://storage.googleapis.com/chromium-browser-continuous/Mac/%s/devtools_frontend.zip
- It will not work with devtools downloaded by ponyd.
- Support
NSURLSessionrequests for the Network Debugger. (@viteinfinite) - New test application that removes the AFNetworking dependency. (@viteinfinite)
- Remove custom base64 implementation with Apple's built-in implementation. (@kyleve)
- Add PodSpec for pulling the git repository directly. (@wlue)
- Fix only building active arch in debug. (@kyleve)
- Fix view hierarchy debugging with complex key paths. (@ryanolsonk)
- Fix crash in swizzled exchangeSubviewAtIndex:withSubviewAtIndex: (@ryanolsonk)
- Fix for crash when having a library that looks like a NSURLConnectionDelegate (@peterwilli)
- Remote Logging and Introspection (@wlue)
- Request response pretty printing in Network Debugger (@davidapgar)
- Minor bug fixes and improvements. (@jerryhjones, @conradev, @ryanolsonk)
- Bonjour support (@jeanregisser)
- Memory leak fix (@rwickliffe)
PonyDebugger sends your application's network traffic through ponyd, PonyDebugger's proxy server. You use Inspector's Network tools to debug network traffic like how you would debug network traffic on a website in Google Chrome.
PonyDebugger forwards network traffic, and does not sniff network traffic. This means that traffic sent over a secure protocol (https) is debuggable.
Currently, the iOS client automatically proxies data that is sent via
NSURLConnection and NSURLSession methods. This means that it will
automatically work with AFNetworking, and other libraries that use
NSURLConnection or NSURLSession for network requests.
The Core Data browsing feature allows you to register your application's
NSManagedObjectContexts and browse all of its entities and managed objects.
You browse data from the IndexedDB section in the Resource tab in Chrome
Developer Tools.
These are read-only stores at the moment. There are plans to implement data mutation in a future release.
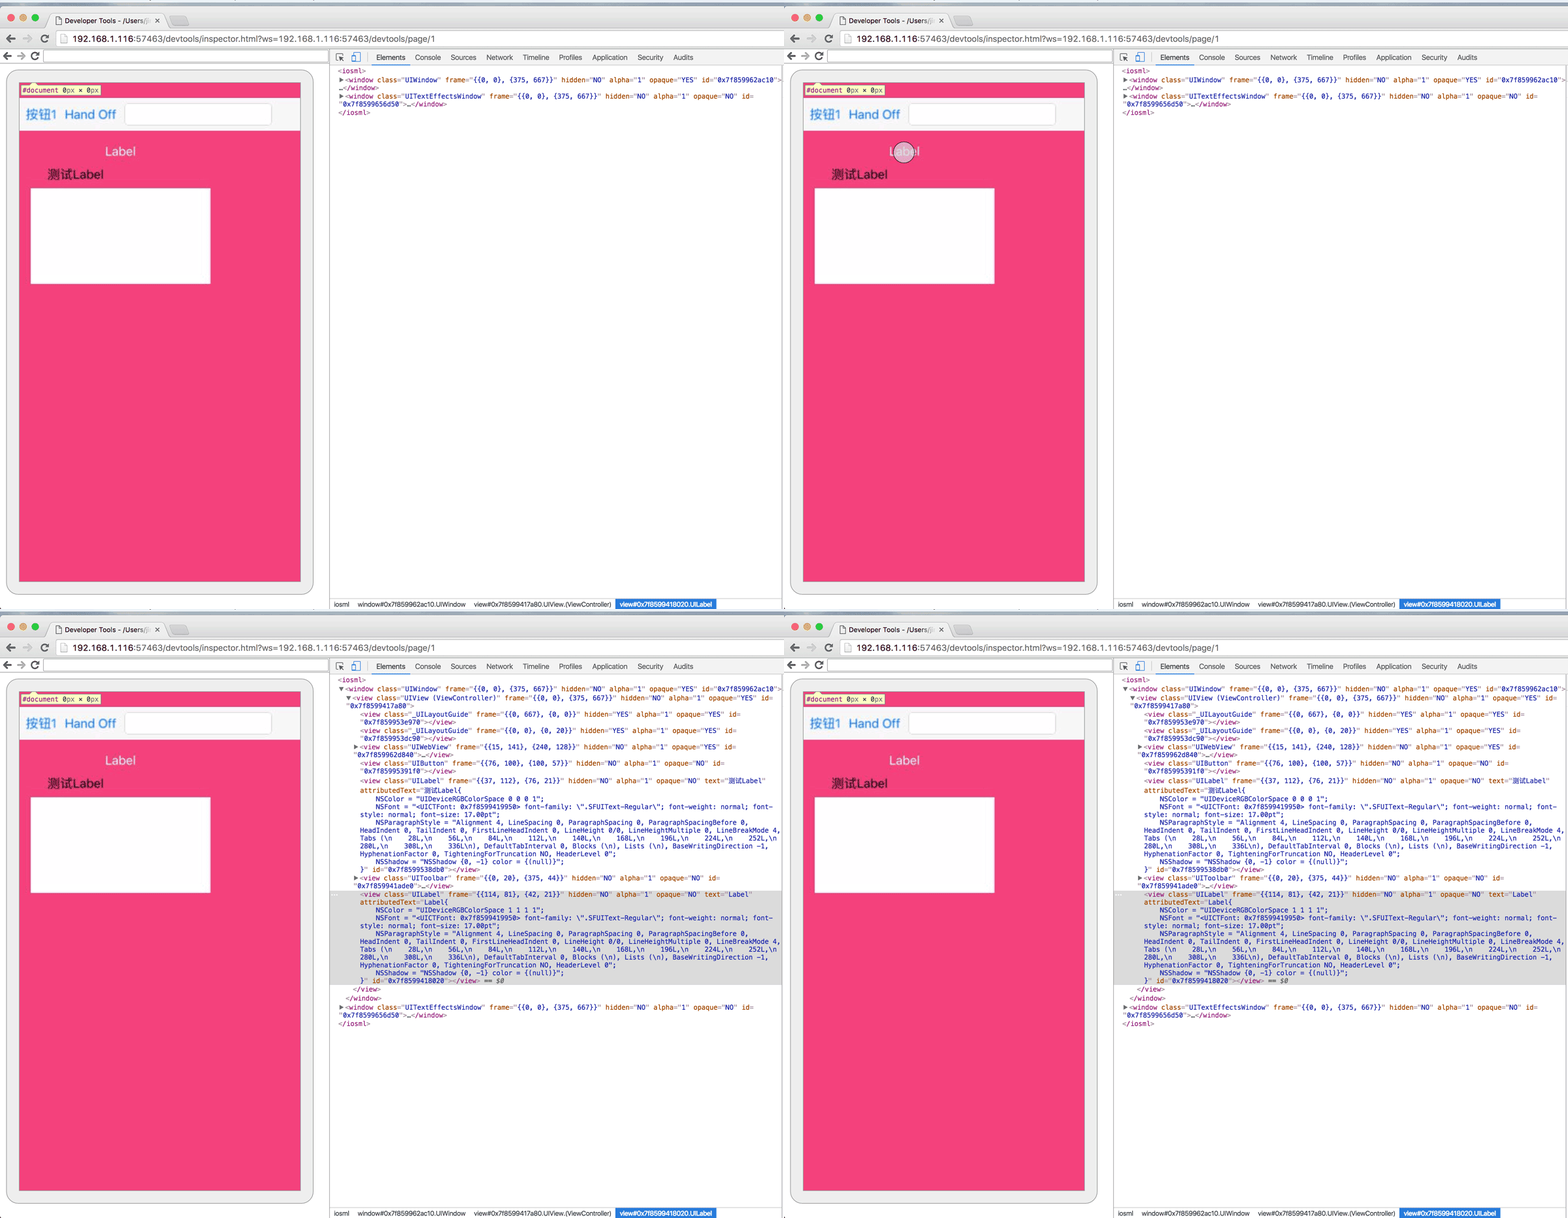
PonyDebugger displays your application's view hierarchy in the Elements tab of the Chrome Developer Tools. As you move through the XML tree, the corresponding views are highlighted in your app. You can edit the displayed attributes (i.e. frame, alpha, ...) straight from the Elements tab, and you can change which attributes to display by giving PonyDebugger an array of UIView key paths. Deleting a node in the elements panel will remove that node from the view hierarchy. Finally, when a view is highlighted, you can move it or resize it from the app using pan and pinch gestures.
An "inspect" mode can be entered by clicking on the magnifying glass in the lower left corner of the Developer Tools window. In this mode, tapping on a view in the iOS app will select the corresponding node in the elements panel. You can also hold and drag your finger around to see the different views highlighted. When you lift your finger, the highlighted view will be selected in the elements panel.
Currently only a subset of the actions possible from the elements panel have been implemented. There is significant room for continued work and improvement, but the current functionality should prove useful nonetheless.
PonyDebugger lets you remotely log text and object dumps via the PDLog and
PDLogObjects function. This lets you reduce the amount of content being
logged in NSLog, while also allowing you to dynamically introspect objects.
Introspected objects can be expanded recursively by property. This means that you don't have to breakpoint and log in GDB or LLDB to introspect an object.
Prerequisite: Xcode's Command Line Tools must be installed from the "Downloads" preference pane.
curl -s https://cloud.github.com/downloads/square/PonyDebugger/bootstrap-ponyd.py | \
  python - --ponyd-symlink=/usr/local/bin/ponyd ~/Library/PonyDebugger
This will install ponyd script to ~/Library/PonyDebugger/bin/ponyd and
attempt to symlink /usr/local/bin/ponyd to it. It will also download the
latest chrome dev tools source.
Then start the PonyDebugger gateway server
ponyd serve --listen-interface=127.0.0.1In your browser, navigate to http://localhost:9000. You should see the
PonyGateway lobby. Now you need to integrate the client to your application.
For more detailed instructions, check out the gateway server README_ponyd.
The PonyDebugger iOS client lets you to debug your application's network requests and track your managed object contexts.
- Requires iOS 5.0 or above
- Uses ARC (Automatic Reference Counting).
- Uses SocketRocket as a WebSocket client.
CocoaPods automates 3rd party dependencies in Objective-C.
Install the ruby gem.
$ sudo gem install cocoapods
$ pod setup
Depending on your Ruby installation, you may not have to run as sudo to install the cocoapods gem.
Create a Podfile. You must be running on iOS 5 or above.
platform :ios, '5.0'
pod 'PonyDebugger', '~> 0.4.3'
If you would like to use the latest version of PonyDebugger, point to the Github repository directly.
pod 'PonyDebugger', :git => 'https://github.com/square/PonyDebugger.git'
Install dependencies.
$ pod install
When using CocoaPods, you must open the .xcworkspace file instead of the
project file when building your project.
- Extract a tarball or zipball of the repository into your project directory. If you prefer, you may also add the project as a submodule. The iOS client uses SocketRocket as a dependency, and it is included as a submodule.
cd /path/to/YourApplication
mkdir Frameworks
git submodule add git://github.com/square/PonyDebugger.git Frameworks/PonyDebugger
git submodule update --init --recursive
- Add
PonyDebugger/PonyDebugger.xcodeprojas a subproject.
- In your Project Settings, add the PonyDebugger target as a Target Dependency in the Build Phases tab.
- Link
libPonyDebugger.a,libSocketRocket.a, and the Framework dependencies to your project.
- PonyDebugger and SocketRocket take advantage of Objective C's ability to add
categories on an object, but this isn't enabled for static libraries by
default. To enable this, add the
-ObjCflag to the "Other Linker Flags" build setting.
Your .app must be linked against the following frameworks/dylibs in addition to
libPonyDebugger.a and libSocketRocket.a.
- libicucore.dylib
- CFNetwork.framework
- CoreData.framework
- Security.framework
- Foundation.framework
PonyDebugger's main entry points exist in the PDDebugger singleton.
PDDebugger *debugger = [PDDebugger defaultInstance];To connect automatically to the PonyGateway on your LAN (via Bonjour):
[debugger autoConnect];Or to open the connection to a specific host, for instance
ws://localhost:9000/device:
[debugger connectToURL:[NSURL URLWithString:@"ws://localhost:9000/device"]];To manually close the connection:
[debugger disconnect];To enable network debugging:
[debugger enableNetworkTrafficDebugging];PonyDebugger inspects network data by injecting logic into
NSURLConnectionDelegate classes. If you want PonyDebugger to automatically
find these classes for you:
[debugger forwardAllNetworkTraffic];This will swizzle methods from private APIs, so you should ensure that this only gets invoked in debug builds. To manually specify delegate classes:
[debugger forwardNetworkTrafficFromDelegateClass:[MyClass class]];These methods should be invoked before the connection is opened.
PonyDebugger also allows you to browse your application's managed objects. First, enable Core Data debugging:
[debugger enableCoreDataDebugging];To register a managed object context:
[debugger addManagedObjectContext:self.managedObjectContext withName:@"My MOC"];To enable view hierarchy debugging:
[debugger enableViewHierarchyDebugging];PonyDebugger will inject logic into UIView add/remove methods to monitor
changes in the view hierarchy.
You can also set the attributes you want to see in the elements panel by passing
an array of UIView key path strings
[debugger setDisplayedViewAttributeKeyPaths:@[@"frame", @"hidden", @"alpha", @"opaque"]];PonyDebugger uses KVO to monitor changes in the attributes of all views in the hierarchy, so the information in the elements panel stays fresh.
To enable remote logging:
[debugger enableRemoteLogging];Example usage:
PDLog("Hello world!");               // This logs a simple string to the console output.
PDLogObjects(self);                  // This logs an introspectable version of "self" to the console.
PDLogObjects("My object:", object);  // Combination of text and introspectable object.
The repository contains a test application to demonstrate PonyDebugger's capabilities and usage.
-
CoreData.frameworkmust be linked, even if you do not use the Core Data browsing functionality. -
iOS 5.1 and below: In certain cases,
-[NSURLConnectionDataDelegate connection:willSendRequest:redirectResponse:]will never get called. PonyDebugger requires this call to know when the request was sent, and will warn you with a workaround that the timestamp is inaccurate.To fix the timestamp, make sure that
Accept-EncodingHTTP header in yourNSURLRequestis not set (by default, iOS will set it togzip, deflate, which is usually adequate.AFNetworking users: if you subclass
AFHTTPClient, call[self setDefaultHeader:@"Accept-Encoding" value:nil];.
We’re glad you’re interested in PonyDebugger, and we’d love to see where you take it. Please read our contributing guidelines prior to submitting a Pull Request.
Some useful links:


