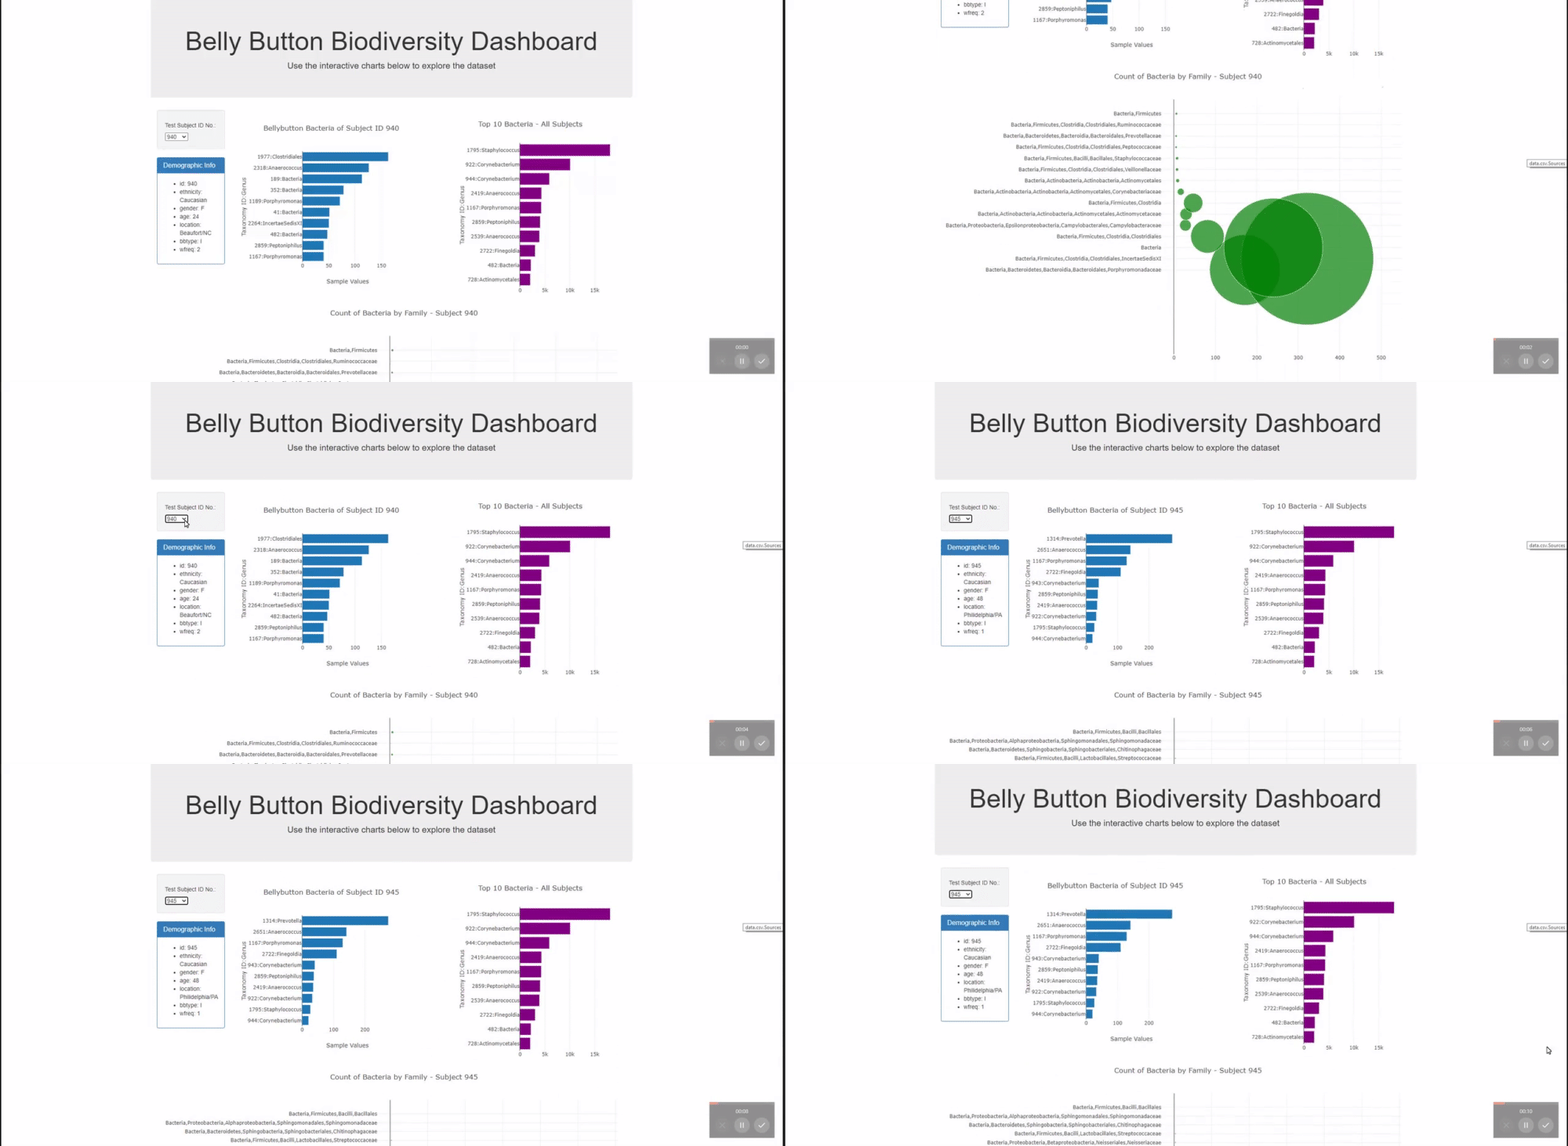
This demo features an interactive dashboard created in order to explore the Belly Button Biodiversity dataset, which catalogs the microbes that colonize human navels. The dataset reveals that a small handful of microbial species (also called operational taxonomic units, or OTUs, in the study) were present in more than 70% of people, while the rest were relatively rare.
D3.js, html, css, Plotly
Hulcr, J. et al.(2012) A Jungle in There: Bacteria in Belly Buttons are Highly Diverse, but Predictable. Retrieved from: http://robdunnlab.com/projects/belly-button-biodiversity/results-and-data/
A web dashboard was created to show details of a study of biodiversity of bacteria found in the navels of several test subjects. A drop down menu allows the user to select any subject in the study. Once selected the metadata for the test selected test subject is displayed and the first and last charts are updated to show details about that subjects bacteria. The second chart is static as is shows the top ten types of bacteria for all test subjects.
The D3 library was used to read in the samples.json dataset. A horizontal bar chart was created using Plotly to display the top 10 OTUs (microbial species) for a single test subject. A dropdown was created to allow the user to select which test subject's data they would like to view.
A secondary horizontal bar chart was created to show the top 10 OTUs (microbial species) found in all test subjects.
Both bar charts feature hovertext with addtional information about the OTUs observed.
A bubble chart was created to show the ount of microbes by family for the selected test subject
When a user selects a test subject, the sample metadata, i.e., that individual's demographic information is also displayed.
The first bar chart, and the bubble chart will update each time a new test subject is selected by the user.
