Revolutionize Your Business Insights with High-Performance, Scalable, and Alert-Driven Analytics!
- High-Performance Business Engine: Delivers robust performance with distributed load balancing and high availability, integrating seamlessly with Grafana.
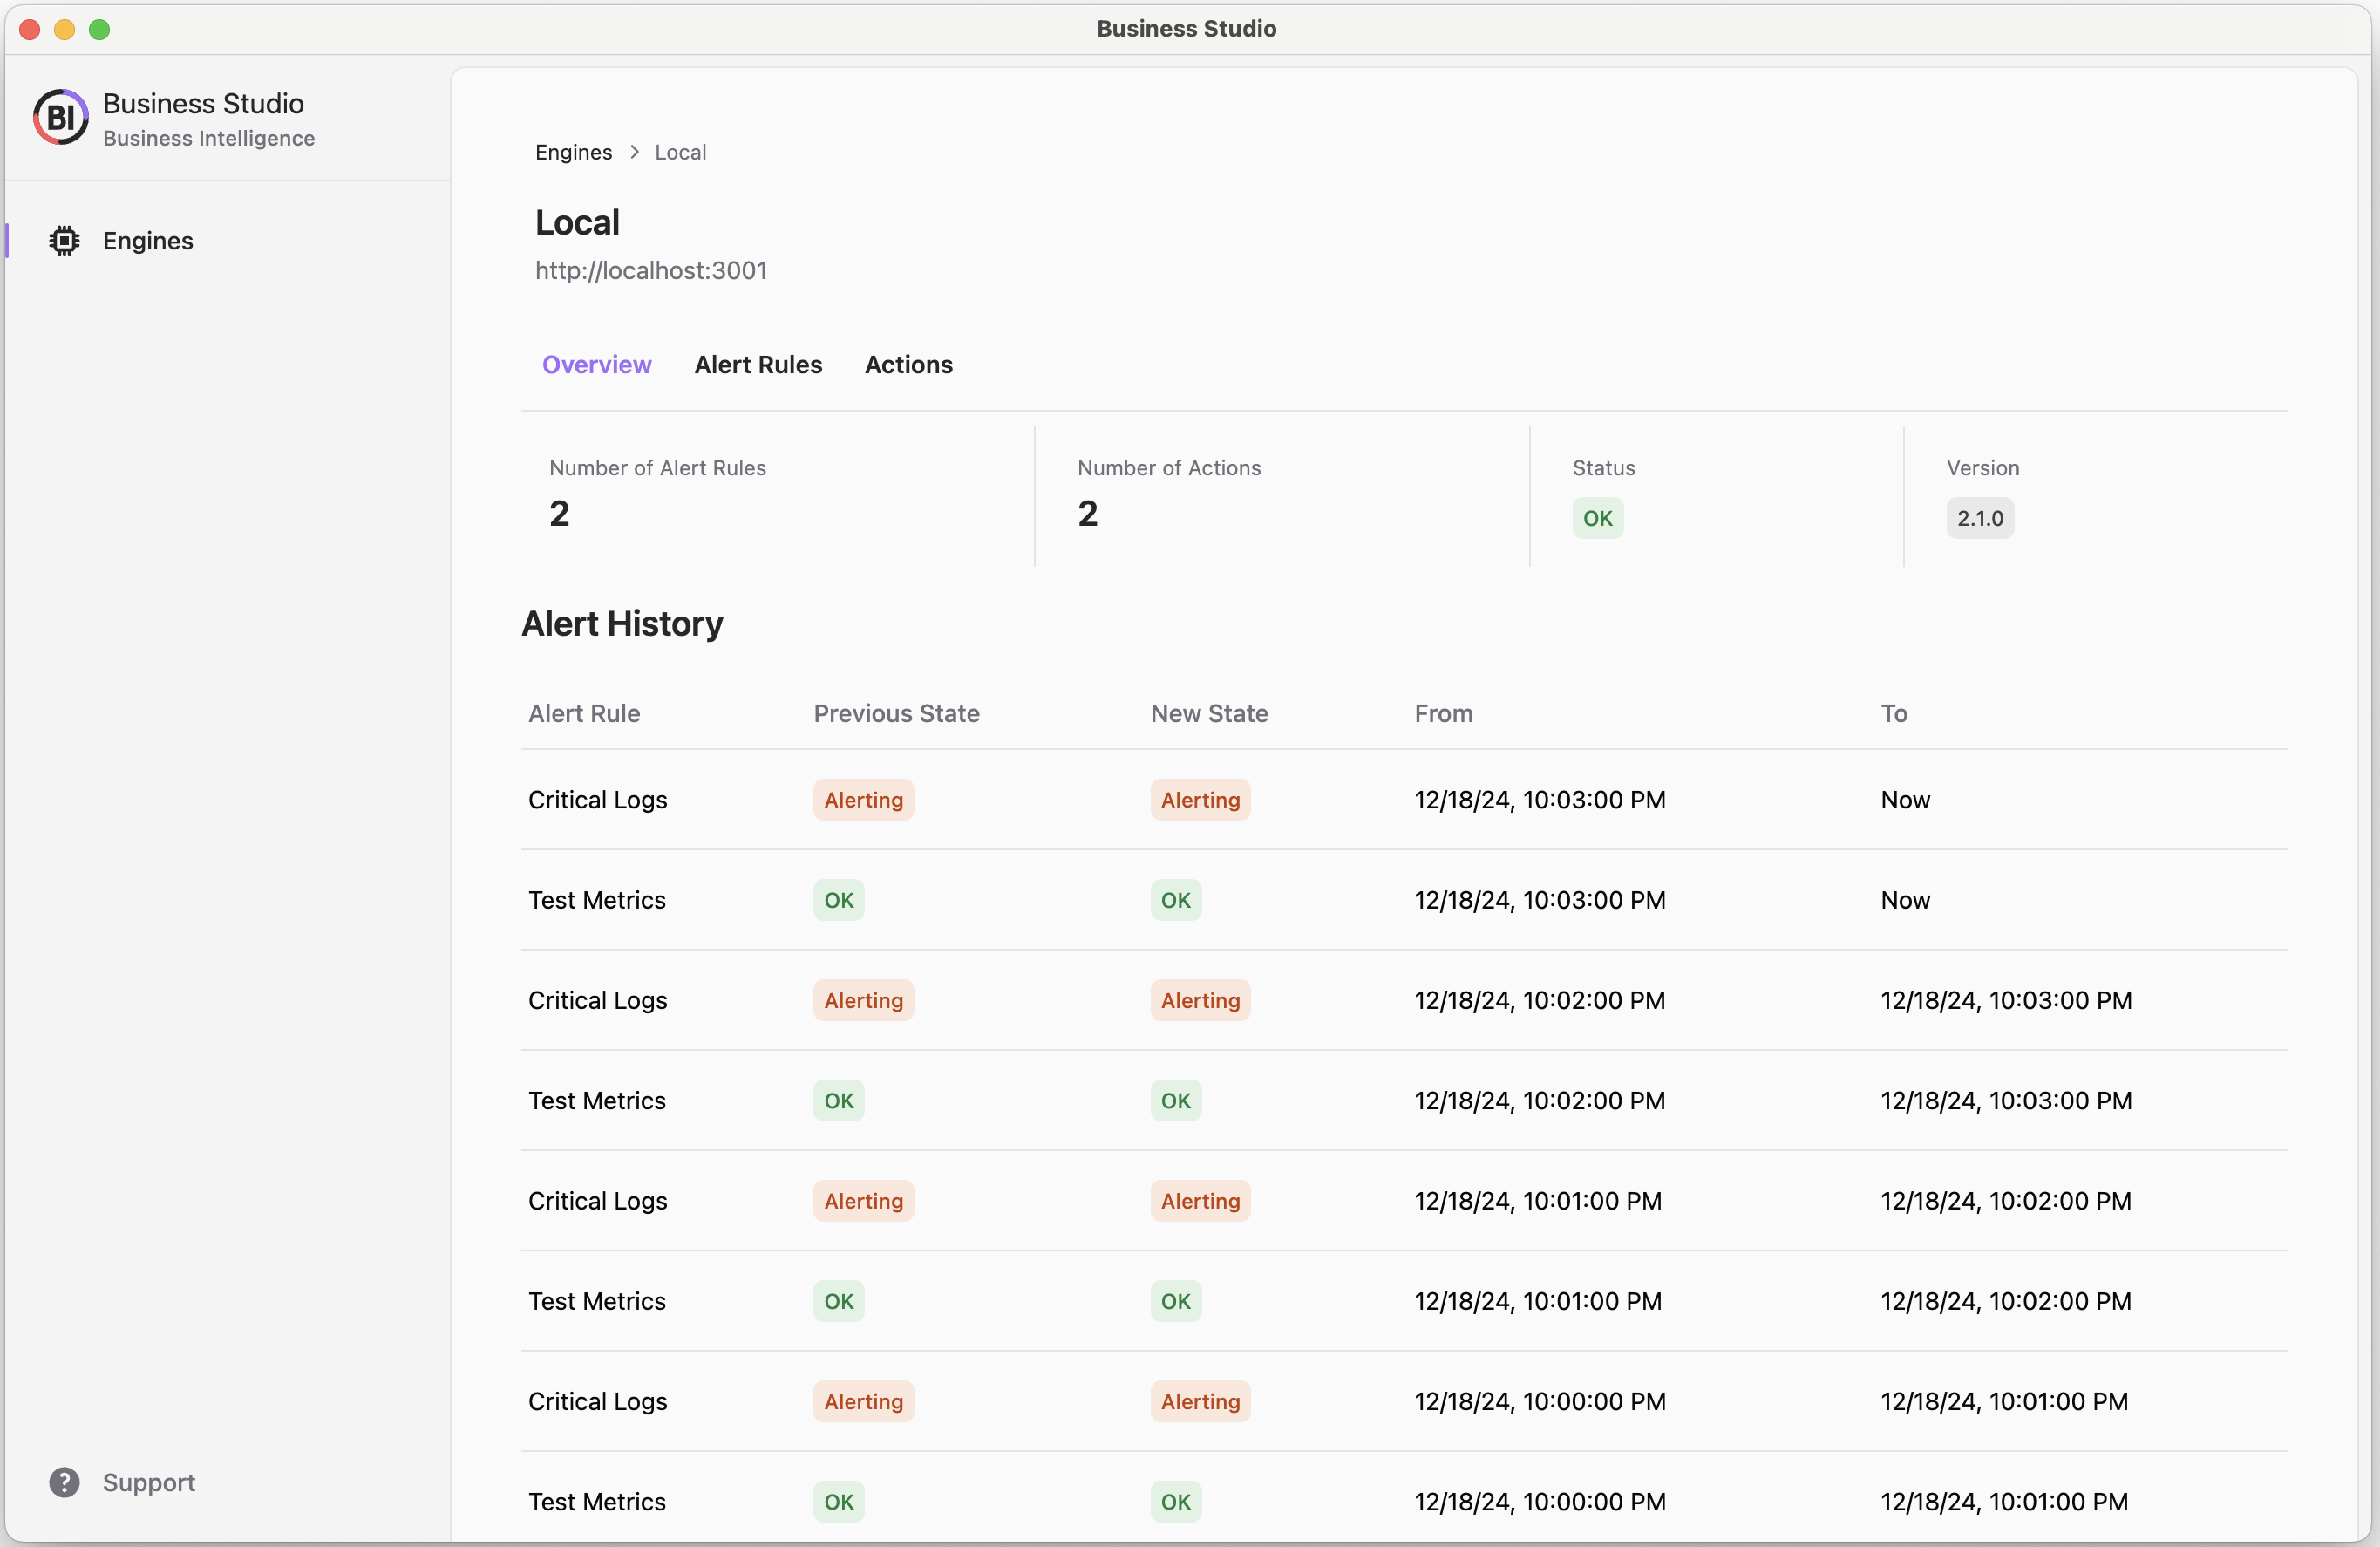
- User-Friendly Business Studio: Simplifies management of Business Engines, allowing non-technical users to configure, monitor, and maintain data workflows.
- Advanced Business Alerts: Features alert systems based on Grafana panel queries, with support for customizable thresholds and variables, ensuring timely and relevant notifications for business metrics.
- Business Intelligence platform 2.X supports Grafana 11.
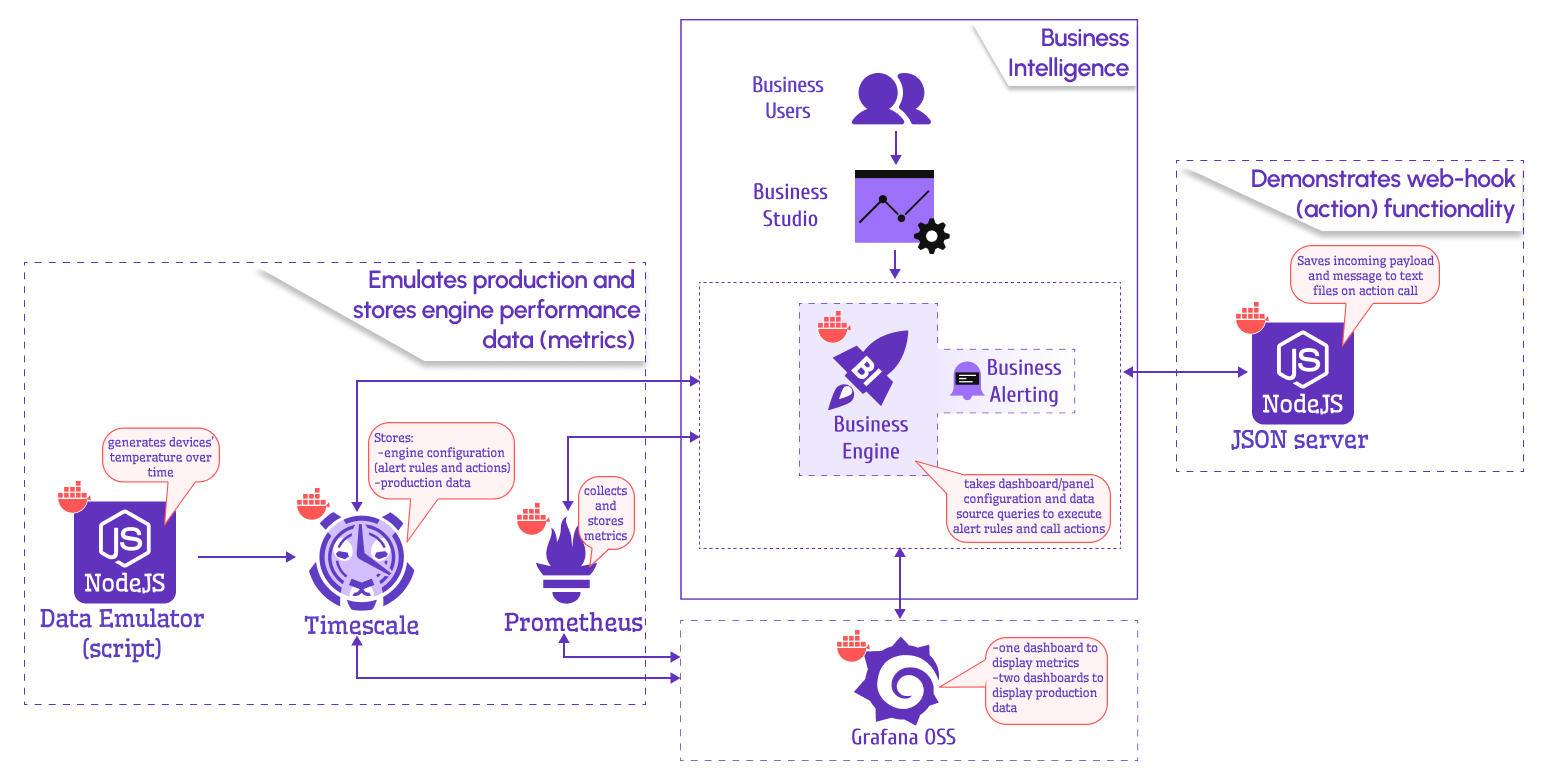
The Business Intelligence platform utilize Docker containers to be modular and scalable.
- Start Grafana container and login as admin user with
adminpassword:
docker compose --profile grafana up -d
- Create Service Account
- Start the Business Engine, Timescale database, and Prometheus containers
docker compose --profile engine up -d
- Start JSON Server to test Actions and data emulator to test dashboard variables
docker compose --profile actions up -d
docker compose --profile emulator up -d
-
Download and start the Business Studio from Releases
-
Add Engine and update Grafana connection details in Environment configuration
http://grafana:3000
- Configure Actions and Alert Rules
- Use JSON server
http://json-server:3000for HTTP Request Action to create event and message files when alert triggered if started. - Use provisioned
Test Dashboarddashboard for adding Alert Rules based on thresholds and Regex pattern. - Use provisioned
Metricsdashboard for adding Alert Rules based on dashboard variables and threshold overrides.
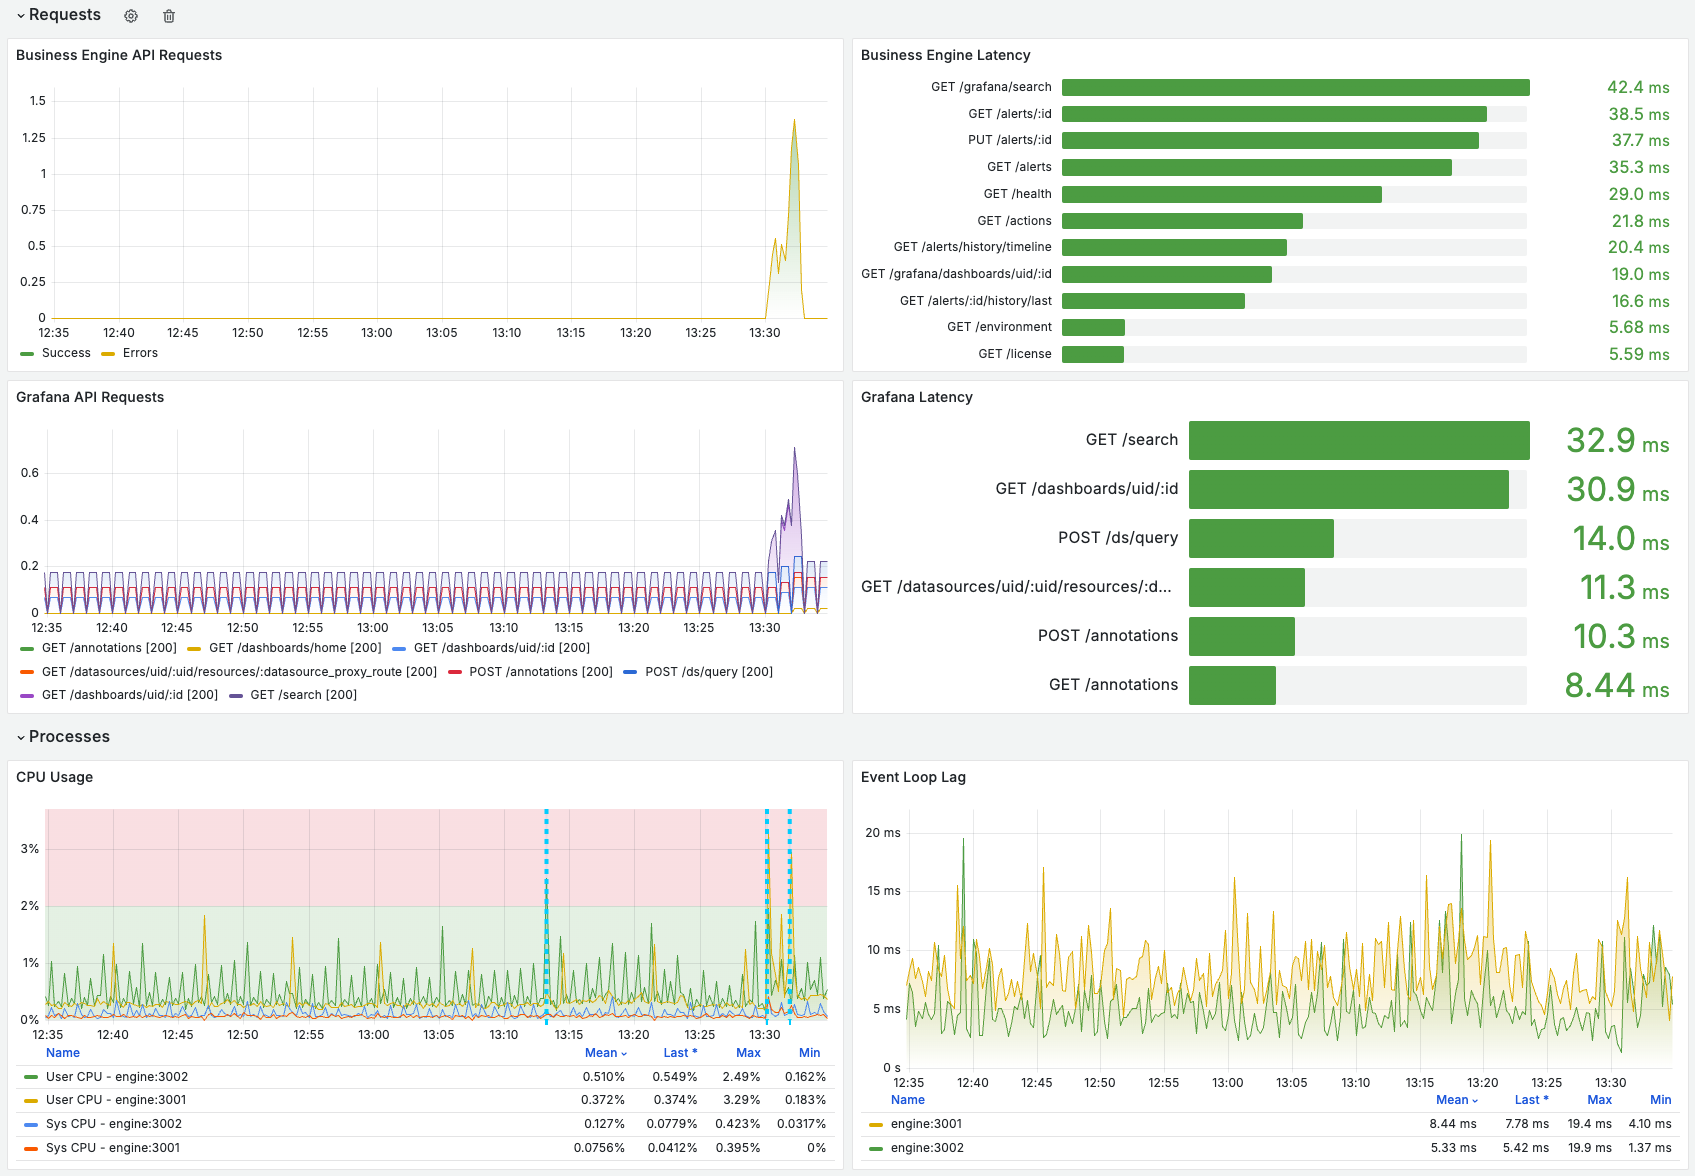
- Check performance and Prometheus metrics using provisioned
Business Enginedashboard
- Stop the Business Intelligence platform
docker compose --profile engine down
docker compose --profile actions down
docker compose --profile emulator down
docker compose --profile grafana down
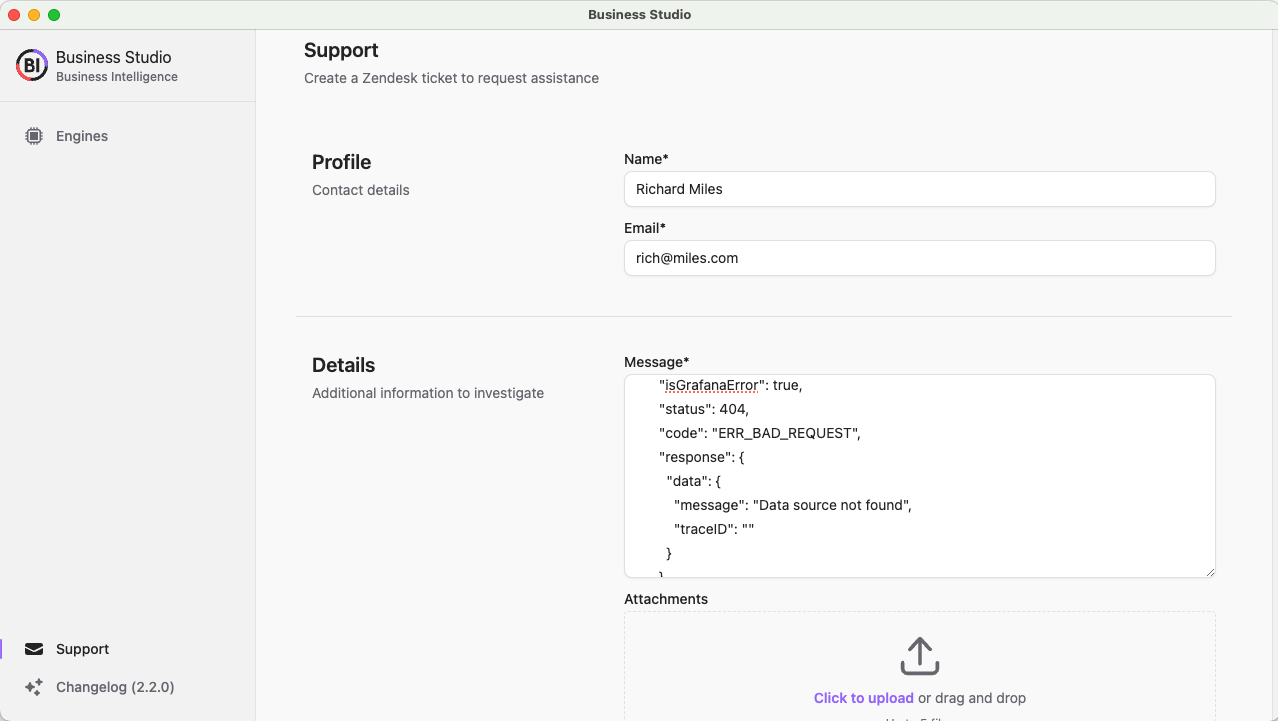
Request assistance directly from the Business Studio:
- Ask a question, request a new feature, and file a bug with GitHub issues.
- Subscribe to our YouTube Channel and leave your comments.


