Entity Details Report
Entity Details report is generated for Application and all of its Tiers, Nodes, Business Transactions, Backends, Service Endpoints and Errors for APM Aplications.
"Entity Timeline" view is the main part of this report that provides a chronological visualization of Events and Snapshots, enabling identification of re-occurring or persistent issues, including:
- 1-minute granularity Metrics in the 1 hour time frame for each hour in the exported range
- Filterable list of Events and Health Rule Violations, arranged in the timeline of that hour, with details of the Event
- Filterable list of Snapshots, broken by Business Transaction and User Experience, arranged in the timeline of that hour, and hotlinked to the specific Snapshot
You can also watch this training video:
Entity Details report is produced when:
- Job file included at least one APM application Target.Type=
APM - Metadata is extracted via Input.DetectedEntities=
true - Metrics are extracted via Input.Metrics=
trueOR Events are extracted via Input.Events=trueOR Flowmaps are extracted via Input.Flowmaps=trueOR Snapshots are extracted via Input.Snapshots=true - Report is requested via Output.EntityDetails=
true
Entity Details report has the following file name:
Report\<Controller>\<Application>\<APP|TIER|NODE|BT|BACK|ERR|SEP>\EntityDetails.<ControllerName>.<ApplicationName>.<EntityName>.<Start Date and Time>-<End Date and Time>.xlsx`
For example:
demo2.appdynamics.com\ECommerce.41\APP\demo2Ecommerce.2017091914.2.demo2.appdynamics.com.ECommerce.41.xlsx
| Data | Pivot |
|---|---|
| 1.Parameters | |
| 2.Contents | |
| 3.Controllers | |
| 4.Calls and Response | |
| 5.Activity Flow | |
| 6.Timeline | |
| 7.Events | |
| 8.Snapshots | |
| 9.Metric Detail |
This sheet describes the parameters of the extraction and reporting job that produced this report.
| Column | Data Type | Purpose |
|---|---|---|
| Controller | URL | Controller that was queried |
| UserName | String | User that was used to retrieve data from the Controller |
| Application | String | Name of Application that was queried |
| ApplicationID | Integer | ID of Application in Controller |
| ApplicationType | String | Type of the Application |
This sheet provides quick access to the contents of this report and provides at-a-glance number of rows in each of the sheet's tables.
| Column | Data Type | Purpose |
|---|---|---|
| Sheet Name | String | Name of the sheet in the report |
| Num Entities | Integer | Number of Entities in that sheet |
| Link | Hyperlink | Link to the sheet in the report |
This sheet provides information about Controllers covered by this report.
| Column | Data Type | Purpose |
|---|---|---|
| Controller | URL | Controller that was queried |
| Version | String | Version of the Controller |
| VersionDetail | String | Full version string of the Controller |
| NumApps | Integer | Number of all APM Applications registered in the Controller |
| NumAPMApps | Integer | Number of APM Applications registered in the Controller |
| NumWEBApps | Integer | Number of WEB Applications registered in the Controller |
| NumMOBILEApps | Integer | Number of MOBILE Applications registered in the Controller |
| NumIOTApps | Integer | Number of IoT Applications registered in the Controller |
| NumSIMApps | Integer | Number of SIM Applications registered in the Controller |
| NumBIQApps | Integer | Number of BIQ Applications registered in the Controller |
| NumDBApps | Integer | Number of DB Applications registered in the Controller |
| ControllerLink | URL | Link to Controller |
This sheet provides full range and hourly breakdowns identical to those in Entity Metrics report, only for this specific Entity.
This sheet represents the Grid View of the Flow Map in the Controller identical to those in Entity Metrics report, only for this specific Entity.
This sheet provides consolidated view of Metrics, Events and Snapshots for this Entity.
Each hour range is represented with 60 columns, one per minute, with Metric graph above it.
Each hourly range can be collapsed with outline feature:
The Events table selector allows filtering of events with following columns:
| Column | Data Type | Purpose |
|---|---|---|
| Type | String | Type of the Event |
| SubType | String | Subtype of the Event as reported by Controller |
| Tier | String | Name of Tier to which this Event applies, if applicable |
| BT | String | Name of Business Transaction to which this Event applies, if applicable |
| TriggeredEntityType | String | Type of Entity that triggered this Event |
The Events are listed in the minute ranges. Multiple Events in single minute result in multiple vertical entries stacked up on top of each other.
Each Event can be Error (E), Warning (W) or Info (I)
If there are multiple Events in the row, there is a grouping collapse area on the left. The first row also contains UNDERLINE under the letter.
Clicking on Event takes you to the 7.Events sheet.
In this example, the multiple rows of the APPLICATION_ERROR for ECommerce-Services are collapsed. Note the single Warning (W) event for diagnostic session for Fetch Data at minute 0 and another one for Login at minute 4, without any underlines. Compare with Application Error having multiple Events per minute, and Custom Service Availability events, 2 Error and 2 Info per minute:

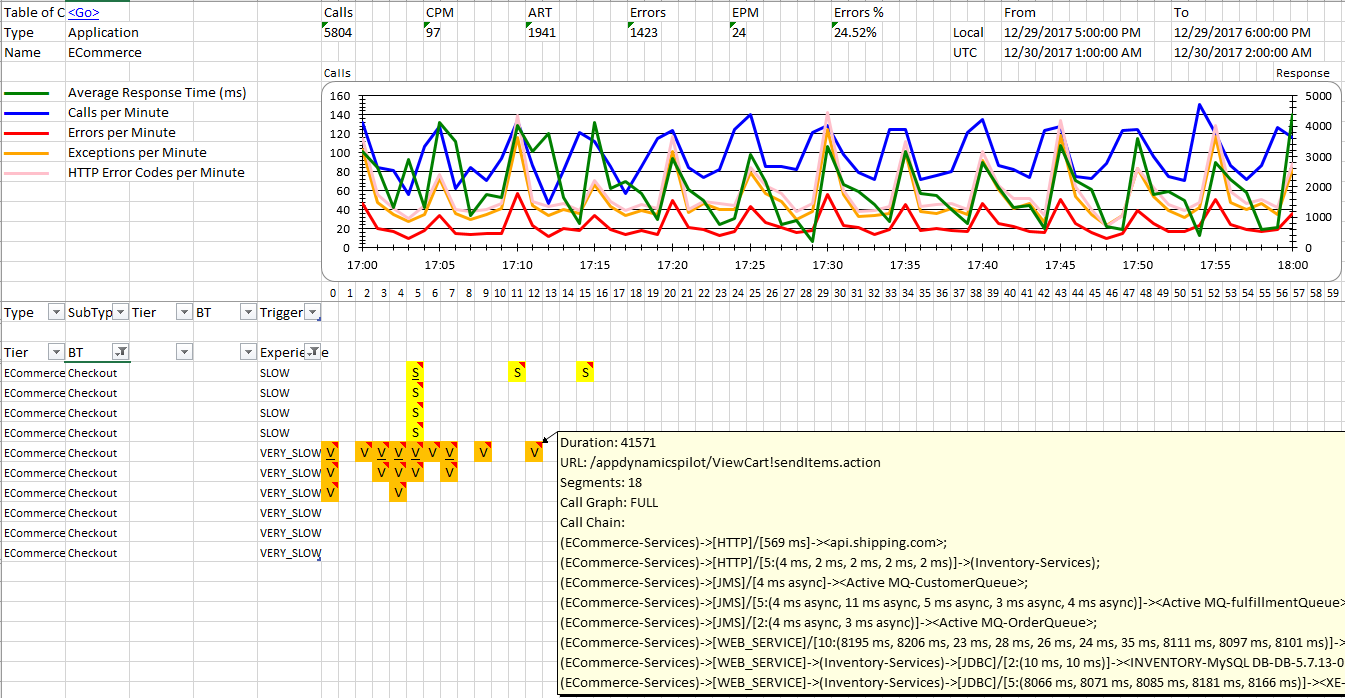
The Snapshots table selector allows filtering of events with following columns:
| Column | Data Type | Purpose |
|---|---|---|
| Tier | String | Name of Tier for Snapshot |
| BT | String | Name of Business Transaction for Snapshot |
| Experience | String | User Experience of Snapshot |
The Snapshots are listed in the minute ranges. Multiple Snapshots in single minute result in multiple vertical entries stacked up on top of each other.
Each Snapshot can be Normal (N), Slow (S) or Very Slow (V), Stall (X) or Error (E).
If there are multiple Snapshots in the row, there is a grouping collapse area on the left. The first row also contains UNDERLINE under the letter.
Each Snapshot has a Flyout comment that can be seen when hovering over it with more details.
Clicking on Snapshot takes you to the 8.Snapshots sheet.
In this example the table is filtered to Checkout and to remove Normal snapshots, and Very Slow transaction is shown with the Call Graphs (Flow Map):
This sheet provides data identical to that in Events and Health Rule Violations report, filtered to Events applicable to this Entity.
This sheet provides data identical to that in Snapshots report, filtered to Snapshots applicable to this Entity.
All data for the metric graphs specified in the mapping file is stored in this sheet.