-
Notifications
You must be signed in to change notification settings - Fork 11
/
Copy pathindex.qmd
125 lines (85 loc) · 2.17 KB
/
index.qmd
1
2
3
4
5
6
7
8
9
10
11
12
13
14
15
16
17
18
19
20
21
22
23
24
25
26
27
28
29
30
31
32
33
34
35
36
37
38
39
40
41
42
43
44
45
46
47
48
49
50
51
52
53
54
55
56
57
58
59
60
61
62
63
64
65
66
67
68
69
70
71
72
73
74
75
76
77
78
79
80
81
82
83
84
85
86
87
88
89
90
91
92
93
94
95
96
97
98
99
100
101
102
103
104
105
106
107
108
109
110
111
112
113
114
115
116
117
118
119
120
121
122
123
---
title: "Hello, Quarto"
format: html
editor: visual
---
```{r}
#| label: load-packages
#| include: false
library(tidyverse)
library(palmerpenguins)
```
## Meet Quarto
Quarto enables you to weave together content and executable code into a finished document. To learn more about Quarto see <https://quarto.org>.
## Meet the penguins
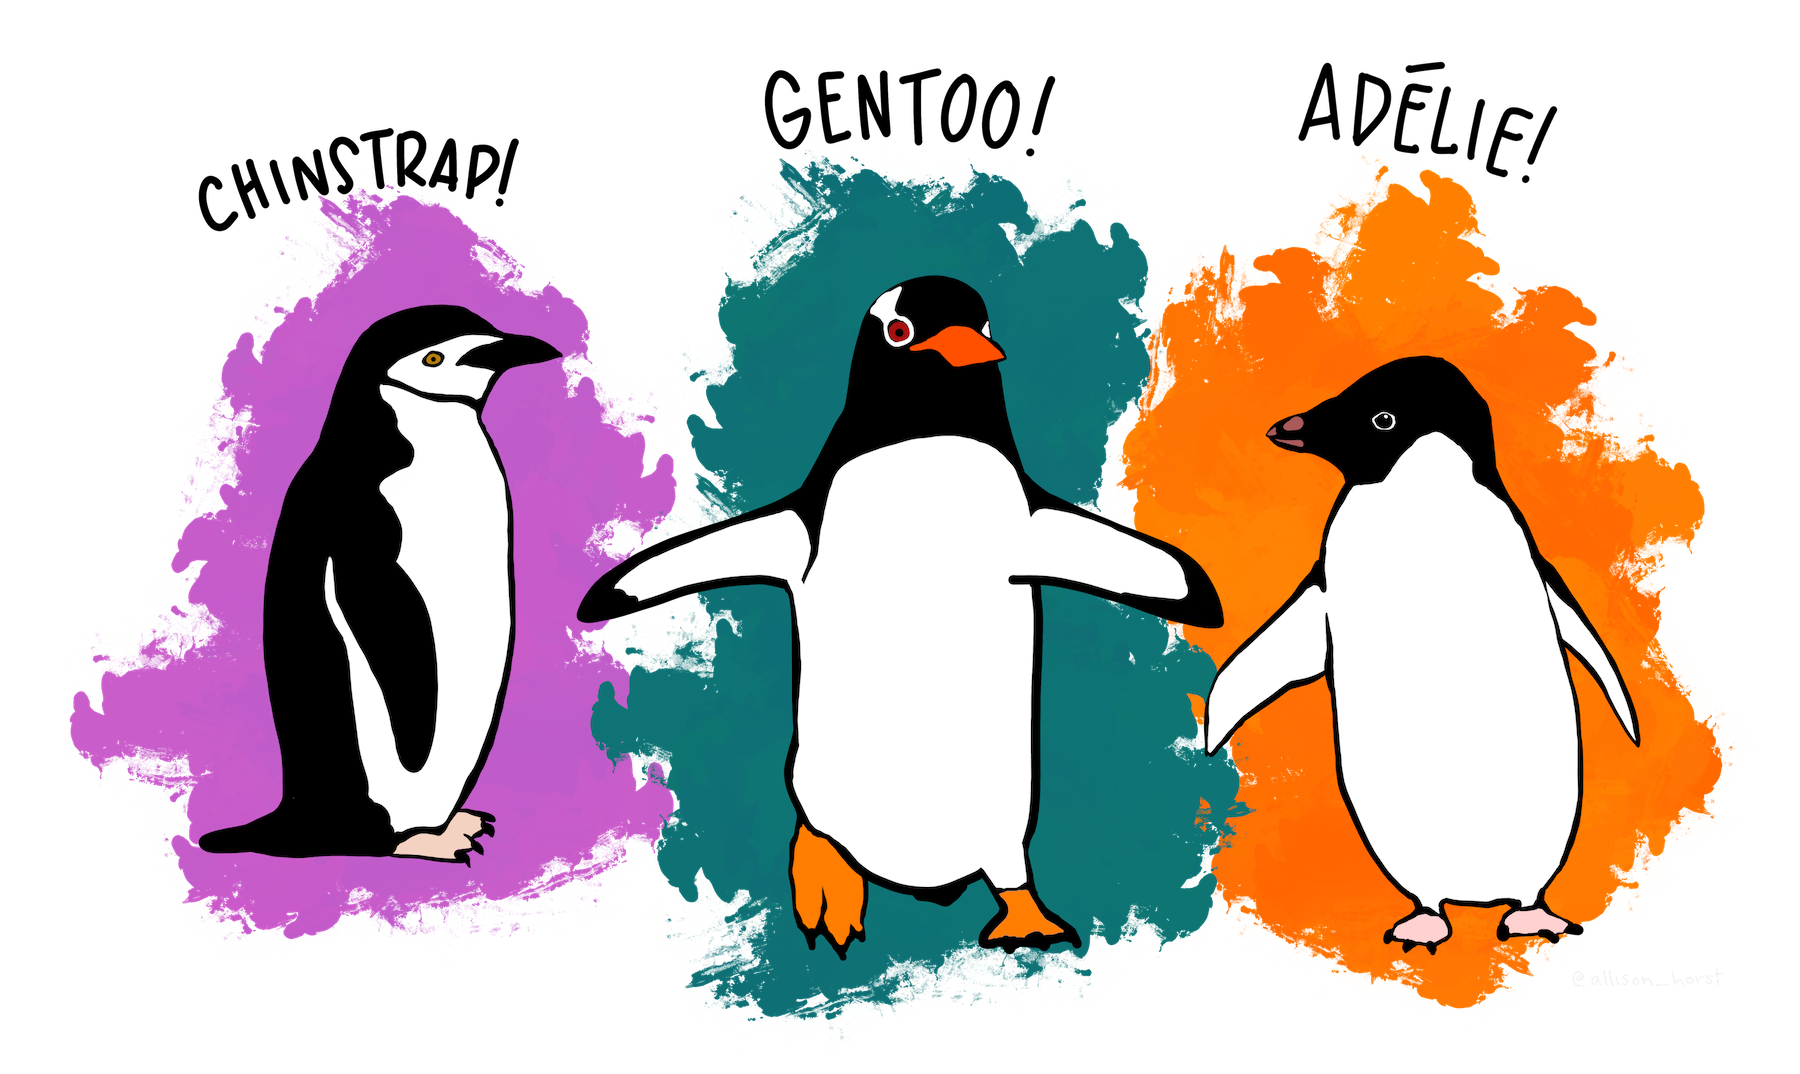{style="float:right;" fig-alt="Illustration of three species of Palmer Archipelago penguins: Chinstrap, Gentoo, and Adelie. Artwork by @allison_horst." width="401"}
The `penguins` data from the [**palmerpenguins**](https://allisonhorst.github.io/palmerpenguins "palmerpenguins R package") package contains size measurements for `r nrow(penguins)` penguins from three species observed on three islands in the Palmer Archipelago, Antarctica.
The plot below shows the relationship between flipper and bill lengths of these penguins.
```{r}
#| label: plot-penguins
#| warning: false
#| echo: false
ggplot(penguins,
aes(x = flipper_length_mm, y = bill_length_mm)) +
geom_point(aes(color = species, shape = species)) +
scale_color_manual(values = c("darkorange","purple","cyan4")) +
labs(
title = "Flipper and bill length",
subtitle = "Dimensions for penguins at Palmer Station LTER",
x = "Flipper length (mm)", y = "Bill length (mm)",
color = "Penguin species", shape = "Penguin species"
) +
theme_minimal()
```
## code chuk
```{r}
a <- 1
```
```{r}
#| eval: false
a <- 2
```
```{r}
print(a)
```
## Inline code
오늘 날짜는 "`r Sys.Date()`" 입니다.
## Table
- 그냥 출력
```{r}
ex <- read.csv('https://github.com/zarathucorp/R4CR-content/raw/main/example_g1e.csv')
head(ex)
```
```{r}
library(knitr)
library(reactable)
library(DT)
```
- kable (STATIC, PDF)
```{r}
knitr::kable(head(ex))
```
- reactable
```{r}
reactable::reactable(ex)
```
- DT
```{r}
DT::datatable(ex)
```
iris 데이터의 행은 `r nrow(iris)`개이다.
```{r}
#| eval: true
#| echo: false
library(dplyr)
```
```{r}
#| eval: false
#| echo: true
print(1+3)
```
```{r}
#| eval: false
#| echo: false
print(1+4)
```