-
Notifications
You must be signed in to change notification settings - Fork 0
/
Copy pathsoftware.qmd
182 lines (106 loc) · 5.78 KB
/
software.qmd
1
2
3
4
5
6
7
8
9
10
11
12
13
14
15
16
17
18
19
20
21
22
23
24
25
26
27
28
29
30
31
32
33
34
35
36
37
38
39
40
41
42
43
44
45
46
47
48
49
50
51
52
53
54
55
56
57
58
59
60
61
62
63
64
65
66
67
68
69
70
71
72
73
74
75
76
77
78
79
80
81
82
83
84
85
86
87
88
89
90
91
92
93
94
95
96
97
98
99
100
101
102
103
104
105
106
107
108
109
110
111
112
113
114
115
116
117
118
119
120
121
122
123
124
125
126
127
128
129
130
131
132
133
134
135
136
137
138
139
140
141
142
143
144
145
146
147
148
149
150
151
152
153
154
155
156
157
158
159
160
161
162
163
164
165
166
167
168
169
170
171
172
173
174
175
176
177
178
179
180
181
---
title: "Software"
---
# R Packages
## [ggdiagram](https://wjschne.github.io/ggdiagram/)
::::{.columns}
:::{.column width=70%}
[An object-oriented approach to making diagrams via ggplot2]{.lead}
:::
:::{.column width=30%}
[{width="150px"}](https://wjschne.github.io/simstandard/index.html){style='position:relative; bottom:65px'}
:::
::::
Complex diagrams can take a long time to get right. The ggdiagram package can take away much of the burden of tedious calculation.
{width="600px"}
{width="600px"}
{width="600px"}
## [simstandard](https://wjschne.github.io/simstandard/index.html)
::::{.columns}
:::{.column width=70%}
[R package for simulating data using standardized coefficients]{.lead}
[Tutorial](https://wjschne.github.io/simstandard/articles/simstandard_tutorial.html)
:::
:::{.column width=30%}
[{width="150px"}](https://wjschne.github.io/simstandard/index.html){style='position:relative; bottom:65px'}
:::
::::
In the model below, the path coefficients are standardized. You would like to simulate the variables in the model, but you do not know the disturbance and residual variances. The simstandard package can help.
{width="600px"}
## [unusualprofile](https://wjschne.github.io/unusualprofile/index.html)
::::{.columns}
:::{.column width=70%}
[An R package for detecting unusual scores in a test profile]{.lead}
[Tutorial](https://wjschne.github.io/unusualprofile/articles/tutorial_unusualprofile.html)
:::
:::{.column width=30%}
[{width="150px"}](https://wjschne.github.io/unusualprofile/index.html){style='position:relative; bottom:65px'}
:::
::::
This package estimates how unusual a multivariate normal profile is.
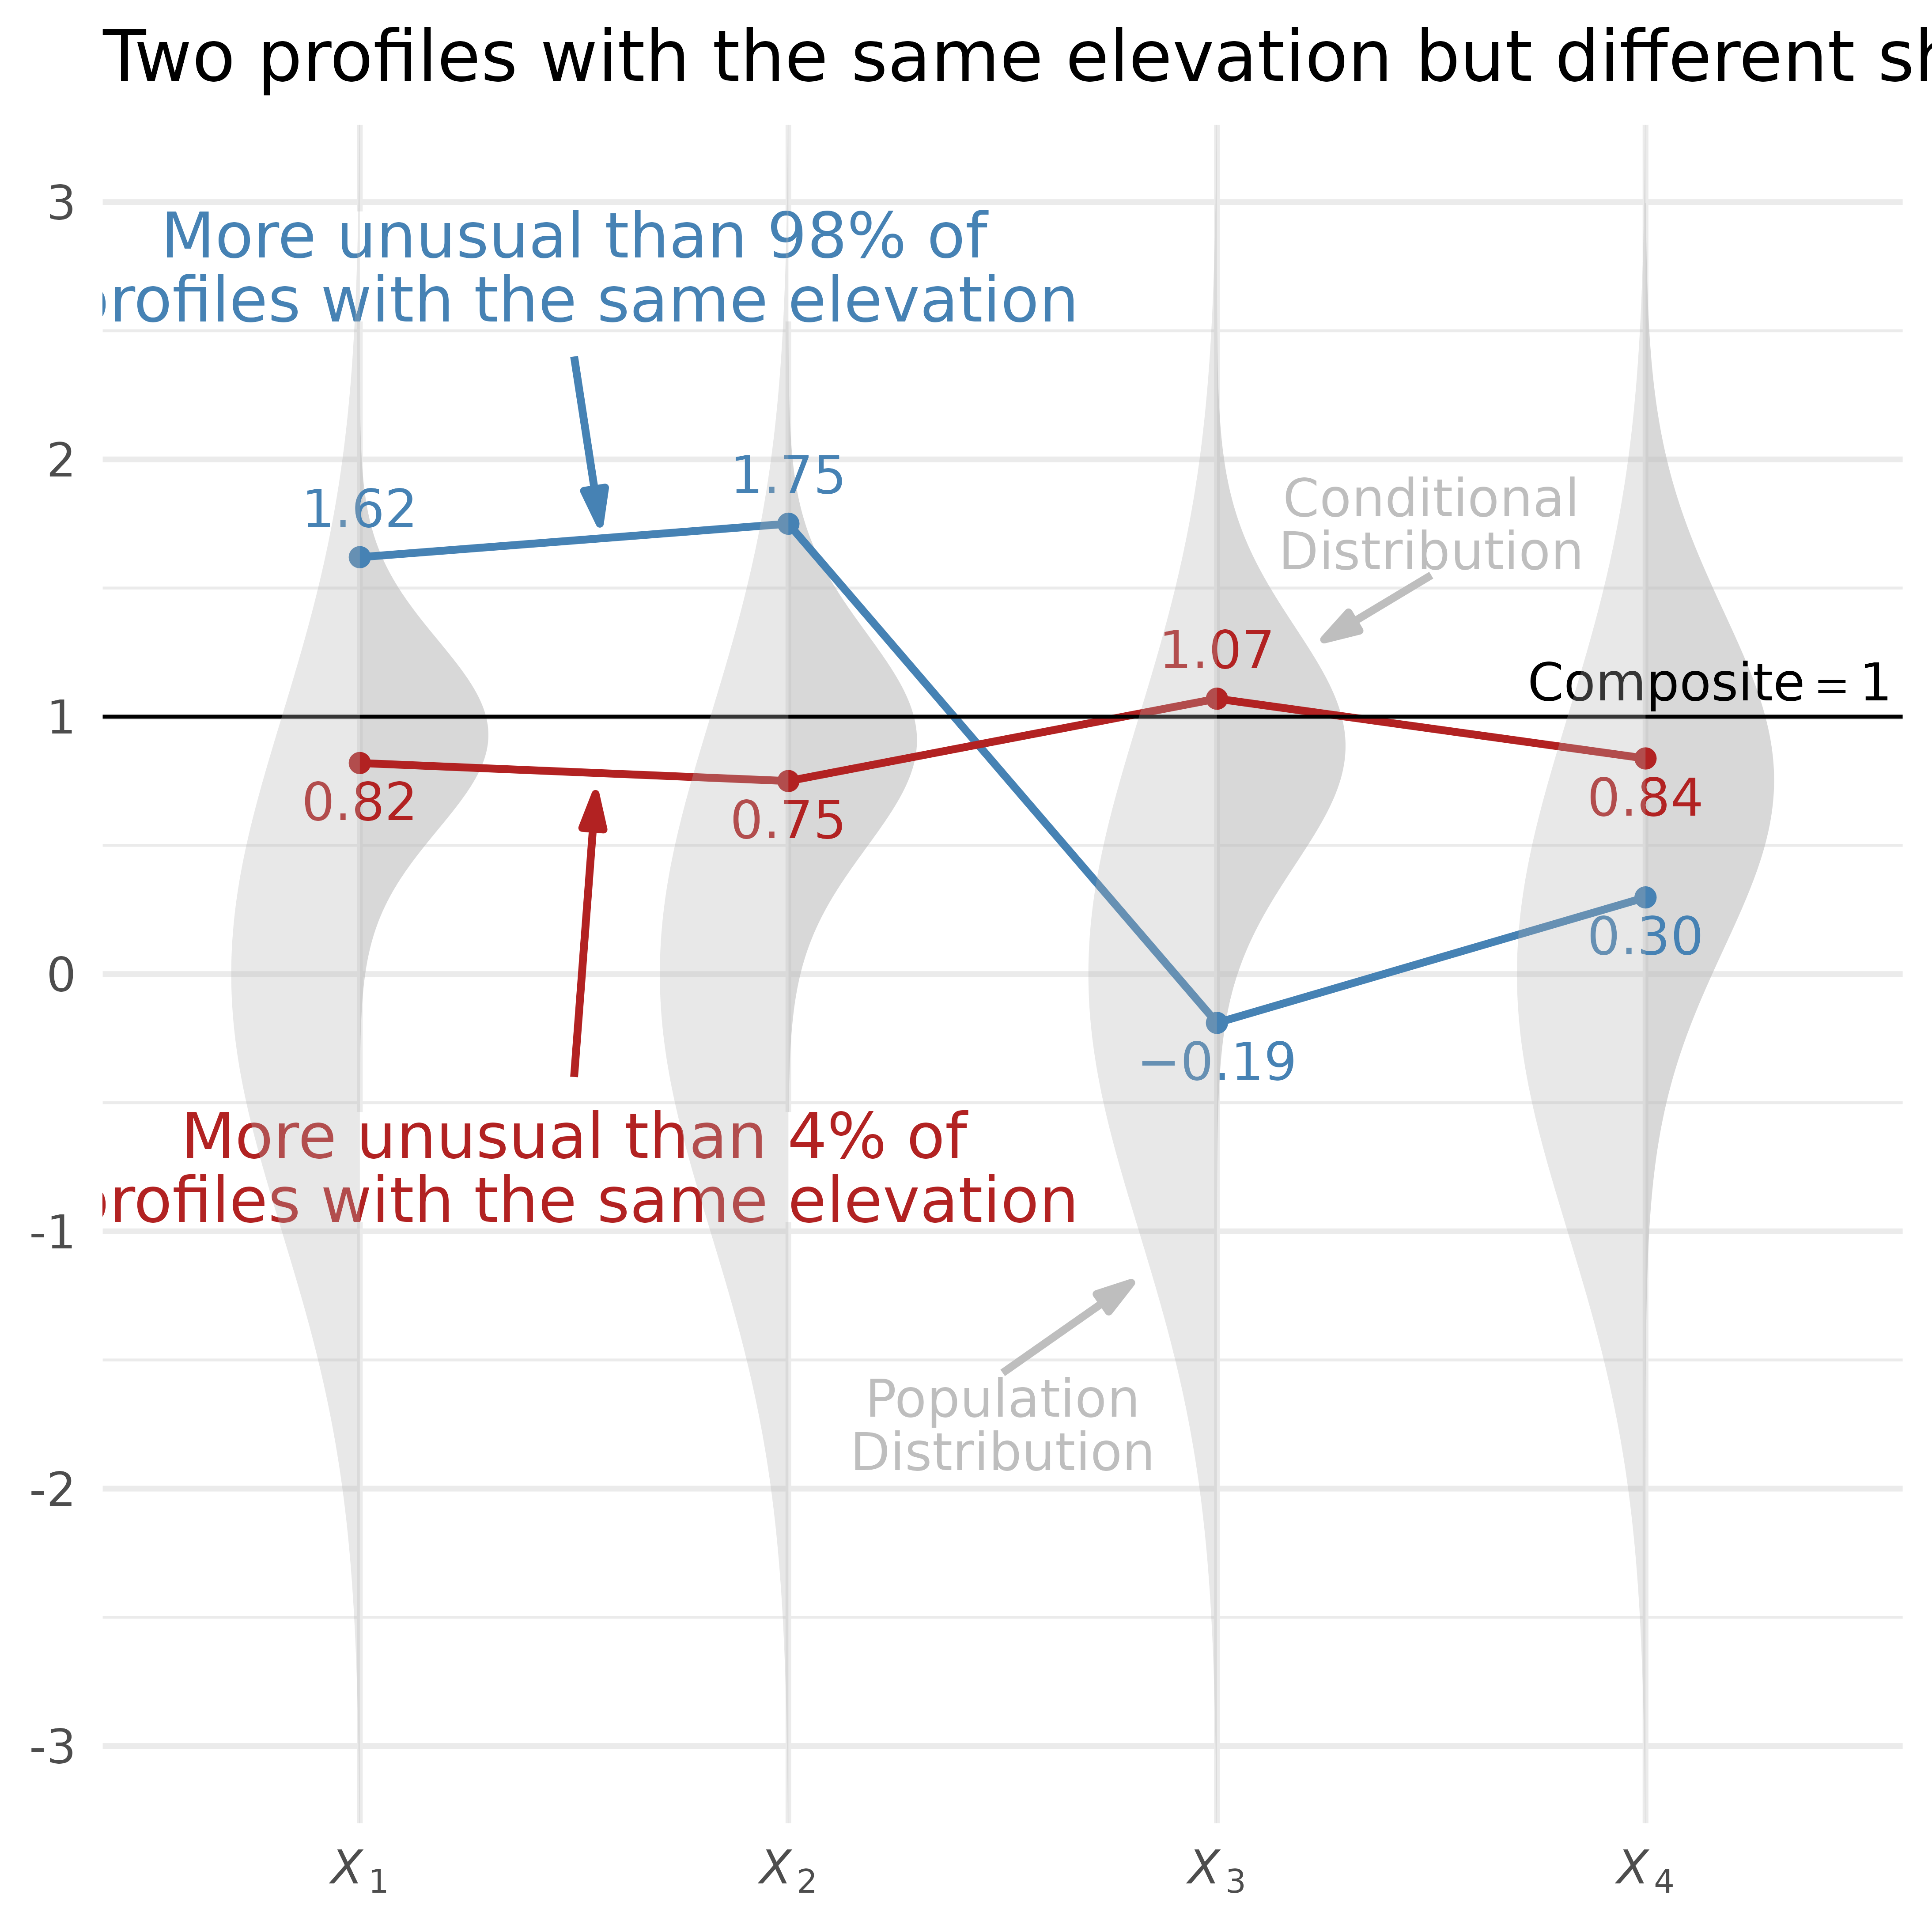{width="600px"}
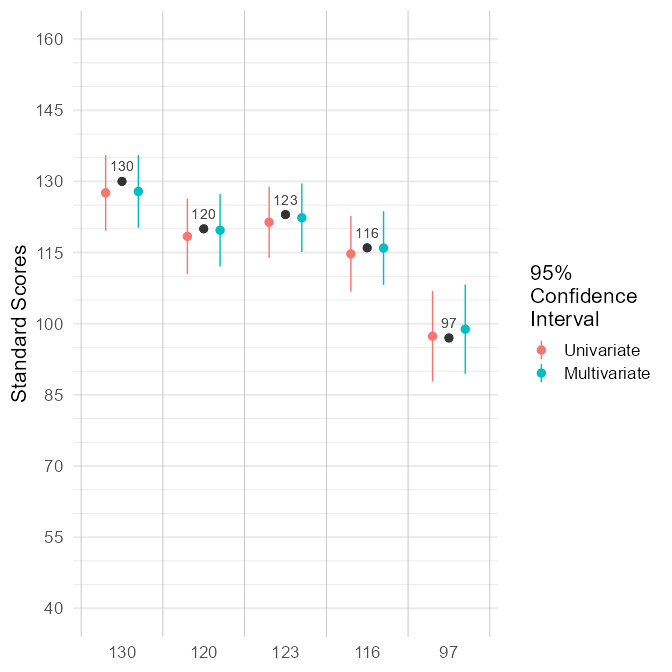
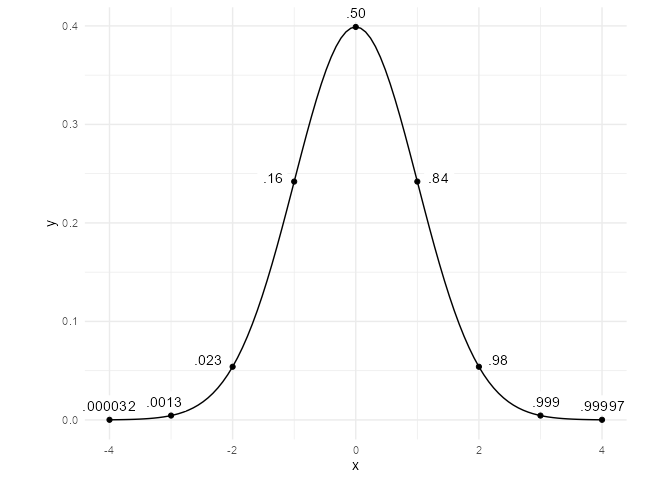
## [ggnormalviolin](https://wjschne.github.io/ggnormalviolin/index.html)
::::{.columns}
:::{.column width=70%}
[A ggplot2 extension package for creating normal violin plots]{.lead}
:::
:::{.column width=30%}
[{width="150px"}](https://wjschne.github.io/ggnormalviolin/index.html){style='position:relative; bottom:65px'}
:::
::::
I needed to show confidence intervals and conditional normal distributions with specific means and standard deviations. I wrote the ggnormalviolin package to make this happen.
It makes plots like this:

## [psycheval](https://wjschne.github.io/psycheval/)
::::{.columns}
:::{.column width=70%}
[Functions useful for psychological evaluations]{.lead}
This package is still in a preliminary state, just like [Individual Psychometrics](https://individual-psychometrics.rbind.io/), the book it accompanies.
:::
:::{.column width=30%}
[{width="150px"}](https://wjschne.github.iopsycheval/index.html){style='position:relative; bottom:65px'}
:::
::::
## [WJSmisc](https://wjschne.github.io/WJSmisc/)
::::{.columns}
:::{.column width=70%}
[A set of functions I find convenient to have readily available to me]{.lead}
:::
:::{.column width=30%}
[{width="150px"}](https://wjschne.github.io/WJSmisc/index.html){style='position:relative; bottom:65px'}
:::
::::
## [spiro](https://wjschne.github.io/spiro/index.html)
::::{.columns}
:::{.column width=70%}
[An R package for making digital spirographs]{.lead}
[Tutorial](https://wjschne.github.io/spiro/articles/HowToUse/spiro.html)
[My Gallery](https://wjschne.github.io/spirogallery/#1)
:::
:::{.column width=30%}
[{width="150px"}](https://wjschne.github.io/spiro/index.html){style='position:relative; bottom:65px'}
:::
::::
Making digital spirographs is fun! I made an R package called [spiro](https://wjschne.github.io/spiro/index.html) that can make animated spirographs like this one:

## [arrowheadr](https://wjschne.github.io/arrowheadr/)
::::{.columns}
:::{.column width=70%}
[R package for making a custom arrowheads for ggplot2 using ggarrow]{.lead}
[Tutorial](https://wjschne.github.io/posts/2023-08-26-making-a-custom-arrowhead-for-ggplot2-using-ggarrow-and-arrowheadr/)
:::
:::{.column width=30%}
[{width="150px"}](https://wjschne.github.io/arrowheadr/index.html){style='position:relative; bottom:65px'}
:::
::::
The arrowheadr package allows one to create custom arrowheads that can be used with the [ggarrow](https://github.com/teunbrand/ggarrow) package.

# Quarto Extensions
## [apaquarto](https://github.com/wjschne/apaquarto)
[A Quarto Extension for Creating APA 7 Style Documents]{.lead}
This is a quarto article template that creates [APA Style 7th Edition documents](https://apastyle.apa.org/) in .docx, .html. and .pdf. I made this extension for my own workflow. If it helps you, too, I am happy. The output of the template is displayed below:
<object data="files/apaquarto.pdf" type="application/pdf" width="100%" height="500px">
<p>Unable to display PDF file. <a href="files/apaquarto.pdf">Download</a> instead.</p>
</object>