Name
RSI指标结合布林带的交易策略RSI-Bollinger-Bands-TP-SL-Strategy
Author
ChaoZhang
Strategy Description
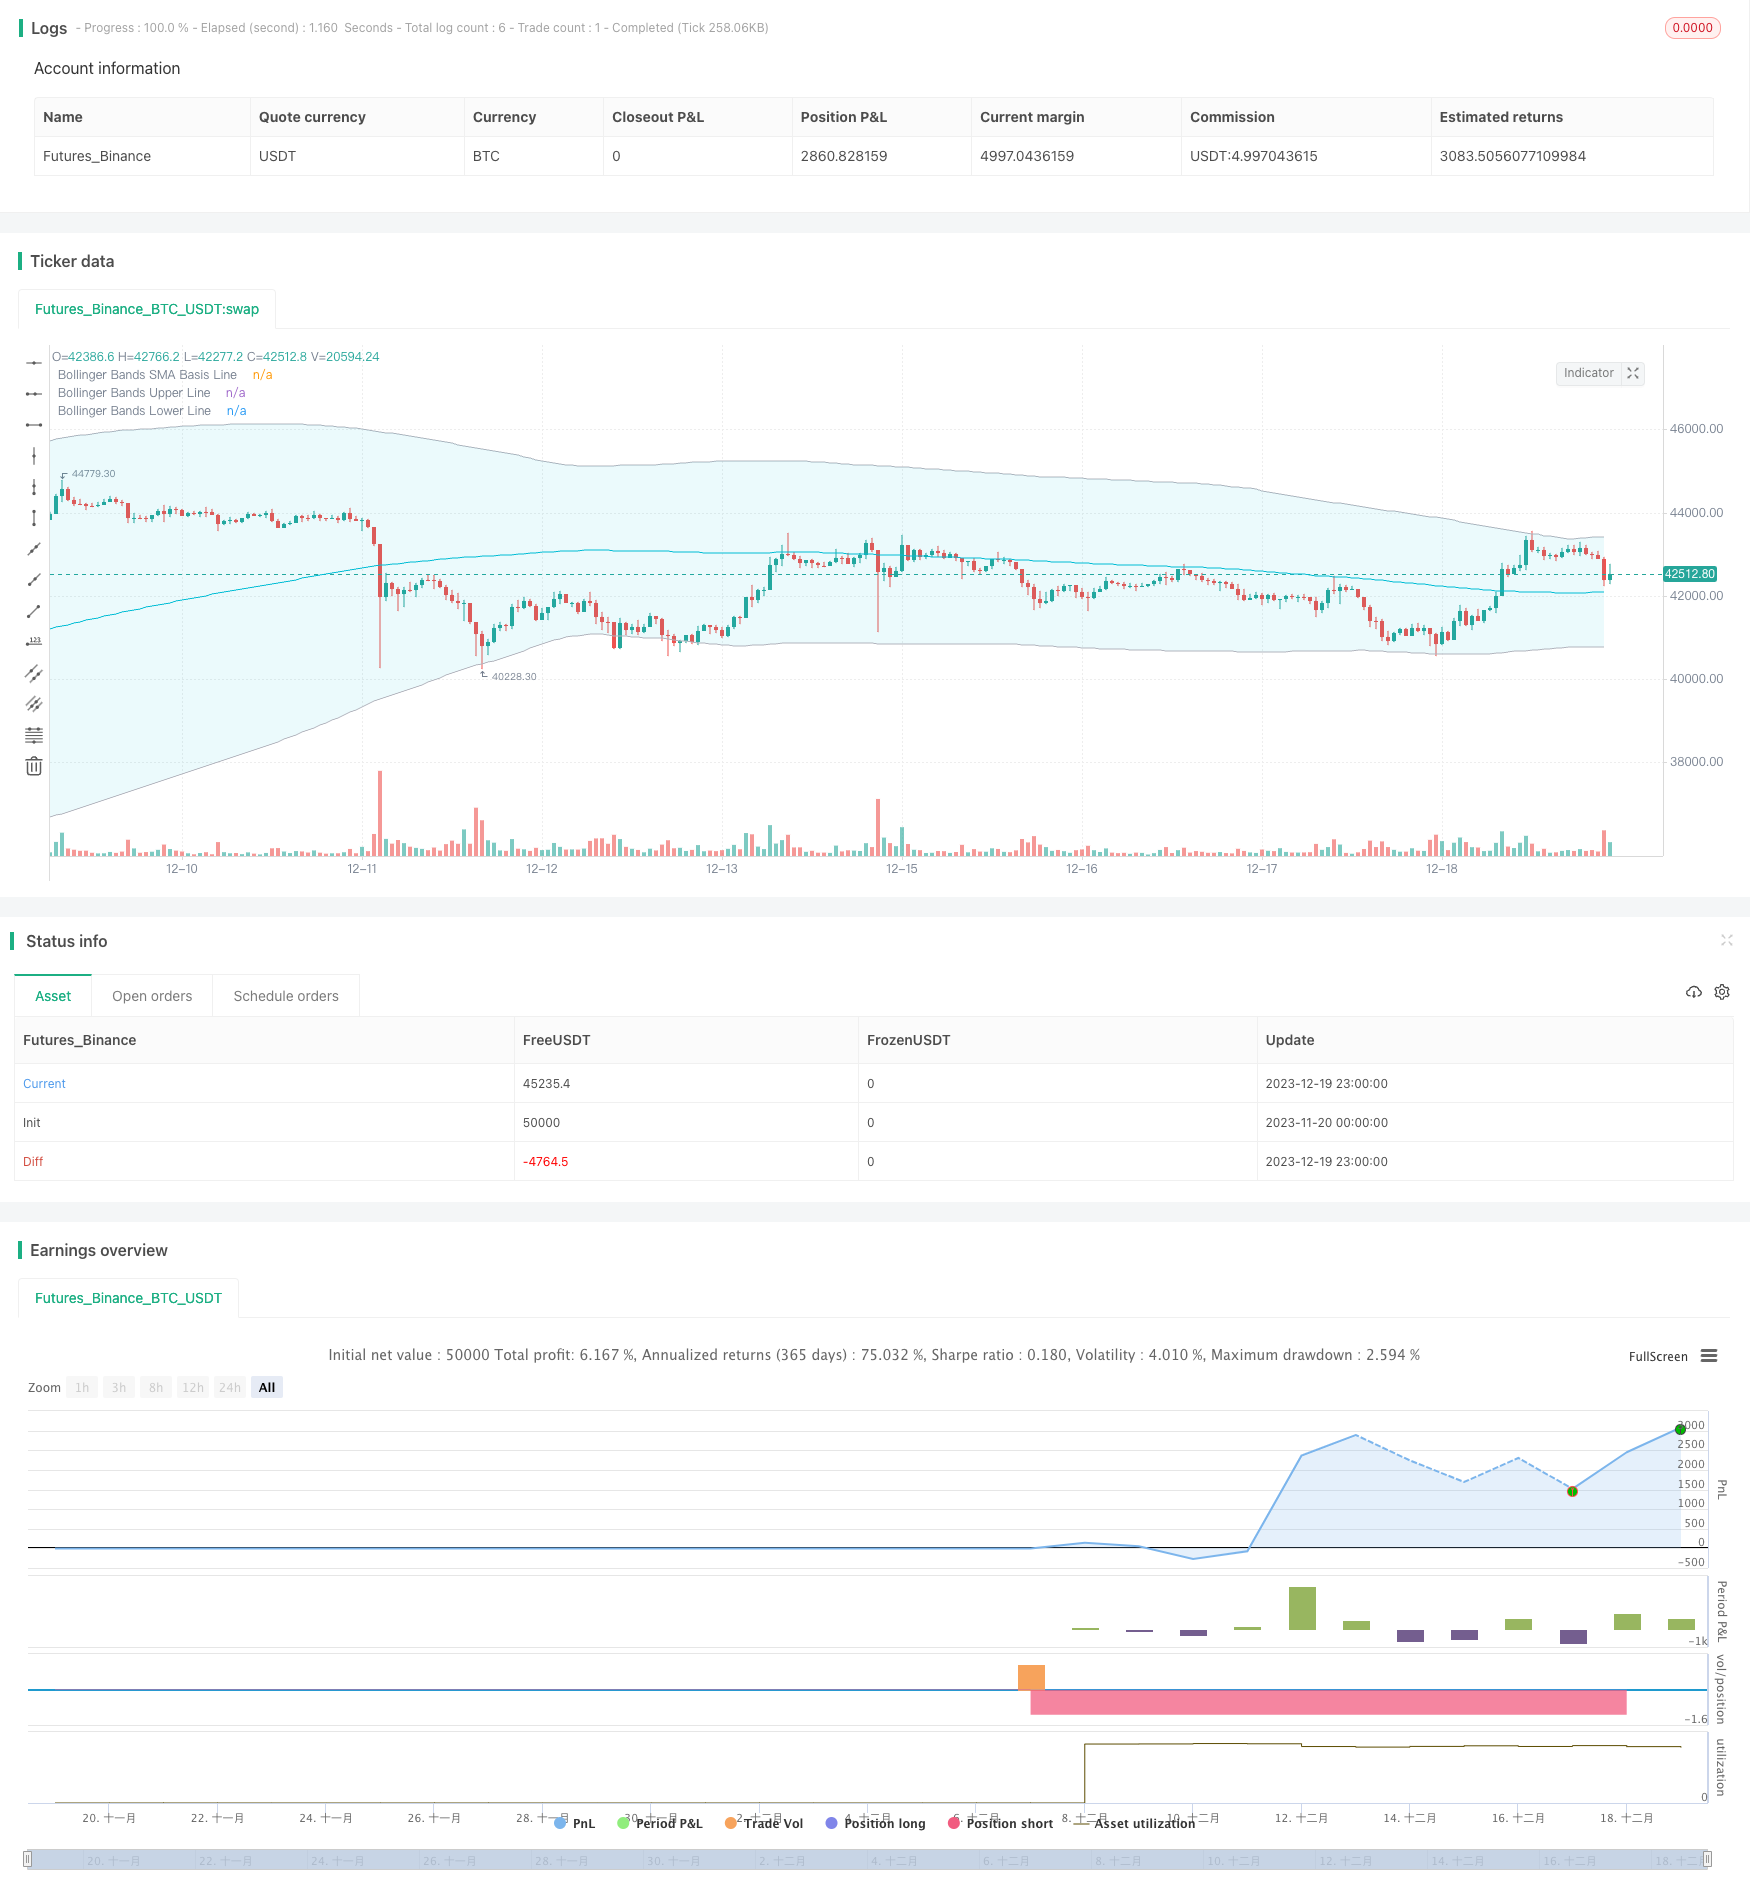
本策略名称为RSI布林带止盈止损策略(RSI Bollinger Bands TP/SL Strategy)。该策略融合了RSI指标和布林带指标,实现了趋势定位和突破交易。当RSI指标出现超买超卖信号,并且价格触及或突破布林带上轨或下轨时,进行做多或做空操作。同时,策略还设置了止盈止损点,可以提高稳定性。
RSI指标可以判断股票是否处于超买超卖区间。当RSI大于设定的超买线时为超买,小于设定的超卖区间时为超卖。本策略设置超买线为50,超卖线为50。
布林带通过计算股价的标准差,得到股价的上下轨。上轨为阻力线,下轨为支撑线。当股价上穿下轨时为买点,下穿上轨时为卖点。
当RSI指标出现底部反转信号,同时股价突破布林带下轨时,认为行情由下向上反转,做多;当RSI指标出现顶部反转信号,同时股价跌破布林带上轨时,认为行情由上向下反转,做空。
RSI指标和布林带指标都用于判断趋势和逆转点。两者结合使用,可以提高真正买卖信号的识别准确率,避免假突破。
策略设置了止盈止损点,做多止盈点为入场价*(1+止盈比例),止损点为入场价*(1-止损比例);做空则相反,这可以锁定盈利,最大程度避免亏损,控制风险。
策略可选择只做多、只做空或双向交易,用户可以根据市场环境选择不同方向,灵活控制风险。
布林带的标准差大小影响布林带的宽度从而影响交易信号产生。如果参数设置不当,可能产生大量错误信号。
如果行情出现V型反转,止盈止损设置可能过于激进,造成不必要的亏损。
RSI的参数也会影响RSI曲线的形态。如果RSI参数设置错误,则RSI反转信号准确性降低。
可以测试更多种RSI长度参数,找到最佳参数组合。
可以测试更多种布林带长度和标准差参数,找到最佳参数组合。
可以通过回测找到最佳的止盈止损比例参数。
本策略综合运用RSI指标和布林带指标判断趋势和逆转,加入止盈止损机制控制风险,可以自动识别买卖点并及时止损止盈。该策略也存在一定的风险,主要可通过参数优化等方法进行改进。总体而言,该策略具有较强的实用性。
||
The strategy is named RSI Bollinger Bands TP/SL Strategy. It combines the RSI indicator and Bollinger Bands to identify trends and trading signals. When the RSI indicator shows overbought or oversold signals and the price touches or breaks through the Bollinger Bands, long or short positions will be opened. Besides, take profit and stop loss points are also set to control risks.
The RSI indicator judges whether a stock is overbought or oversold. An RSI reading above the overbought line indicates overbought conditions, while a reading below the oversold line indicates oversold conditions. The overbought line is set at 50 and the oversold line is set at 50 in this strategy.
Bollinger Bands plot standard deviation lines above and below a simple moving average. The upper band acts as resistance and the lower band acts as support. An up-crossing of the lower band is a buy signal, while a down-crossing of the upper band is a sell signal.
When the RSI indicator shows a bottom reversal signal and the price breaks through the lower band of Bollinger Bands, it is regarded as an upward reversal, thus going long. When the RSI indicator shows a top reversal signal and the price breaks down the upper band, it is regarded as a downward reversal, thus going short.
The RSI and Bollinger Bands are both used to determine trends and reversals. The combination improves signal recognition accuracy and avoids false breakouts.
The strategy sets take profit (TP) and stop loss (SL) points to lock in profits and maximize loss mitigation.
Users can go long only, short only or both directions based on market conditions, allowing flexible risk control.
The standard deviation size affects bands width and trading signals. Improper settings may generate excessive false signals.
V-shaped reversals can trigger unnecessary losses with TP/SL settings being too aggressive.
Wrong RSI parameter settings lead to decreased accuracy of reversal signals.
More RSI length values can be tested to find the optimal parameter combination.
More lengths and standard deviations can be tested to find the optimal parameter combination.
Backtesting can help find the optimal TP/SL ratio.
This strategy leverages RSI and Bollinger Bands to identify trends and reversals, and sets TP/SL to control risks. It can automatically detect trading signals and manage exits. There are still some risks that can be improved by parameter optimization. In general, this is a practical strategy with strong applicability.
[/trans]
Strategy Arguments
| Argument | Default | Description |
|---|---|---|
| v_input_1_close | 0 | Source: close |
| v_input_int_1 | 6 | RSI Length |
| v_input_int_2 | 50 | RSI OverSold |
| v_input_int_3 | 50 | RSI OverBought |
| v_input_int_4 | 200 | Bollinger Period Length |
| v_input_float_1 | 2 | Bollinger Bands Standard Deviation |
| v_input_float_2 | false | Take Profit: |
| v_input_float_3 | false | Stop Loss: |
| v_input_bool_1 | true | Long Entry |
| v_input_bool_2 | true | Short Entry |
| v_input_int_5 | true | From Day |
| v_input_int_6 | true | From Month |
| v_input_int_7 | 2021 | From Year |
| v_input_int_8 | 30 | To Day |
| v_input_int_9 | 12 | To Month |
| v_input_int_10 | 2042 | To Year |
Source (PineScript)
/*backtest
start: 2023-11-20 00:00:00
end: 2023-12-20 00:00:00
period: 1h
basePeriod: 15m
exchanges: [{"eid":"Futures_Binance","currency":"BTC_USDT"}]
*/

// This source code is subject to the terms of the Mozilla Public License 2.0 at https://mozilla.org/MPL/2.0/
// © BigCoinHunter

//@version=5
strategy(title="RSI_Boll-TP/SL", overlay=true,
     pyramiding=0, default_qty_type=strategy.percent_of_equity,
     default_qty_value=100, initial_capital=1000,
     currency=currency.USD, commission_value=0.05,
     commission_type=strategy.commission.percent,
     process_orders_on_close=true)

//----------- get the user inputs --------------

//---------- RSI -------------
price = input(close, title="Source")

RSIlength = input.int(defval=6,title="RSI Length")
RSIoverSold = input.int(defval=50, title="RSI OverSold", minval=1)
RSIoverBought = input.int(defval=50, title="RSI OverBought", minval=1)

//------- Bollinger Bands -----------
BBlength = input.int(defval=200, title="Bollinger Period Length", minval=1)
BBmult = input.float(defval=2.0, minval=0.001, maxval=50, step=0.1, title="Bollinger Bands Standard Deviation")
BBbasis = ta.sma(price, BBlength)
BBdev = BBmult * ta.stdev(price, BBlength)
BBupper = BBbasis + BBdev
BBlower = BBbasis - BBdev
source = close
buyEntry = ta.crossover(source, BBlower)
sellEntry = ta.crossunder(source, BBupper)
plot(BBbasis, color=color.aqua, title="Bollinger Bands SMA Basis Line")
p1 = plot(BBupper, color=color.silver, title="Bollinger Bands Upper Line")
p2 = plot(BBlower, color=color.silver, title="Bollinger Bands Lower Line")
fill(plot1=p1, plot2=p2, title="Bollinger BackGround", color=color.new(color.aqua,90), fillgaps=false, editable=true)

//---------- input TP/SL ---------------
tp = input.float(title="Take Profit:", defval=0.0, minval=0.0, maxval=100.0, step=0.1) * 0.01
sl = input.float(title="Stop Loss:  ", defval=0.0, minval=0.0, maxval=100.0, step=0.1) * 0.01

longEntry = input.bool(defval=true, title= 'Long Entry', inline="11")
shortEntry = input.bool(defval=true, title='Short Entry', inline="11")

//---------- backtest range setup ------------
fromDay   = input.int(defval = 1, title = "From Day", minval = 1, maxval = 31)
fromMonth = input.int(defval = 1, title = "From Month", minval = 1, maxval = 12)
fromYear  = input.int(defval = 2021, title = "From Year", minval = 2010)
toDay     = input.int(defval = 30, title = "To Day", minval = 1, maxval = 31)
toMonth   = input.int(defval = 12, title = "To Month", minval = 1, maxval = 12)
toYear    = input.int(defval = 2042, title = "To Year", minval = 2010)

//------------ time interval setup -----------
start     = timestamp(fromYear, fromMonth, fromDay, 00, 00)  // backtest start window
finish    = timestamp(toYear, toMonth, toDay, 23, 59)        // backtest finish window
window()  => time >= start and time <= finish ? true : false // create function "within window of time"

//------- define the global variables ------
var bool long = true
var bool stoppedOutLong = false
var bool stoppedOutShort = false
//--------- Colors ---------------

TrendColor = RSIoverBought and (price[1] > BBupper and price < BBupper) and BBbasis < BBbasis[1] ? color.red : RSIoverSold and (price[1] < BBlower and price > BBlower) and BBbasis > BBbasis[1] ? color.green : na
//bgcolor(switch2?(color.new(TrendColor,50)):na)


//--------- calculate the input/output points -----------
longProfitPrice  = strategy.position_avg_price * (1 + tp)     // tp -> take profit percentage
longStopPrice = strategy.position_avg_price * (1 - sl)        // sl -> stop loss percentage

shortProfitPrice  = strategy.position_avg_price * (1 - tp)
shortStopPrice = strategy.position_avg_price * (1 + sl)


//---------- RSI + Bollinger Bands Strategy -------------
vrsi = ta.rsi(price, RSIlength)

rsiCrossOver = ta.crossover(vrsi, RSIoverSold)
rsiCrossUnder = ta.crossunder(vrsi, RSIoverBought)

BBCrossOver = ta.crossover(source, BBlower)
BBCrossUnder = ta.crossunder(source, BBupper)

if (not na(vrsi))

    if rsiCrossOver and BBCrossOver
        long := true

    if rsiCrossUnder and BBCrossUnder
        long := false

//------------------- determine buy and sell points ---------------------
buySignall = window() and long  and (not stoppedOutLong)
sellSignall = window() and (not long)  and (not stoppedOutShort)

//---------- execute the strategy -----------------
if(longEntry and shortEntry)
    if long
        strategy.entry("LONG", strategy.long, when = buySignall, comment = "ENTER LONG")
        stoppedOutLong := true
        stoppedOutShort := false
    else
        strategy.entry("SHORT", strategy.short, when = sellSignall, comment = "ENTER SHORT")
        stoppedOutLong  := false
        stoppedOutShort := true

else if(longEntry)
    strategy.entry("LONG", strategy.long,  when = buySignall)
    strategy.close("LONG", when = sellSignall)
    if long
        stoppedOutLong := true
    else
        stoppedOutLong  := false

else if(shortEntry)
    strategy.entry("SHORT", strategy.short, when = sellSignall)
    strategy.close("SHORT", when = buySignall)
    if not long
        stoppedOutShort := true
    else
        stoppedOutShort := false


//----------------- take profit and stop loss -----------------
if(tp>0.0 and sl>0.0)
    if ( strategy.position_size > 0 )
        strategy.exit(id="LONG", limit=longProfitPrice, stop=longStopPrice, comment="Long TP/SL Trigger")

    else if ( strategy.position_size < 0 )
        strategy.exit(id="SHORT", limit=shortProfitPrice, stop=shortStopPrice, comment="Short TP/SL Trigger")

else if(tp>0.0)
    if ( strategy.position_size > 0 )
        strategy.exit(id="LONG", limit=longProfitPrice, comment="Long TP Trigger")

    else if ( strategy.position_size < 0 )
        strategy.exit(id="SHORT", limit=shortProfitPrice, comment="Short TP Trigger")

else if(sl>0.0)
    if ( strategy.position_size > 0 )
        strategy.exit(id="LONG",  stop=longStopPrice, comment="Long SL Trigger")

    else if ( strategy.position_size < 0 )
        strategy.exit(id="SHORT",  stop=shortStopPrice, comment="Short SL Trigger")
Detail
https://www.fmz.com/strategy/436097
Last Modified
2023-12-21 11:17:19