Name
RSI指标改进交易策略RSI-Indicator-Improvement-Trading-Strategy
Author
ChaoZhang
Strategy Description
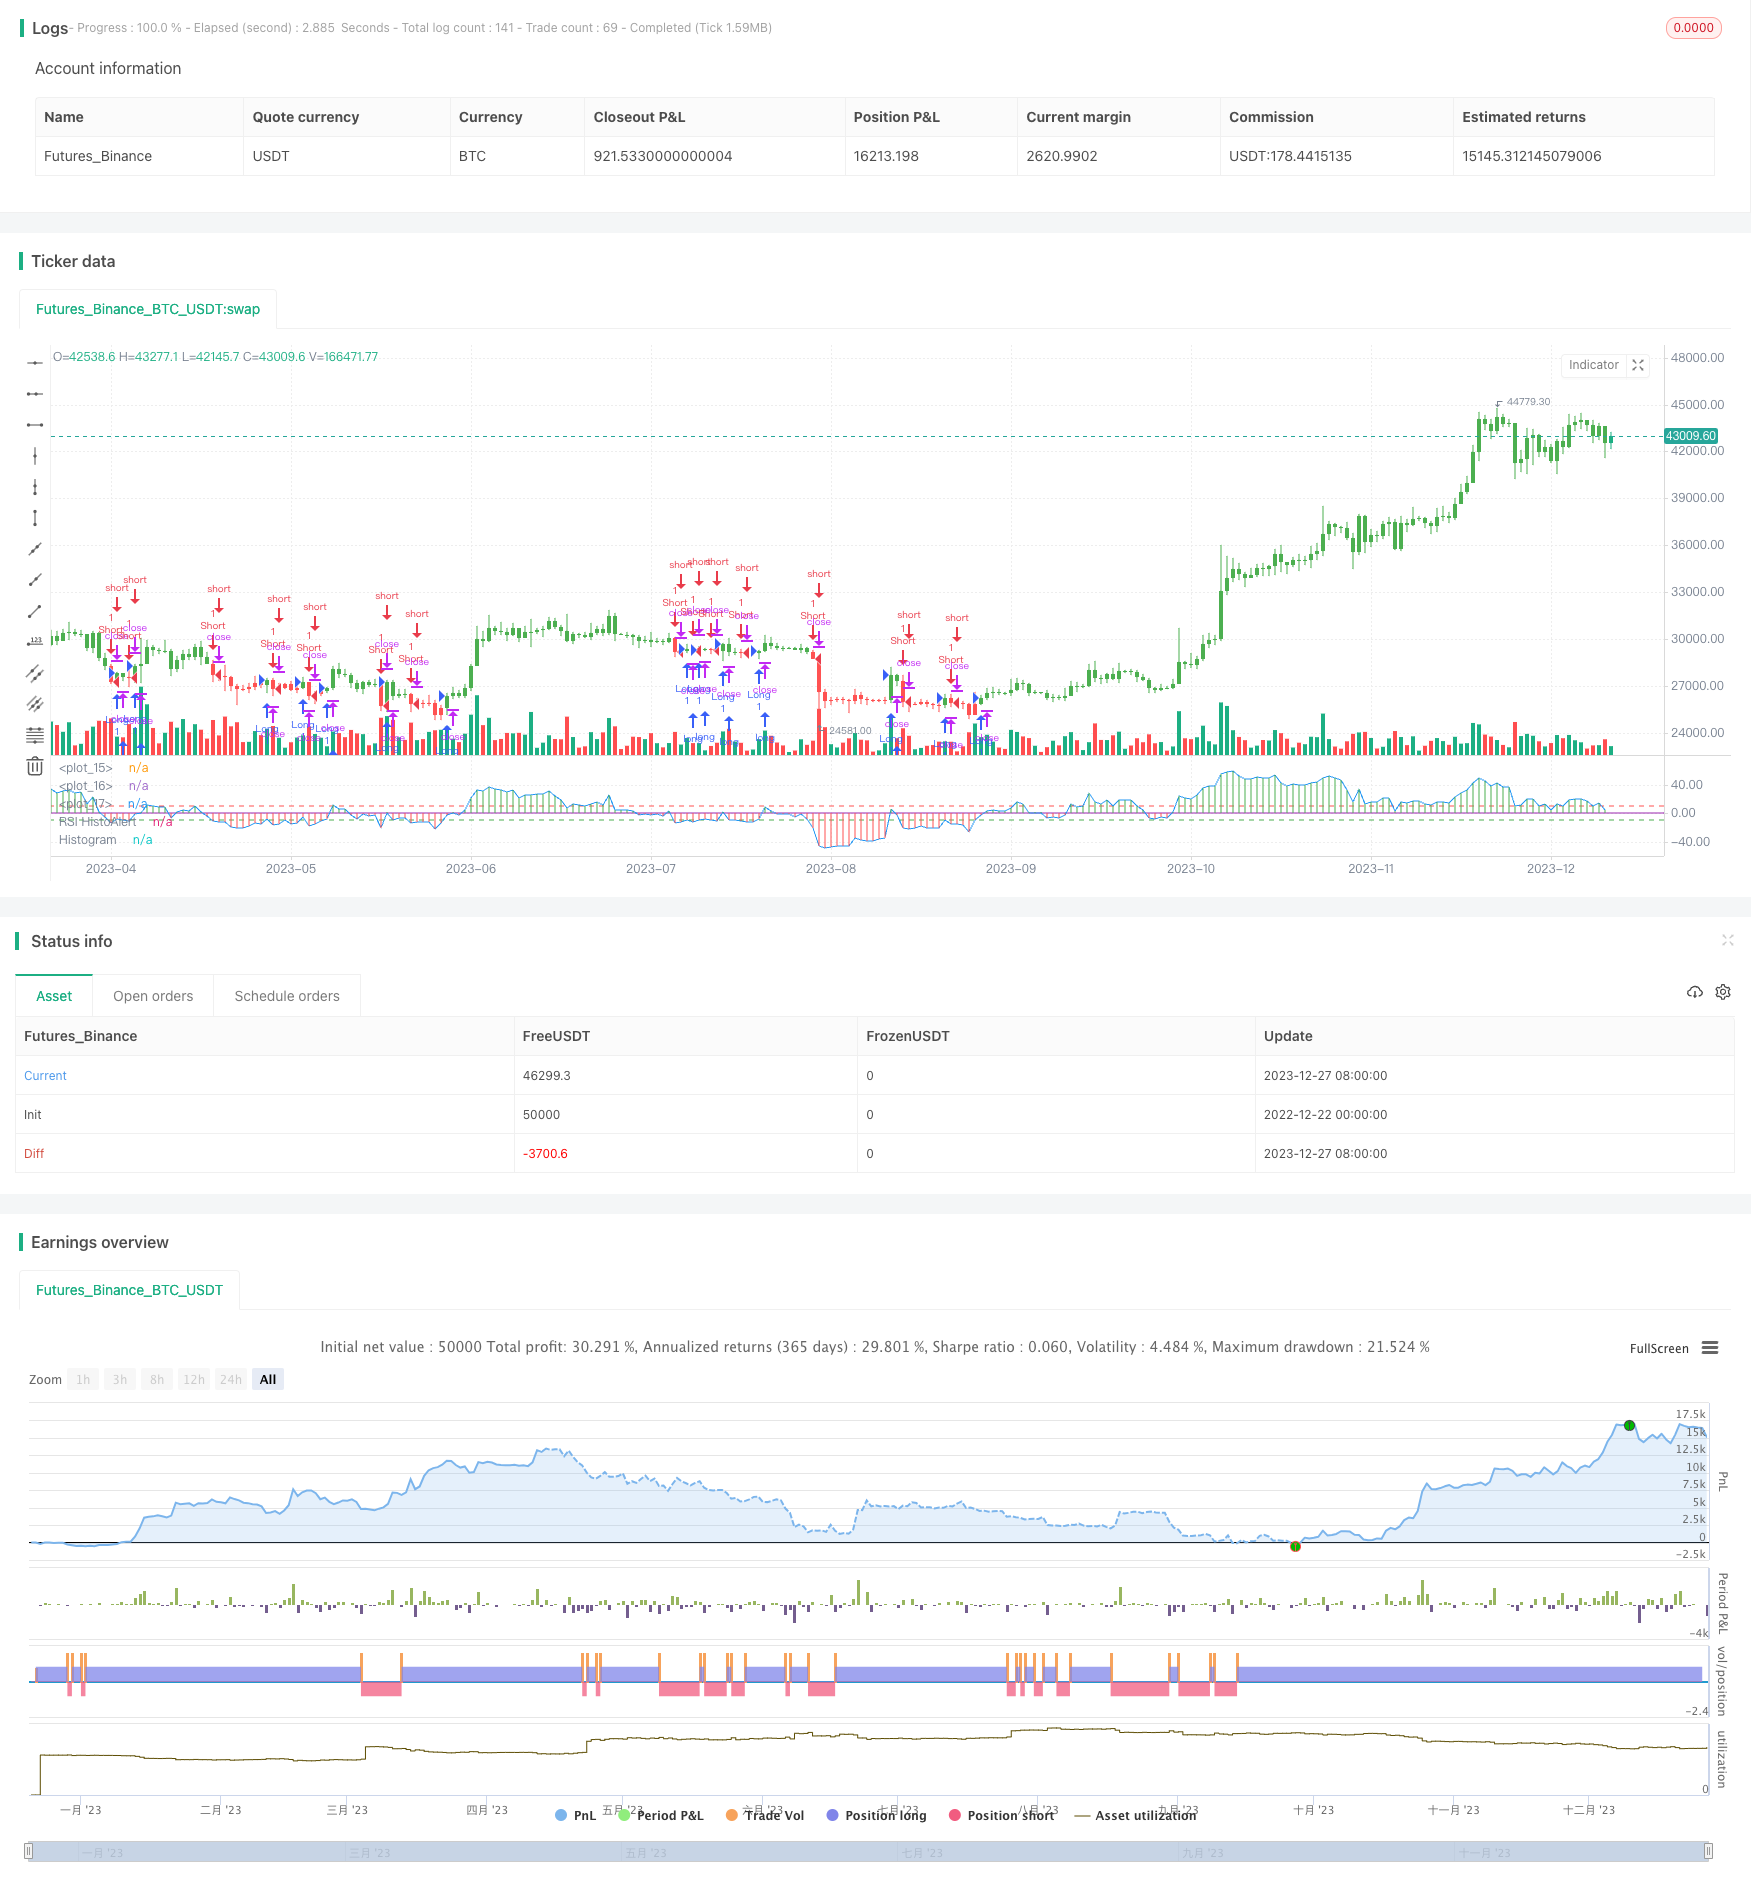
本策略对经典的RSI指标进行了改进,设置买入和卖出的警戒线,当RSI指标突破警戒线时,进行相应的买入或者卖出操作。同时,该策略还提供长短仓切换功能。
该策略通过RSI指标的Histogram实现买卖信号的触发。
(1)计算RSI指标的值,公式为:
RSIMain = (rsi(xPrice, RSIPeriod) - 50) * RSIHistoModify
其中,xPrice为价格序列,RSIPeriod为计算RSI的参数,RSIHistoModify为RSI的值的一个缩放系数。
(2)设置买入警戒线BuyAlertLevel和卖出警戒线SellAlertLevel。当RSI指标高于买入警戒线时为买入信号,低于卖出警戒线时为卖出信号。
(3)绘制RSI指标的Histogram,可视化买卖信号。
(4)设置仓位pos,当触发信号时,将pos设置为1(做多)或-1(做空)。并可以选择正向交易或反向交易。
(5)根据pos的值判断入场方向和价格。
(1)改进了RSI指标的使用方式,更清晰的展示买卖信号。
(2)可自定义参数,对RSI指标和警戒线进行调整,适应不同市场。
(3)直观的展示买卖信号的 Histogram。
(4)可选择正向交易或反向交易。
(5)策略思路简单清晰,容易理解和修改。
(1)容易产生错误信号,RSI指标本身就容易形成错误信号。
(2)未考虑止损,可能存在较大亏损的风险。
(3)参数设置不当也会导致失败。
(1)结合其他指标过滤信号,避免错误信号。例如考虑成交量的突破。
(2)设置止损机制。
(3)参数优化,找到最优参数。
(4)可以考虑与机器学习相结合,利用算法自动寻找最优参数。
本策略通过改进RSI指标的使用方式,设置买卖警戒线,更清楚直观的表达买卖信号。相比原始RSI指标有更强的实用性。但也存在一定的风险,需要进一步优化改进,结合其他技术指标和止损来降低风险。该策略思路简单,适合量化交易的初学者学习和实践。
||
This strategy improves the classic RSI indicator by setting buy and sell alert lines. When the RSI indicator breaks through the alert lines, corresponding buy or sell operations are performed. At the same time, the strategy also provides long and short position switching capability.
This strategy triggers buy and sell signals through the RSI indicator's Histogram.
(1) Calculate the value of the RSI indicator:
RSIMain = (rsi(xPrice, RSIPeriod) - 50) * RSIHistoModify
where xPrice is the price series, RSIPeriod is the parameter for calculating RSI, and RSIHistoModify is a scaling factor for the RSI value.
(2) Set the buy alert line BuyAlertLevel and the sell alert line SellAlertLevel. When the RSI indicator is above the buy alert line, it is a buy signal. When it is below the sell alert line, it is a sell signal.
(3) Plot the Histogram of the RSI indicator to visualize buy and sell signals.
(4) Set position pos. When a signal is triggered, set pos to 1 (long) or -1 (short). Positive or reverse trading can be selected.
(5) Determine entry direction and price based on the value of pos.
(1) Improves the way the RSI indicator is used and more clearly shows buy and sell signals.
(2) Customizable parameters to adjust the RSI indicator and alert lines to suit different markets.
(3) Intuitive display of buy and sell signals Histogram.
(4) Ability to choose positive or reverse trading.
(5) The strategy idea is simple and clear, easy to understand and modify.
(1) Prone to generating false signals. The RSI indicator itself tends to generate false signals.
(2) No consideration of stop loss, with the risk of huge losses.
(3) Improper parameter settings can also lead to failure.
(1) Combine with other indicators to filter out false signals, e.g. considering trading volume breakouts.
(2) Set up stop loss mechanisms.
(3) Parameter optimization to find optimum parameters.
(4) Consider combining with machine learning to automatically find optimal parameters using algorithms.
This strategy expresses buy and sell signals more clearly and intuitively by improving the use of the RSI indicator and setting buy and sell alert lines. It has stronger practicality compared to the original RSI indicator. But there are also certain risks. Further optimizations are needed, e.g. combining other technical indicators and stop loss to reduce risks. The strategy idea is simple, suitable for beginners in quantitative trading to learn and practice.
[/trans]
Strategy Arguments
| Argument | Default | Description |
|---|---|---|
| v_input_1 | 13 | RSIPeriod |
| v_input_2 | -10 | BuyAlertLevel |
| v_input_3 | 10 | SellAlertLevel |
| v_input_4 | 1.5 | RSIHistoModify |
| v_input_5 | false | Trade reverse |
Source (PineScript)
/*backtest
start: 2022-12-22 00:00:00
end: 2023-12-28 00:00:00
period: 1d
basePeriod: 1h
exchanges: [{"eid":"Futures_Binance","currency":"BTC_USDT"}]
*/

//@version=2
////////////////////////////////////////////////////////////
//  Copyright by HPotter v1.0 22/12/2016
// This simple indicator modified RSI
// You can use in the xPrice any series: Open, High, Low, Close, HL2, HLC3, OHLC4 and ect...
// You can change long to short in the Input Settings
// Please, use it only for learning or paper trading. Do not for real trading.
////////////////////////////////////////////////////////////
strategy(title="RSI HistoAlert Strategy")
RSIPeriod = input(13, minval=1)
BuyAlertLevel = input(-10)
SellAlertLevel = input(10)
RSIHistoModify = input(1.5)
reverse = input(false, title="Trade reverse")
hline(0, color=purple, linestyle=line)
hline(BuyAlertLevel, color=green)
hline(SellAlertLevel, color=red)
xPrice = close
RSIMain = (rsi(xPrice, RSIPeriod) - 50) * RSIHistoModify
rsiHcolor =  iff(RSIMain >= 0 , green,
              iff(RSIMain < 0, red, black))
pos = iff(RSIMain > BuyAlertLevel, 1,
	     iff(RSIMain < SellAlertLevel, -1, nz(pos[1], 0)))
possig = iff(reverse and pos == 1, -1,
          iff(reverse and pos == -1, 1, pos))
if (possig == 1)
    strategy.entry("Long", strategy.long)
if (possig == -1)
    strategy.entry("Short", strategy.short)
barcolor(possig == -1 ? red: possig == 1 ? green : blue )
plot(RSIMain, color=blue, title="RSI HistoAlert")
plot(RSIMain, color=rsiHcolor, title="Histogram", style = histogram, linewidth  = 1)
Detail
https://www.fmz.com/strategy/437029
Last Modified
2023-12-29 16:23:48
