Name
MyQuant趋势识别策略MyQuant-Trend-Identifier-Strategy
Author
ChaoZhang
Strategy Description
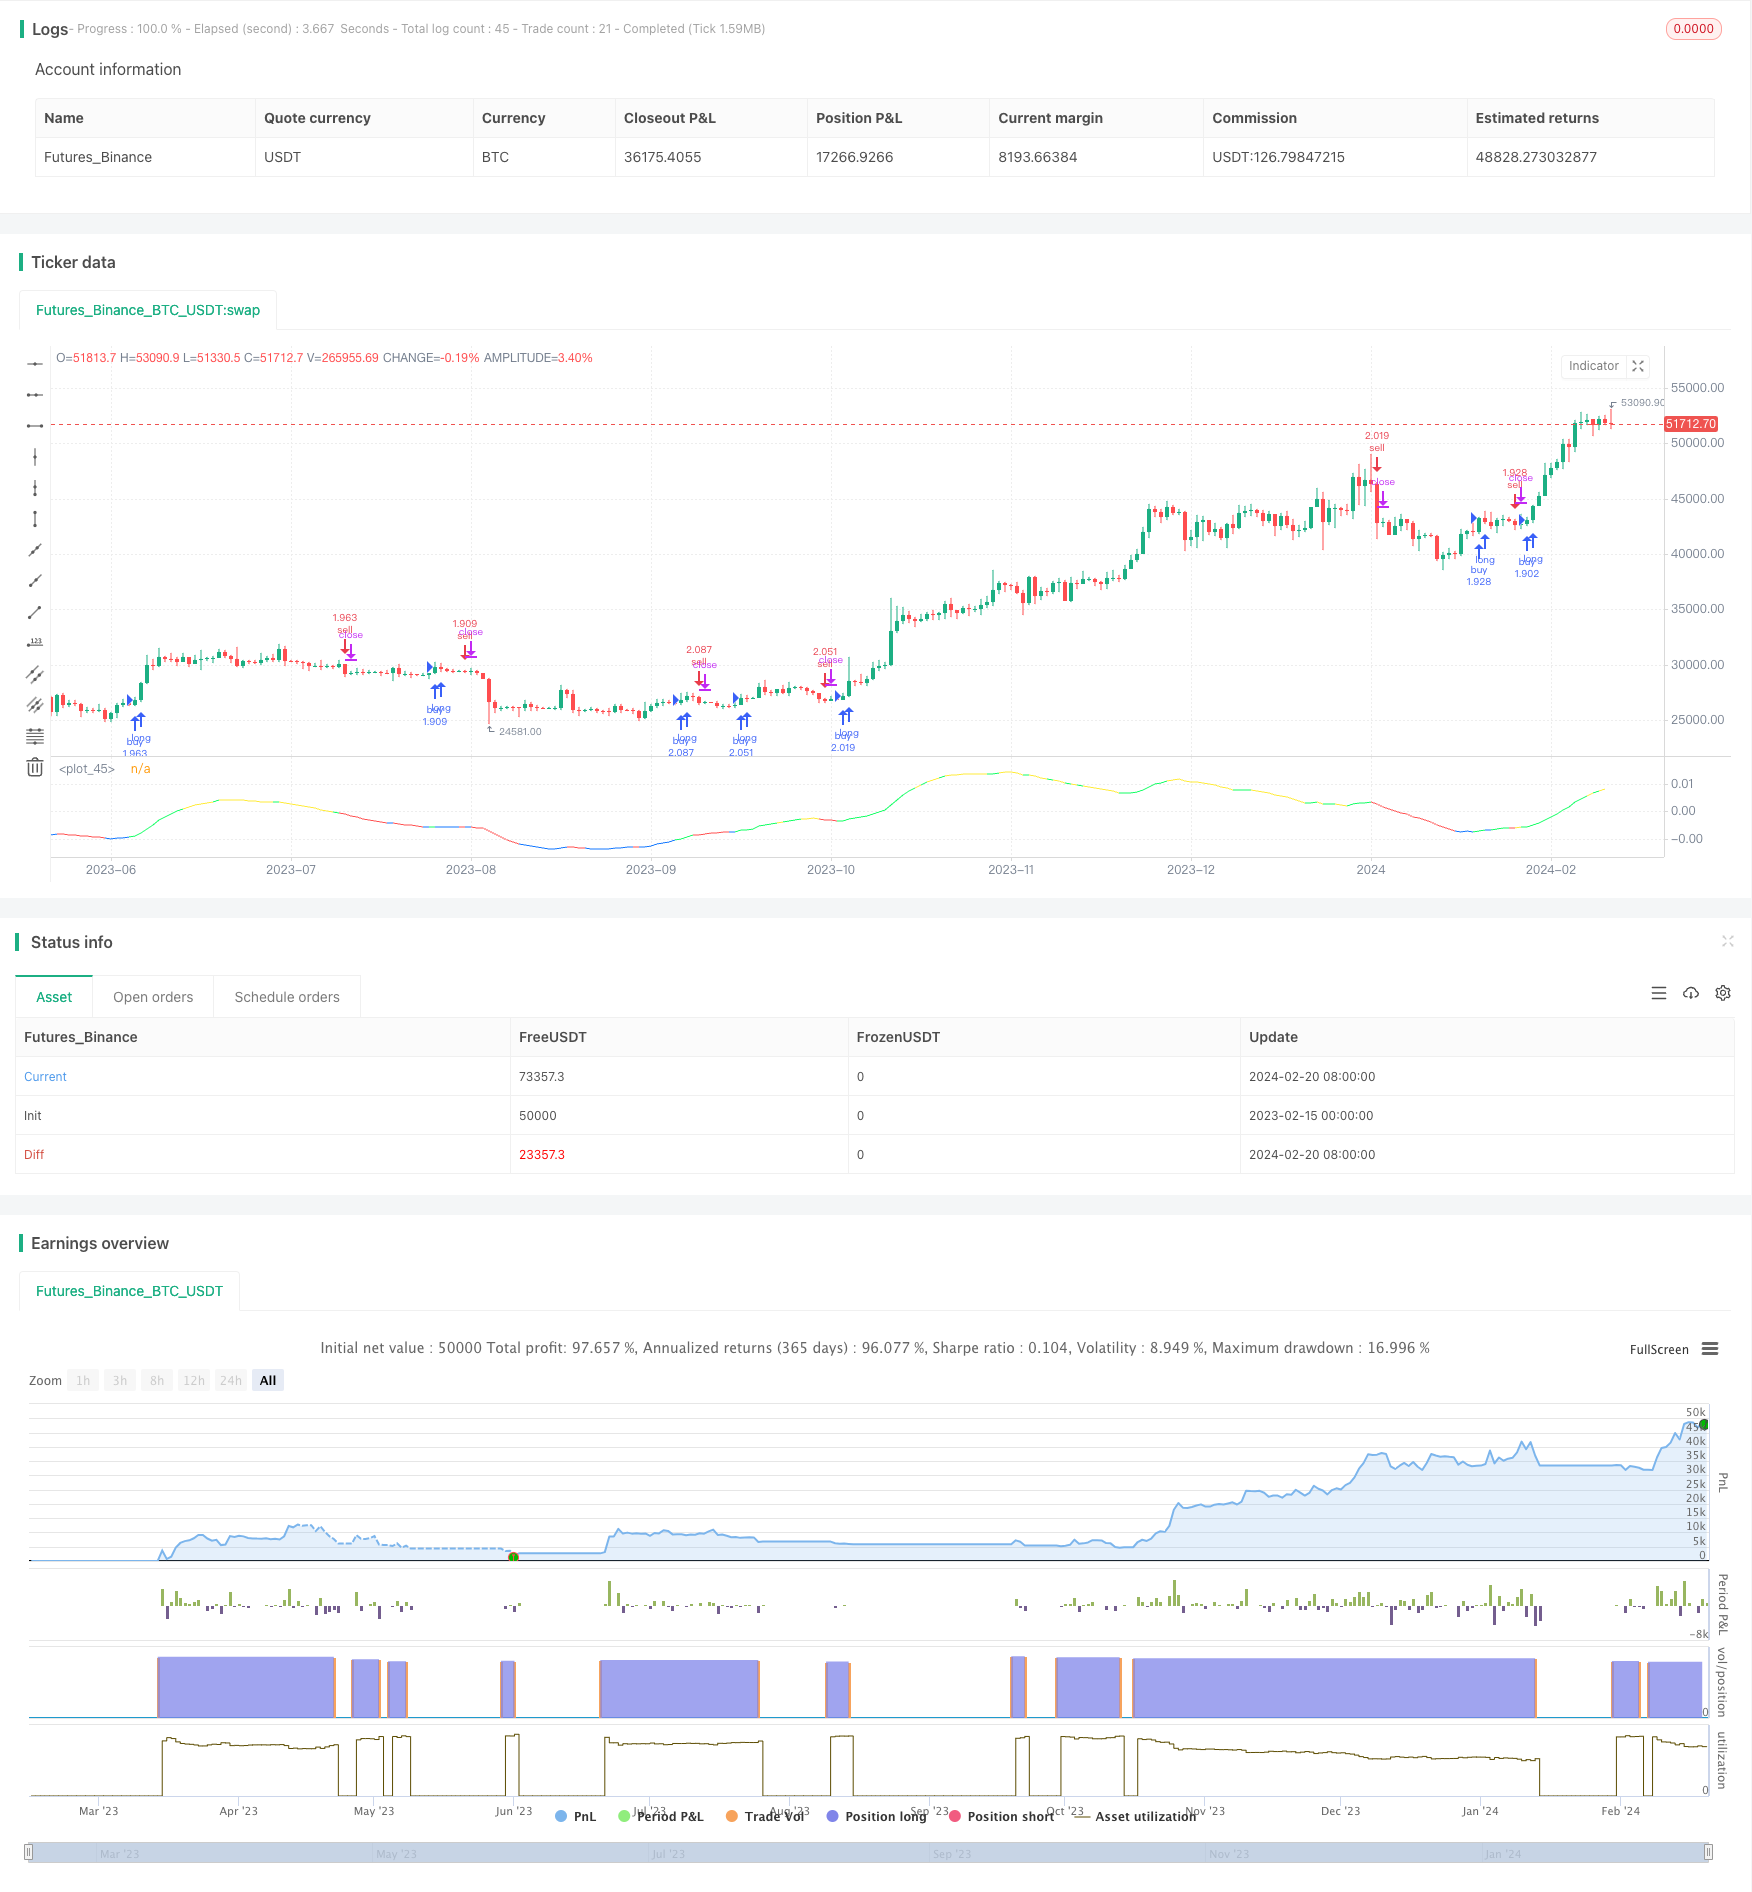
MyQuant趋势识别策略是一个用于比特币每日交易的策略。该策略通过计算价格的移动平均线及其一阶和二阶导数来识别市场趋势,并据此制定买入卖出决策。
该策略首先计算价格的自适应移动平均线(ALMA)及其一阶导数和二阶导数。一阶导数反映价格变化速度,二阶导数反映价格曲率。根据一阶和二阶导数值判断目前处于上升趋势、下降趋势或震荡期。再结合股票指标,判断是否达到买入卖出条件。
具体来说,策略计算以下指标:
- ALMA:价格的自适应移动平均线,长度为140,快速因子为1.1, sigma 为6
- dema: ALMA的一阶导数
- d2ema: dema的一阶导数,反映价格二阶导数
- index: dema指标的震荡指数
- ind: 价格离均线的偏离度指数
在买入条件满足时,根据 CAUSED.Accumulation/Distribution Bands 和Caused Exposure Top and Bottom Finder信号计算买入股数。在卖出条件满足时,卖出全部头寸。
该策略结合趋势和指标判断,能够有效识别市场趋势转折点。使用价格的一阶和二阶导数判断趋势,避免受价格震荡的影响,使信号更加清晰。相比常见移动平均线策略,具有判断准确率更高等优势。
该策略对交易时间段的选择以及参数调整非常敏感。如果时间段选择不当,未能涵盖重要的价格转折点,会导致策略效果不佳。如果指标参数设置不当,则买入卖出信号会受到更多噪声的影响,从而影响策略收益。此外,策略预设的止损条件也会影响最终收益。
可从以下几个方面进一步优化该策略:
- 优化时间段选择逻辑,通过更加智能地选择回测和实盘交易时间段。
- 优化指标参数,如调整 ALMA 和 dema 的长度等参数。
- 增加止损条件判断,以控制最大损失。
- 评估不同加密货币的效果,挑选出表现最好的品种。
MyQuant趋势识别策略通过对价格的自适应移动平均线进行一阶和二阶导数计算,有效识别了比特币的市场趋势,并做出相应买入卖出决策。该策略结合多种指标进行判断,避免信号被过度噪声干扰。通过进一步的时间和参数优化,该策略效果还可得到提升。
||
MyQuant Trend Identifier Strategy is a strategy for daily Bitcoin trading. It identifies market trends by calculating the moving average and its first and second order derivatives of the price, and makes buy and sell decisions accordingly.
The strategy first calculates the Adaptive Moving Average (ALMA) of the price and its first order and second order derivatives. The first order derivative reflects the rate of change of the price, and the second order derivative reflects the curvature of the price. It then judges the current trend to be upward, downward or fluctuating based on the values of the first and second order derivatives. Combined with stock indicators, it determines whether the buy or sell conditions are met.
Specifically, the strategy calculates the following indicators:
- ALMA: Adaptive Moving Average of the price, length 140, fast factor 1.1, sigma 6
- dema: First order derivative of ALMA
- d2ema: First order derivative of dema, reflecting second order derivative of the price
- index: Oscillation index of the dema indicator
- ind: Deviation index of the price from its moving average
When the buy condition is met, it calculates the number of shares to buy based on the signals from CAUSED Accumulation/Distribution Bands and Caused Exposure Top and Bottom Finder. When the sell condition is met, it sells all current positions.
By combining trend and indicator judgments, this strategy can effectively identify turning points in market trends. Using the first and second order derivatives of prices to determine trends avoids the impact of price fluctuations and makes signals clearer. Compared to common moving average strategies, it has advantages such as higher accuracy.
This strategy is very sensitive to the selection of the trading time period and parameter adjustments. If the time period is selected improperly and important price turning points are not covered, the strategy will not be very effective. If the indicator parameters are set improperly, the buy and sell signals will be more affected by noise, thus impacting strategy returns. In addition, the stop loss conditions preset in the strategy also affect final returns.
The strategy can be further optimized in the following aspects:
- Optimize logic for selecting time periods, through smarter selection of backtest and live trading time periods.
- Optimize indicator parameters, such as adjusting length of ALMA and dema etc.
- Add stop loss condition judgments to control maximum losses.
- Evaluate the effects across different cryptocurrencies and pick the ones that perform the best.
By calculating the first and second order derivatives of the adaptive moving average of prices, the MyQuant Trend Identifier Strategy effectively identifies the market trends for Bitcoin and makes corresponding buy and sell decisions. By combining multiple indicators for judgment, it avoids excessive noise interference with the signals. With further optimization of time and parameters, the performance of this strategy can be further improved.
[/trans]
Strategy Arguments
| Argument | Default | Description |
|---|---|---|
| v_input_int_1 | 2020 | start year |
| v_input_int_2 | true | start month |
| v_input_int_3 | true | start day |
| v_input_int_4 | 2025 | end year |
| v_input_int_5 | true | end month |
| v_input_int_6 | true | end day |
| v_input_1 | false | Choose Time Interval |
Source (PineScript)
/*backtest
start: 2023-02-15 00:00:00
end: 2024-02-21 00:00:00
period: 1d
basePeriod: 1h
exchanges: [{"eid":"Futures_Binance","currency":"BTC_USDT"}]
*/

// This source code is subject to the terms of the Mozilla Public License 2.0 at https://mozilla.org/MPL/2.0/
// © spacekadet17
//
//@version=5

strategy(title="Trend Identifier Strategy", shorttitle="Trend Identifier Strategy", format=format.price, precision=4, overlay = false, initial_capital = 1000, pyramiding = 10, default_qty_type = strategy.percent_of_equity, default_qty_value = 100, commission_type = strategy.commission.percent, commission_value = 0.03)

//start-end time
startyear = input.int(2020,"start year")
startmonth = input.int(1,"start month")
startday = input.int(1,"start day")
endyear = input.int(2025,"end year")
endmonth = input.int(1,"end month")
endday = input.int(1,"end day")

timeEnd = time <= timestamp(syminfo.timezone,endyear,endmonth,endday,0,0)
timeStart = time >= timestamp(syminfo.timezone,startyear,startmonth,startday,0,0)
choosetime = input(false,"Choose Time Interval")
condTime = (choosetime ? (timeStart and timeEnd) : true)

// time frame?
tfc = 1
if timeframe.isdaily
    tfc := 24

// indicators: price normalized alma, and its 1st and 2nd derivatives
ema = ta.alma(close,140,1.1,6)
dema = (ema-ema[1])/ema
stodema = ta.ema(ta.ema(ta.stoch(dema,dema,dema,100),3),3)

d2ema = ta.ema(dema-dema[1],5)
stod2ema = ta.ema(ta.ema(ta.stoch(d2ema,d2ema,d2ema,100),3),3)

ind = (close-ta.ema(close,120*24/tfc))/close
heat = ta.ema(ta.stoch(ind,ind,ind,120*24/tfc),3)
index = ta.ema(heat,7*24/tfc)

//plot graph
green = color.rgb(20,255,100)
yellow = color.yellow
red = color.red
blue = color.rgb(20,120,255)
tcolor = (dema>0) and (d2ema>0)? green : (dema>0) and (d2ema<0) ? yellow : (dema < 0) and (d2ema<0) ? red : (dema < 0) and (d2ema>0) ? blue : color.black
demaema = ta.ema(dema,21)
plot(demaema, color = tcolor)

//strategy buy-sell conditions
cond1a = strategy.position_size <= 0
cond1b = strategy.position_size > 0

if (condTime and cond1a and ( ( ((tcolor[1] == red and demaema<0.02) or (tcolor[1] == blue and demaema < 0.02) or (tcolor[1] == yellow and demaema>-0.02) ) and tcolor == green) or (tcolor[1] == red and tcolor == blue and demaema < -0.01) ) and index<85 and ind<0.4)
    strategy.entry("buy",strategy.long, (strategy.equity-strategy.position_size*close)/1/close)

if (condTime and cond1b and ( (((tcolor[1] == yellow and demaema > -0.02) or (tcolor[1] == blue and demaema < 0.02) or (tcolor[1] == green and demaema < 0.02)) and tcolor == red) or (tcolor[1] == green and tcolor == yellow and demaema > 0.015) ) and index>15 and ind>-0.1)
    strategy.order("sell",strategy.short, strategy.position_size)
Detail
https://www.fmz.com/strategy/442527
Last Modified
2024-02-22 16:04:04