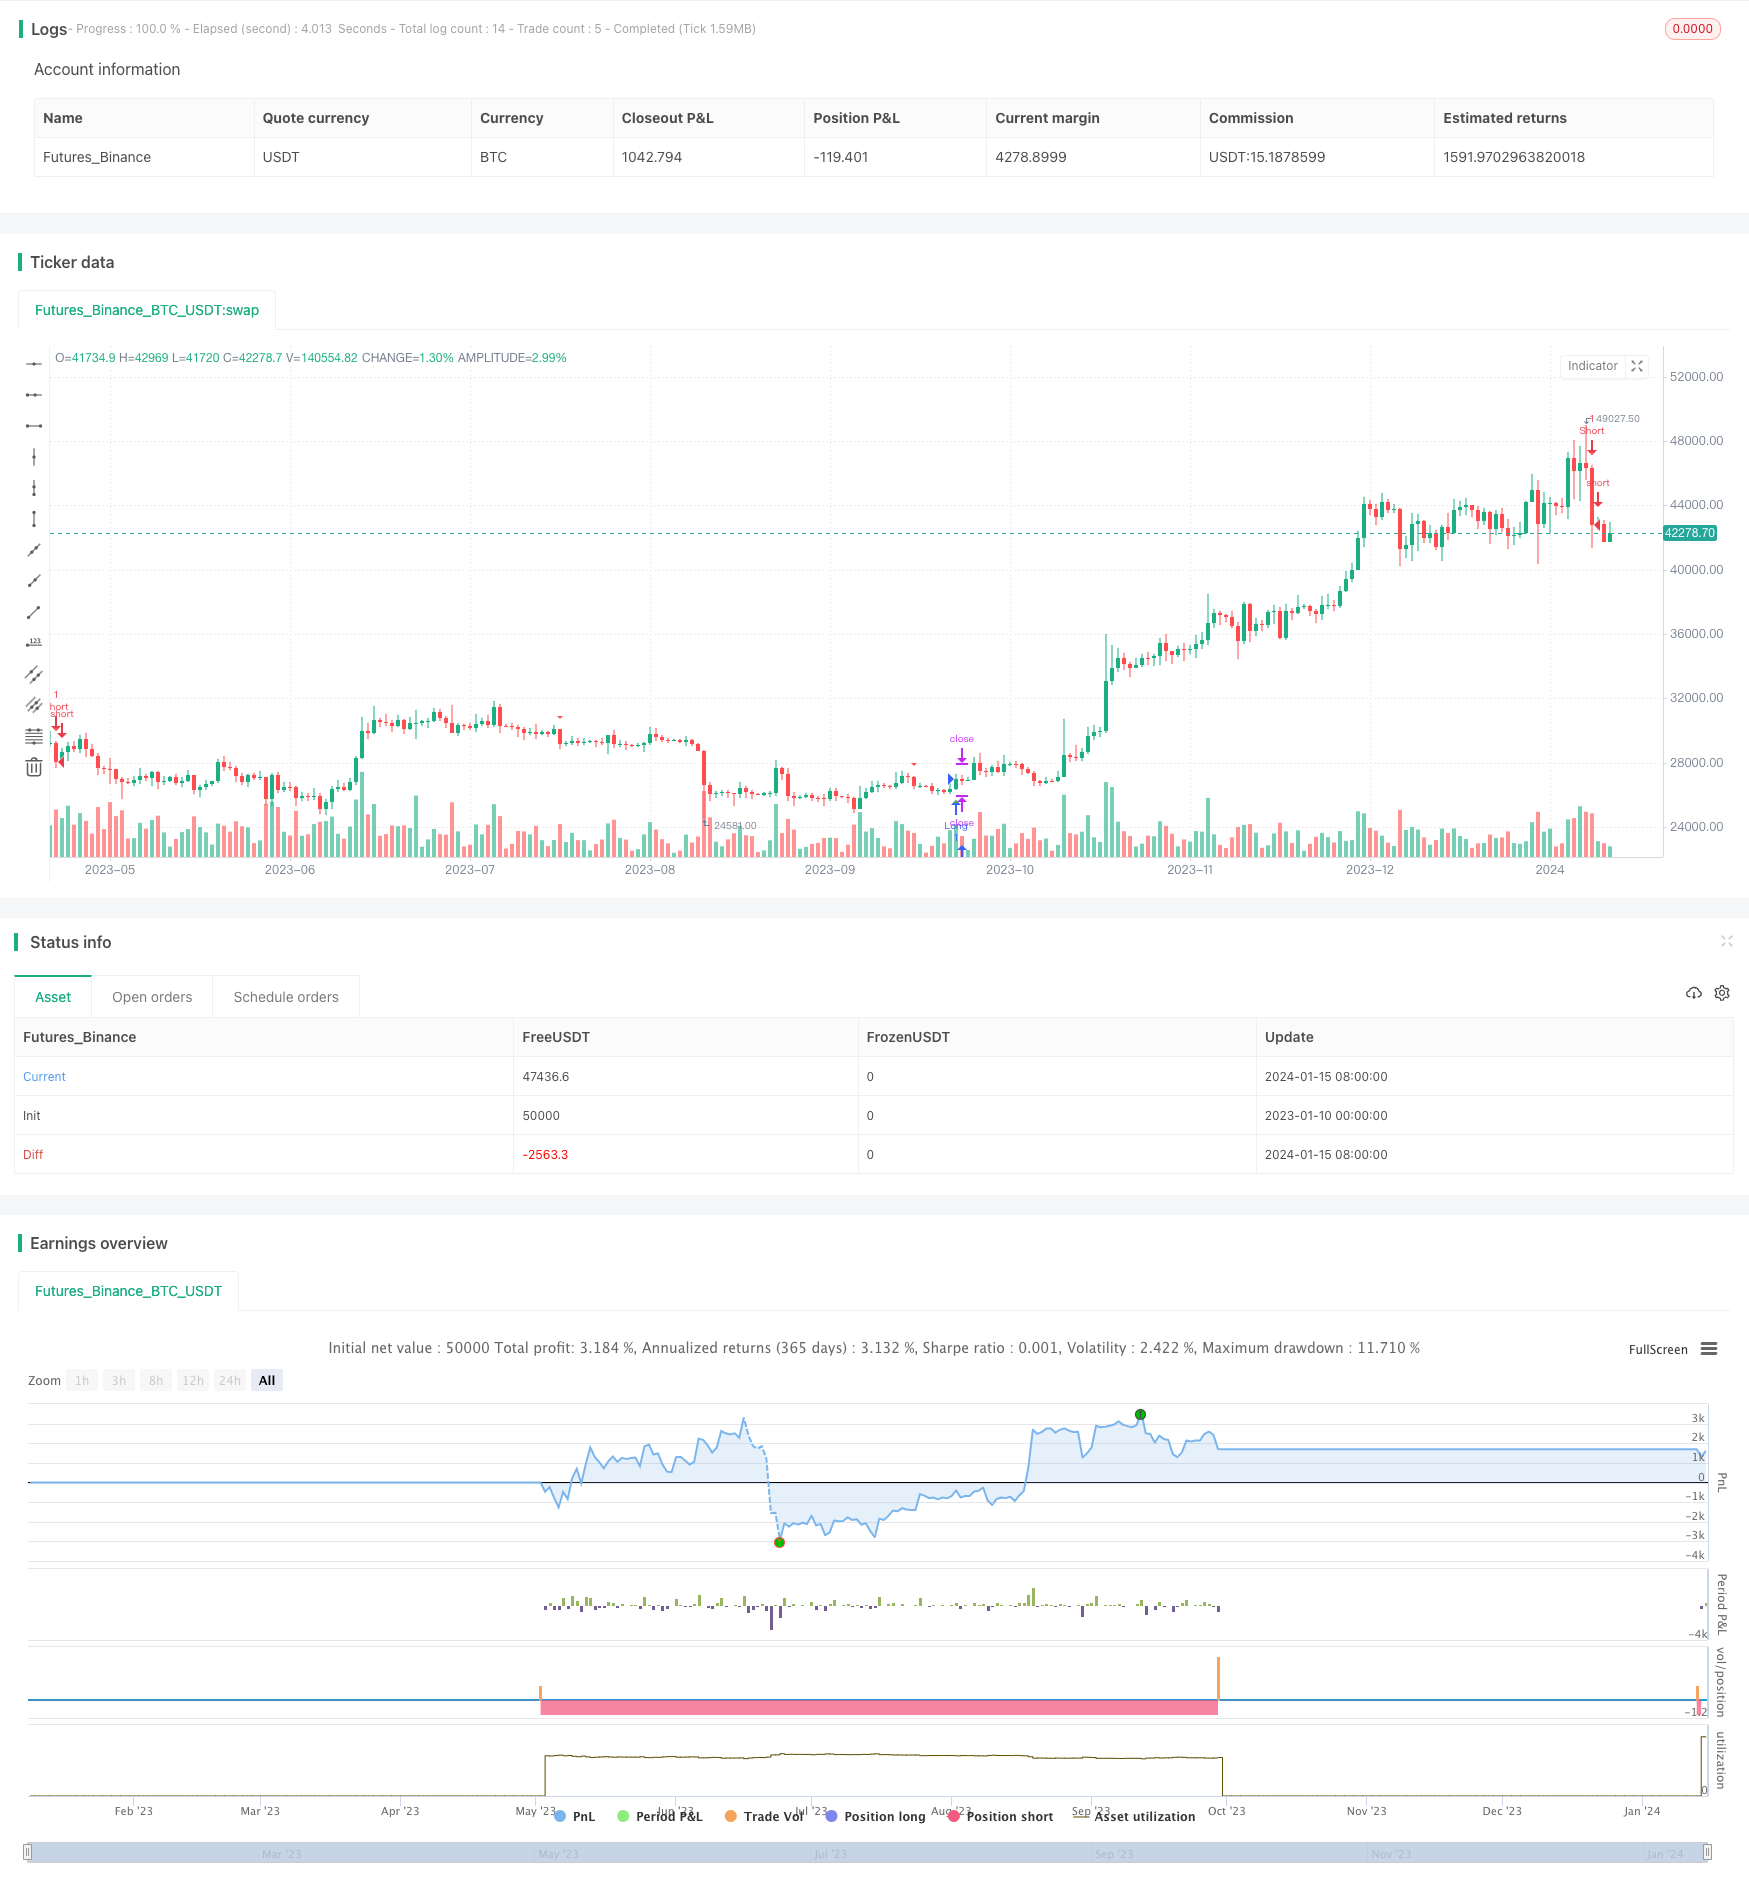
Name
Dual-SMA-Momentum-Strategy双SMA动量策略
Author
ChaoZhang
Strategy Description
[trans]
The Dual SMA Momentum strategy is a technical analysis based trading strategy that generates buy and sell signals based on two simple moving average (SMA) indicators. It aims to capture short- to medium-term price momentum in a stock.
The strategy uses two SMA indicators with short and long time windows - a fast SMA (length 9 periods) and a slow SMA (length 45 periods).
It generates a long/buy signal when the stock's closing price crosses above both the fast and slow SMA lines, indicating the start of an uptrend. The strategy enters long positions here.
It generates a short/sell signal when the price crosses below both SMA lines, indicating the start of a downtrend. The strategy enters short positions here.
The stop loss levels are set dynamically at the previous day's high (for short trades) and previous day's low (for long trades).
The main advantages of this strategy are:
- Uses a combination of short and long term SMAs to capture emerging mid-term trends
- Adaptive stop loss placement reduces risk and lets profits run
- Easy to understand and implement
- Performs well across stocks and markets during trending conditions
However, like all technical analysis strategies, it can underperform during range-bound and whipsaw markets with frequent false signals. An enhancement could be to add other indicators like RSI for additional confirmation.
The main risks of this strategy are:
-
Prone to whipsaws and false signals: Since it relies solely on SMA crossovers, the strategy can face whipsaws and false signals during sideways or choppy markets, creating unnecessary trading costs. This can be mitigated by combining with other indicators like RSI.
-
Vulnerable to sudden trend reversals: Swift reversals after SMA crossover entries can hit stop loss levels quickly before a trend forms. This risk can be reduced by optimizing SMA lengths or adding other filters.
-
Overoptimization risk from parameter tweaking: Extensive optimization of the SMA lengths and other parameters to curve fit historical data can lead to poor performance in live trading. Robust backtesting over long time frames is essential.
Some ways in which this strategy can be enhanced are:
-
Adding other indicators like RSI for additional trade confirmation to improve timing and accuracy of signals
-
Incorporating dynamic stop loss placement methods like ATR or chandelier exits to better adapt to market volatility
-
Optimizing SMA lengths based on historical volatility and trading time frames for different stocks
-
Adding sound money management and position sizing rules to maximize returns and limit drawdowns
In summary, the Dual SMA Momentum strategy offers a straightforward approach to trade short- to medium-term trends. While basic in its approach, refinements like additional filters, dynamic stops and prudent optimizations can aid in improving its risk-adjusted returns. Used selectively during stock uptrends and downtrends, it can capture profitable moves.
||
双SMA动量策略是一种基于技术分析的交易策略,它根据两个简单移动平均线(SMA)指标生成买入和卖出信号。它旨在捕捉股票的短期至中期价格动量。
该策略使用两个SMA指标,即短期和长期时间窗口 - 快速SMA(长度为9个周期)和慢速SMA(长度为45个周期)。
当股票的收盘价格突破快速SMA和慢速SMA的均线时,表示开始出现上升趋势,该策略在此时生成多头/买入信号并进入多头头寸。
当价格跌破两条SMA均线时,表示开始出现下降趋势,该策略在此时生成空头/卖出信号并进入空头头寸。
止损水平动态设置为前一日的最高点(对空头交易)和前一日的最低点(对多头交易)。
该策略的主要优势有:
- 结合使用短期和长期SMA以捕捉新出现的中期趋势
- 自适应止损位安置可降低风险并让利润继续运行
- 易于理解和实施
- 在趋势性行情中表现突出
但是,与所有技术分析策略一样,在震荡行情中信号频繁错误。可通过添加其他指标如RSI进行确证以改进。
该策略的主要风险有:
-
易受震荡和错误信号影响:仅依赖于SMA交叉,在盘整或震荡行情中可能出现任性信号,带来不必要的交易成本。这可以通过与RSI等其他指标组合来缓解。
-
vulnerable to sudden trend reversals: 入市后快速反转可能迅速击穿止损位。可以通过优化SMA长度或添加其他过滤器来降低这种风险。
-
参数优化过度拟合风险: 对SMA长度和其他参数的广泛优化可能导致实盘表现差。 需要在长时间范围内进行稳健的回测。
可以通过以下方式增强该策略:
- 添加RSI等其他指标进行额外确认以提高信号的准确性
- 使用ATR或悬空止损法等动态止损方法更好地适应市场波动
- 根据不同股票的历史波动性和交易时间范围优化SMA长度
- 添加合理的资金管理和仓位管理规则以最大化回报和限制回撤
综上所述,双SMA动量策略提供了直接捕捉短期至中期趋势的方法。 尽管它的方法很基本,但添加额外过滤器、动态止损和谨慎优化可以帮助改善其风险调整回报。在股票上涨和下跌趋势中有选择地使用,它可以捕捉到可盈利的行情。
[/trans]
Strategy Arguments
| Argument | Default | Description |
|---|---|---|
| v_input_1 | 9 | Fast SMA Length |
| v_input_2 | 45 | Slow SMA Length |
Source (PineScript)
/*backtest
start: 2023-01-10 00:00:00
end: 2024-01-16 00:00:00
period: 1d
basePeriod: 1h
exchanges: [{"eid":"Futures_Binance","currency":"BTC_USDT"}]
*/

//@version=5
strategy("SMA Crossover Strategy", overlay=true)

// Input parameters
fast_length = input(9, title="Fast SMA Length")
slow_length = input(45, title="Slow SMA Length")

// Calculate moving averages
fast_sma = ta.sma(close, fast_length)
slow_sma = ta.sma(close, slow_length)

// Buy condition
buy_condition = ta.crossover(close, fast_sma) and ta.crossover(close, slow_sma)

// Sell condition
sell_condition = ta.crossunder(close, fast_sma) and ta.crossunder(close, slow_sma)

// Calculate stop loss levels
prev_low = request.security(syminfo.tickerid, "1D", low[1], lookahead=barmerge.lookahead_on)
prev_high = request.security(syminfo.tickerid, "1D", high[1], lookahead=barmerge.lookahead_on)

// Plot signals on the chart
plotshape(buy_condition, style=shape.triangleup, location=location.belowbar, color=color.green, size=size.small)
plotshape(sell_condition, style=shape.triangledown, location=location.abovebar, color=color.red, size=size.small)

// Strategy exit conditions
long_stop_loss = sell_condition ? prev_low : na
short_stop_loss = buy_condition ? prev_high : na

strategy.exit("Long Exit", from_entry="Long", when=sell_condition, stop=long_stop_loss)
strategy.exit("Short Exit", from_entry="Short", when=buy_condition, stop=short_stop_loss)

strategy.entry("Long", strategy.long, when=buy_condition)
strategy.entry("Short", strategy.short, when=sell_condition)
Detail
https://www.fmz.com/strategy/439073
Last Modified
2024-01-17 15:05:08
