Name
震荡波动优异指标交易策略Bill-Williams-Awesome-Oscillator-Trading-Strategy
Author
ChaoZhang
Strategy Description
[trans]
震荡波动优异指标交易策略是基于比尔·威廉姆斯在其著作《新交易维度》中提出的建议而开发的量化交易策略。该策略运用快速移动平均线和慢速移动平均线的差值构建震荡指标,并以柱状图的形式展现,通过柱状图的颜色变化发出交易信号。
该策略的核心指标是震荡波动优异指标(Awesome Oscillator,AO),其计算公式为:
AO = SMA(Median Price, Fast Length) - SMA(Median Price, Slow Length)
其中,Median Price取高价和低价的平均值;Fast Length代表快速移动平均线的周期长度;Slow Length代表慢速移动平均线的周期长度。
AO指标通过快速和慢速移动平均线的差值,反映市场价格在不同时间尺度上的震荡情况。当快速移动平均线高于慢速移动平均线时,代表短期价格力量强于长期价格力量,为买入信号;当快速移动平均线低于慢速移动平均线时,代表短期价格力量弱于长期价格力量,为卖出信号。
该策略使用AO指标的当前值与上一周期的差值判断当前周期的多空状态,并在柱状图上用不同颜色标识:当前AO值大于上一周期时标blue色,代表适合买入;当前AO小于上一周期时标red色,代表适合卖出。
该策略具有以下优势:
- 使用移动平均线差值构建指标,平滑价格数据,有助过滤市场噪音;
- 快慢速均线的差值,捕捉市场不同时间尺度上的价格趋势变化;
- 柱状图直观显示多空状态,易于判断交易方向;
- 可自定义参数调整指标灵敏度,适应不同交易品种。
该策略也存在一定的风险:
- 参数设置不当可能导致交易信号频繁,造成过度交易;
- 震荡指标构建相对复杂,参数不当可能错过交易机会;
- pointed来源单一,可通过结合其他指标进行验证改进。
为降低上述风险,可优化参数设置,调整指标构建方式,并辅以其他指标进行验证。
该策略可从以下几个方面进行优化:
- 优化快速和慢速均线的长度参数,找到最佳参数组合;
- 尝试其他类型的移动平均线构建AO指标,如EMA、LWMA等;
- 结合趋势型指标和震荡型指标,提高指标效果;
- 增加止损机制以控制单笔损失。
综上所述,震荡波动优异指标交易策略利用快慢速移动平均线差值判断价格趋势变化,可有效发现短期逆转机会。该策略概念清晰、易于实施,通过参数优化和与其他指标结合,可望获得较好的交易效果。
||
The Bill Williams Awesome Oscillator trading strategy is a quantitative trading strategy developed based on the recommendations proposed by Bill Williams in his book “New Trading Dimensions”. The strategy uses the difference between fast and slow moving averages to construct an oscillator indicator and displays it as a histogram, generating trading signals through color changes of the histogram.
The core indicator of this strategy is the Awesome Oscillator (AO). Its formula is:
AO = SMA(Median Price, Fast Length) - SMA(Median Price, Slow Length)
Where Median Price takes the average of high and low prices; Fast Length represents the period of the fast moving average; Slow Length represents the period of the slow moving average.
The AO indicator reflects the oscillation of market prices at different time scales through the difference between fast and slow moving averages. When the fast moving average is higher than the slow one, it signals that short-term price momentum is stronger than long-term momentum and gives a buy signal. When the fast moving average is lower than the slow one, it signals that short-term price momentum is weaker than long-term momentum and gives a sell signal.
The strategy uses the difference between the current AO value and its previous period to determine the current period’s long/short stance. Different colors are used to identify them on the histogram: blue when current AO is greater than previous period, indicating suitable for long; red when current AO is less than previous period, indicating suitable for short.
The main advantages of this strategy include:
- Using the difference between moving averages to construct the indicator smooths price data and helps filter market noise;
- The difference between fast and slow moving averages captures price trend changes across different time horizons;
- The histogram visually presents long/short status for ease of judging trading direction;
- Customizable parameters to adjust indicator sensitivity catering to different trading instruments.
There are also some risks with this strategy:
- Improper parameter settings may result in frequent trading signals, leading to overtrading;
- The relatively complex construction of the AO indicator may lead to missing trading opportunities if parameters are not properly set;
- Signals come from a single source lacking verification from other indicators.
To mitigate the above risks, parameters can be optimized, indicator construction can be adjusted, and other indicators can be used for verification.
Some directions this strategy can be optimized on include:
- Optimize fast and slow moving average lengths to find the best parameter combination;
- Try different types of moving averages to construct the AO indicator, e.g. EMA, LWMA, etc;
- Incorporate trend-following and oscillating indicators to improve the AO;
- Add stop loss mechanisms to control losses per trade.
In conclusion, the Bill Williams Awesome Oscillator trading strategy effectively identifies short-term reversal opportunities by judging price trend changes using the difference between fast and slow moving averages. This strategy has a clear concept and is easy to implement. With parameter optimization and incorporation of other indicators, it has the potential to achieve good trading performance.
[/trans]
Strategy Arguments
| Argument | Default | Description |
|---|---|---|
| v_input_1 | 34 | Length Slow |
| v_input_2 | 5 | Length Fast |
| v_input_3 | false | Trade reverse |
Source (PineScript)
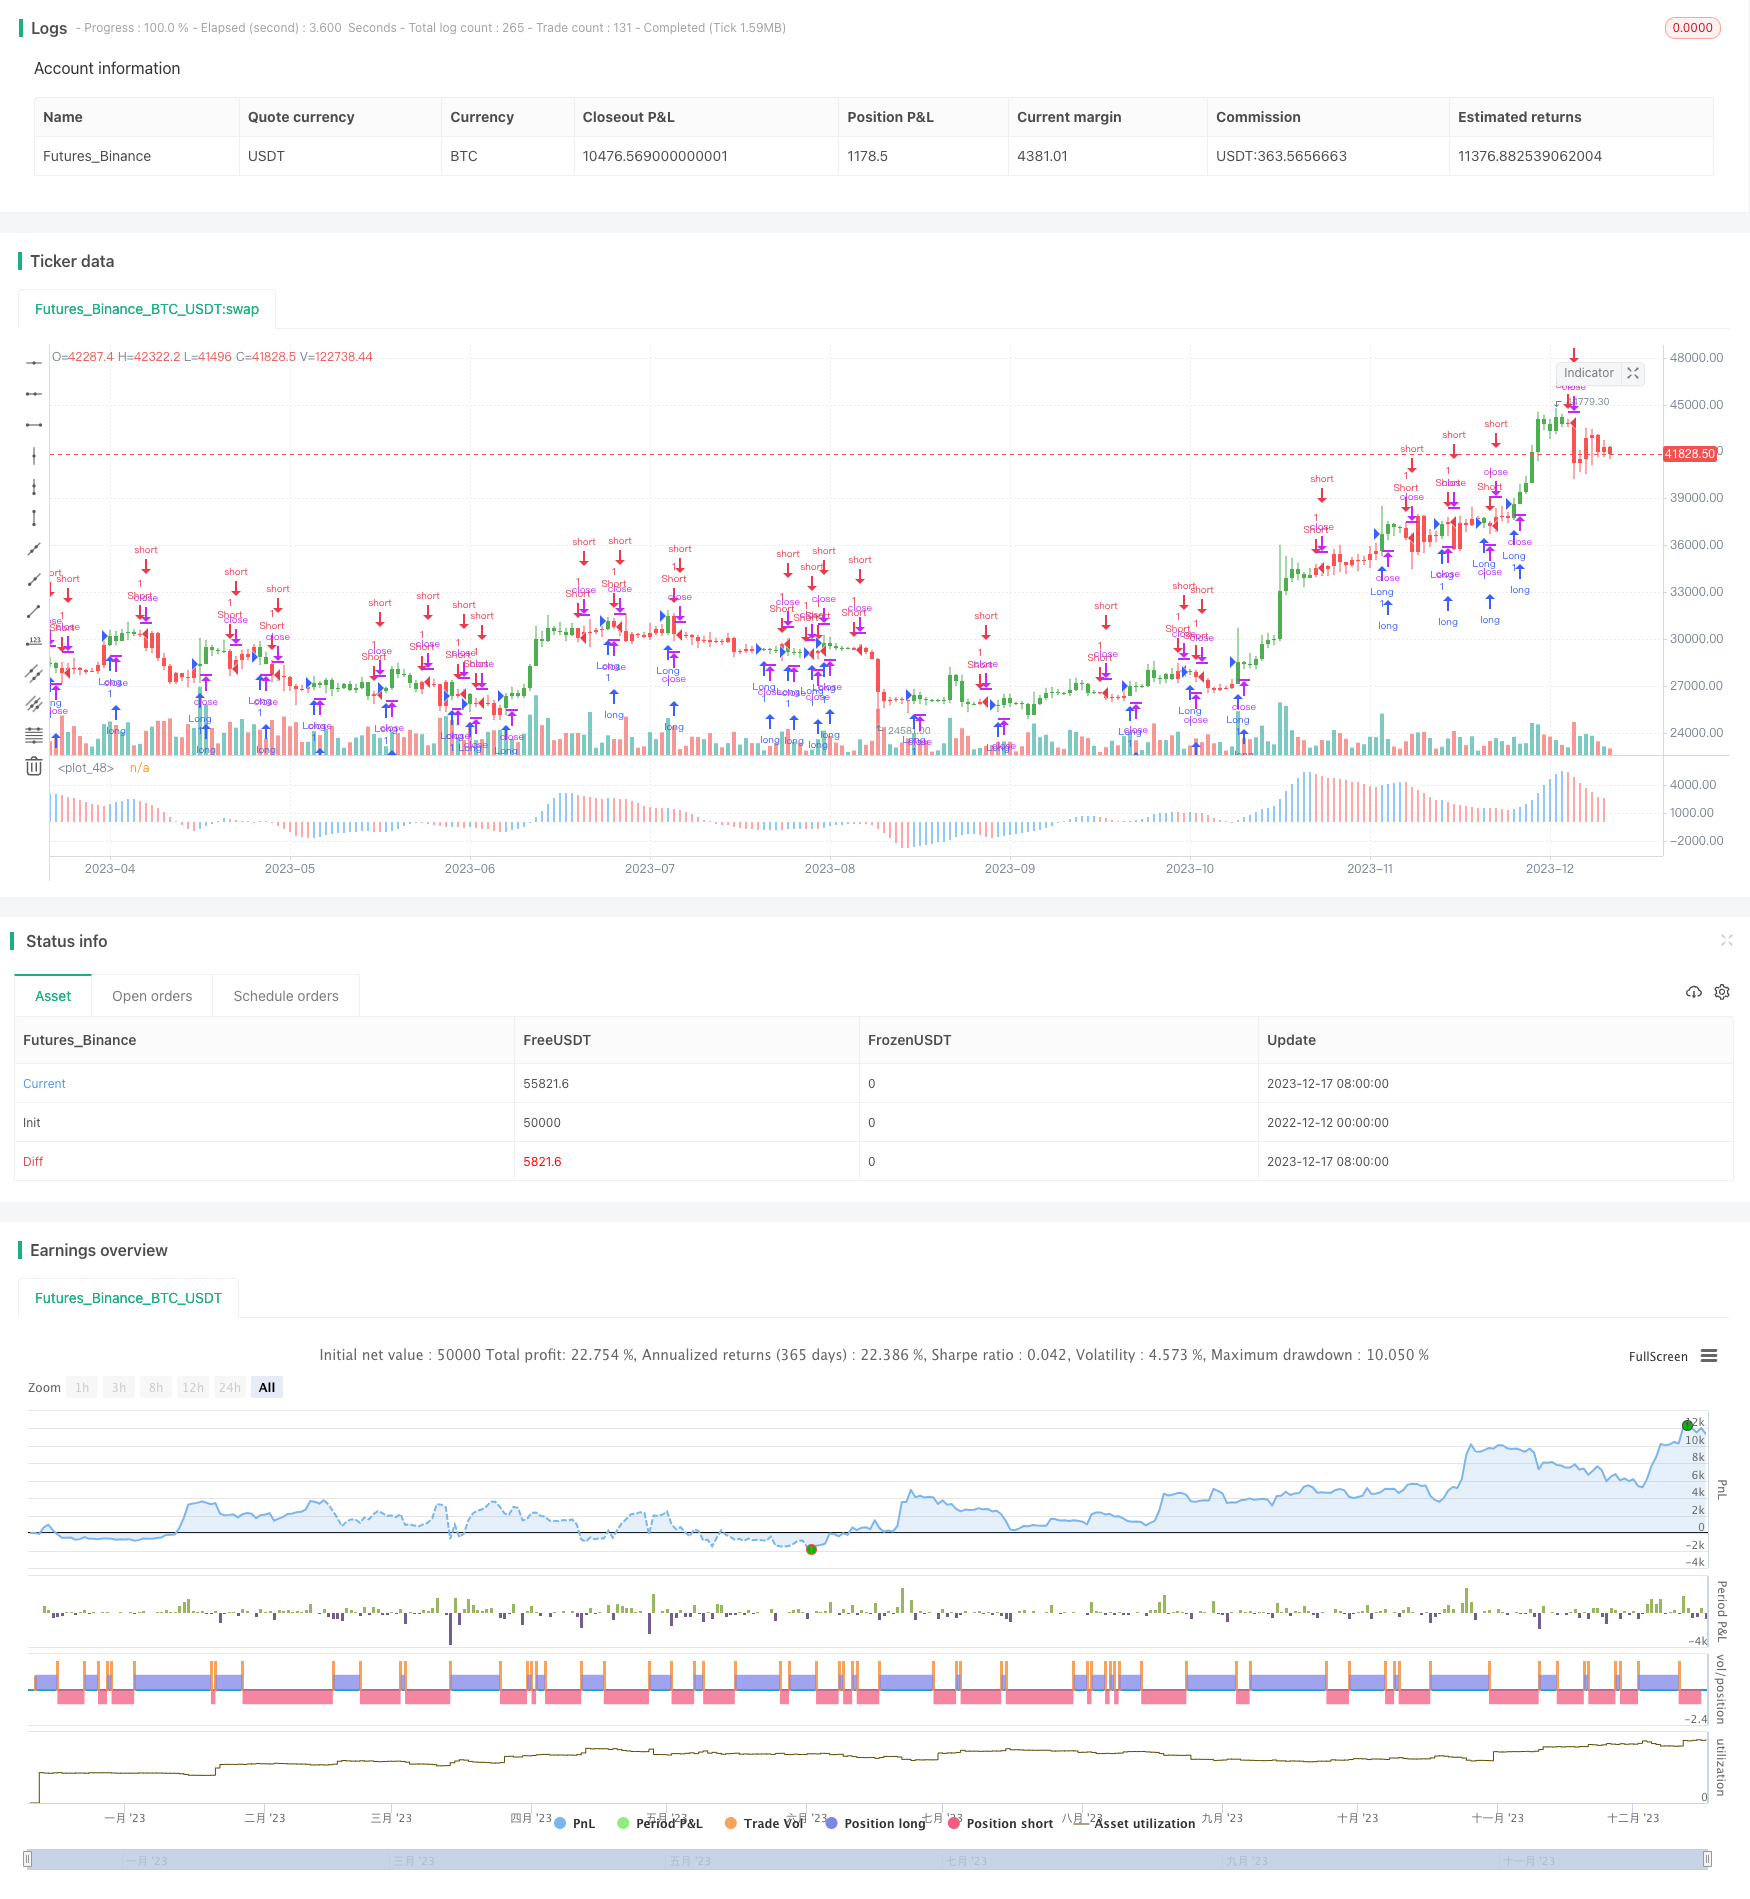
/*backtest
start: 2022-12-12 00:00:00
end: 2023-12-18 00:00:00
period: 1d
basePeriod: 1h
exchanges: [{"eid":"Futures_Binance","currency":"BTC_USDT"}]
*/

//@version=2
////////////////////////////////////////////////////////////
//  Copyright by HPotter v1.0 29/12/2016
//    This indicator is based on Bill Williams` recommendations from his book
//    "New Trading Dimensions". We recommend this book to you as most useful reading.
//    The wisdom, technical expertise, and skillful teaching style of Williams make
//    it a truly revolutionary-level source. A must-have new book for stock and
//    commodity traders.
//    The 1st 2 chapters are somewhat of ramble where the author describes the
//    "metaphysics" of trading. Still some good ideas are offered. The book references
//    chaos theory, and leaves it up to the reader to believe whether "supercomputers"
//    were used in formulating the various trading methods (the author wants to come across
//    as an applied mathemetician, but he sure looks like a stock trader). There isn't any
//    obvious connection with Chaos Theory - despite of the weak link between the title and
//    content, the trading methodologies do work. Most readers think the author's systems to
//    be a perfect filter and trigger for a short term trading system. He states a goal of
//    10%/month, but when these filters & axioms are correctly combined with a good momentum
//    system, much more is a probable result.
//    There's better written & more informative books out there for less money, but this author
//    does have the "Holy Grail" of stock trading. A set of filters, axioms, and methods which are
//    the "missing link" for any trading system which is based upon conventional indicators.
//    This indicator plots the oscillator as a histogram where periods fit for buying are marked
//    as blue, and periods fit for selling as red. If the current value of AC (Awesome Oscillator)
//    is over the previous, the period is deemed fit for buying and the indicator is marked blue.
//    If the AC values is not over the previous, the period is deemed fir for selling and the indicator
//    is marked red.
//
// You can change long to short in the Input Settings
// Please, use it only for learning or paper trading. Do not for real trading.
////////////////////////////////////////////////////////////
strategy("Bill Williams. Awesome Oscillator (AO)")
nLengthSlow = input(34, minval=1, title="Length Slow")
nLengthFast = input(5, minval=1, title="Length Fast")
reverse = input(false, title="Trade reverse")
xSMA1_hl2 = sma(hl2, nLengthFast)
xSMA2_hl2 = sma(hl2, nLengthSlow)
xSMA1_SMA2 = xSMA1_hl2 - xSMA2_hl2
cClr = xSMA1_SMA2 > xSMA1_SMA2[1] ? blue : red
pos = iff(xSMA1_SMA2 > xSMA1_SMA2[1], 1,
	   iff(xSMA1_SMA2 < xSMA1_SMA2[1], -1, nz(pos[1], 0)))
possig = iff(reverse and pos == 1, -1,
          iff(reverse and pos == -1, 1, pos))
if (possig == 1)
    strategy.entry("Long", strategy.long)
if (possig == -1)
    strategy.entry("Short", strategy.short)
barcolor(possig == -1 ? red: possig == 1 ? green : blue )
plot(xSMA1_SMA2, style=histogram, linewidth=1, color=cClr)
Detail
https://www.fmz.com/strategy/435888
Last Modified
2023-12-19 15:27:15