Name
量化追踪牛市策略Quant-Trend-Following-Strategy
Author
ChaoZhang
Strategy Description
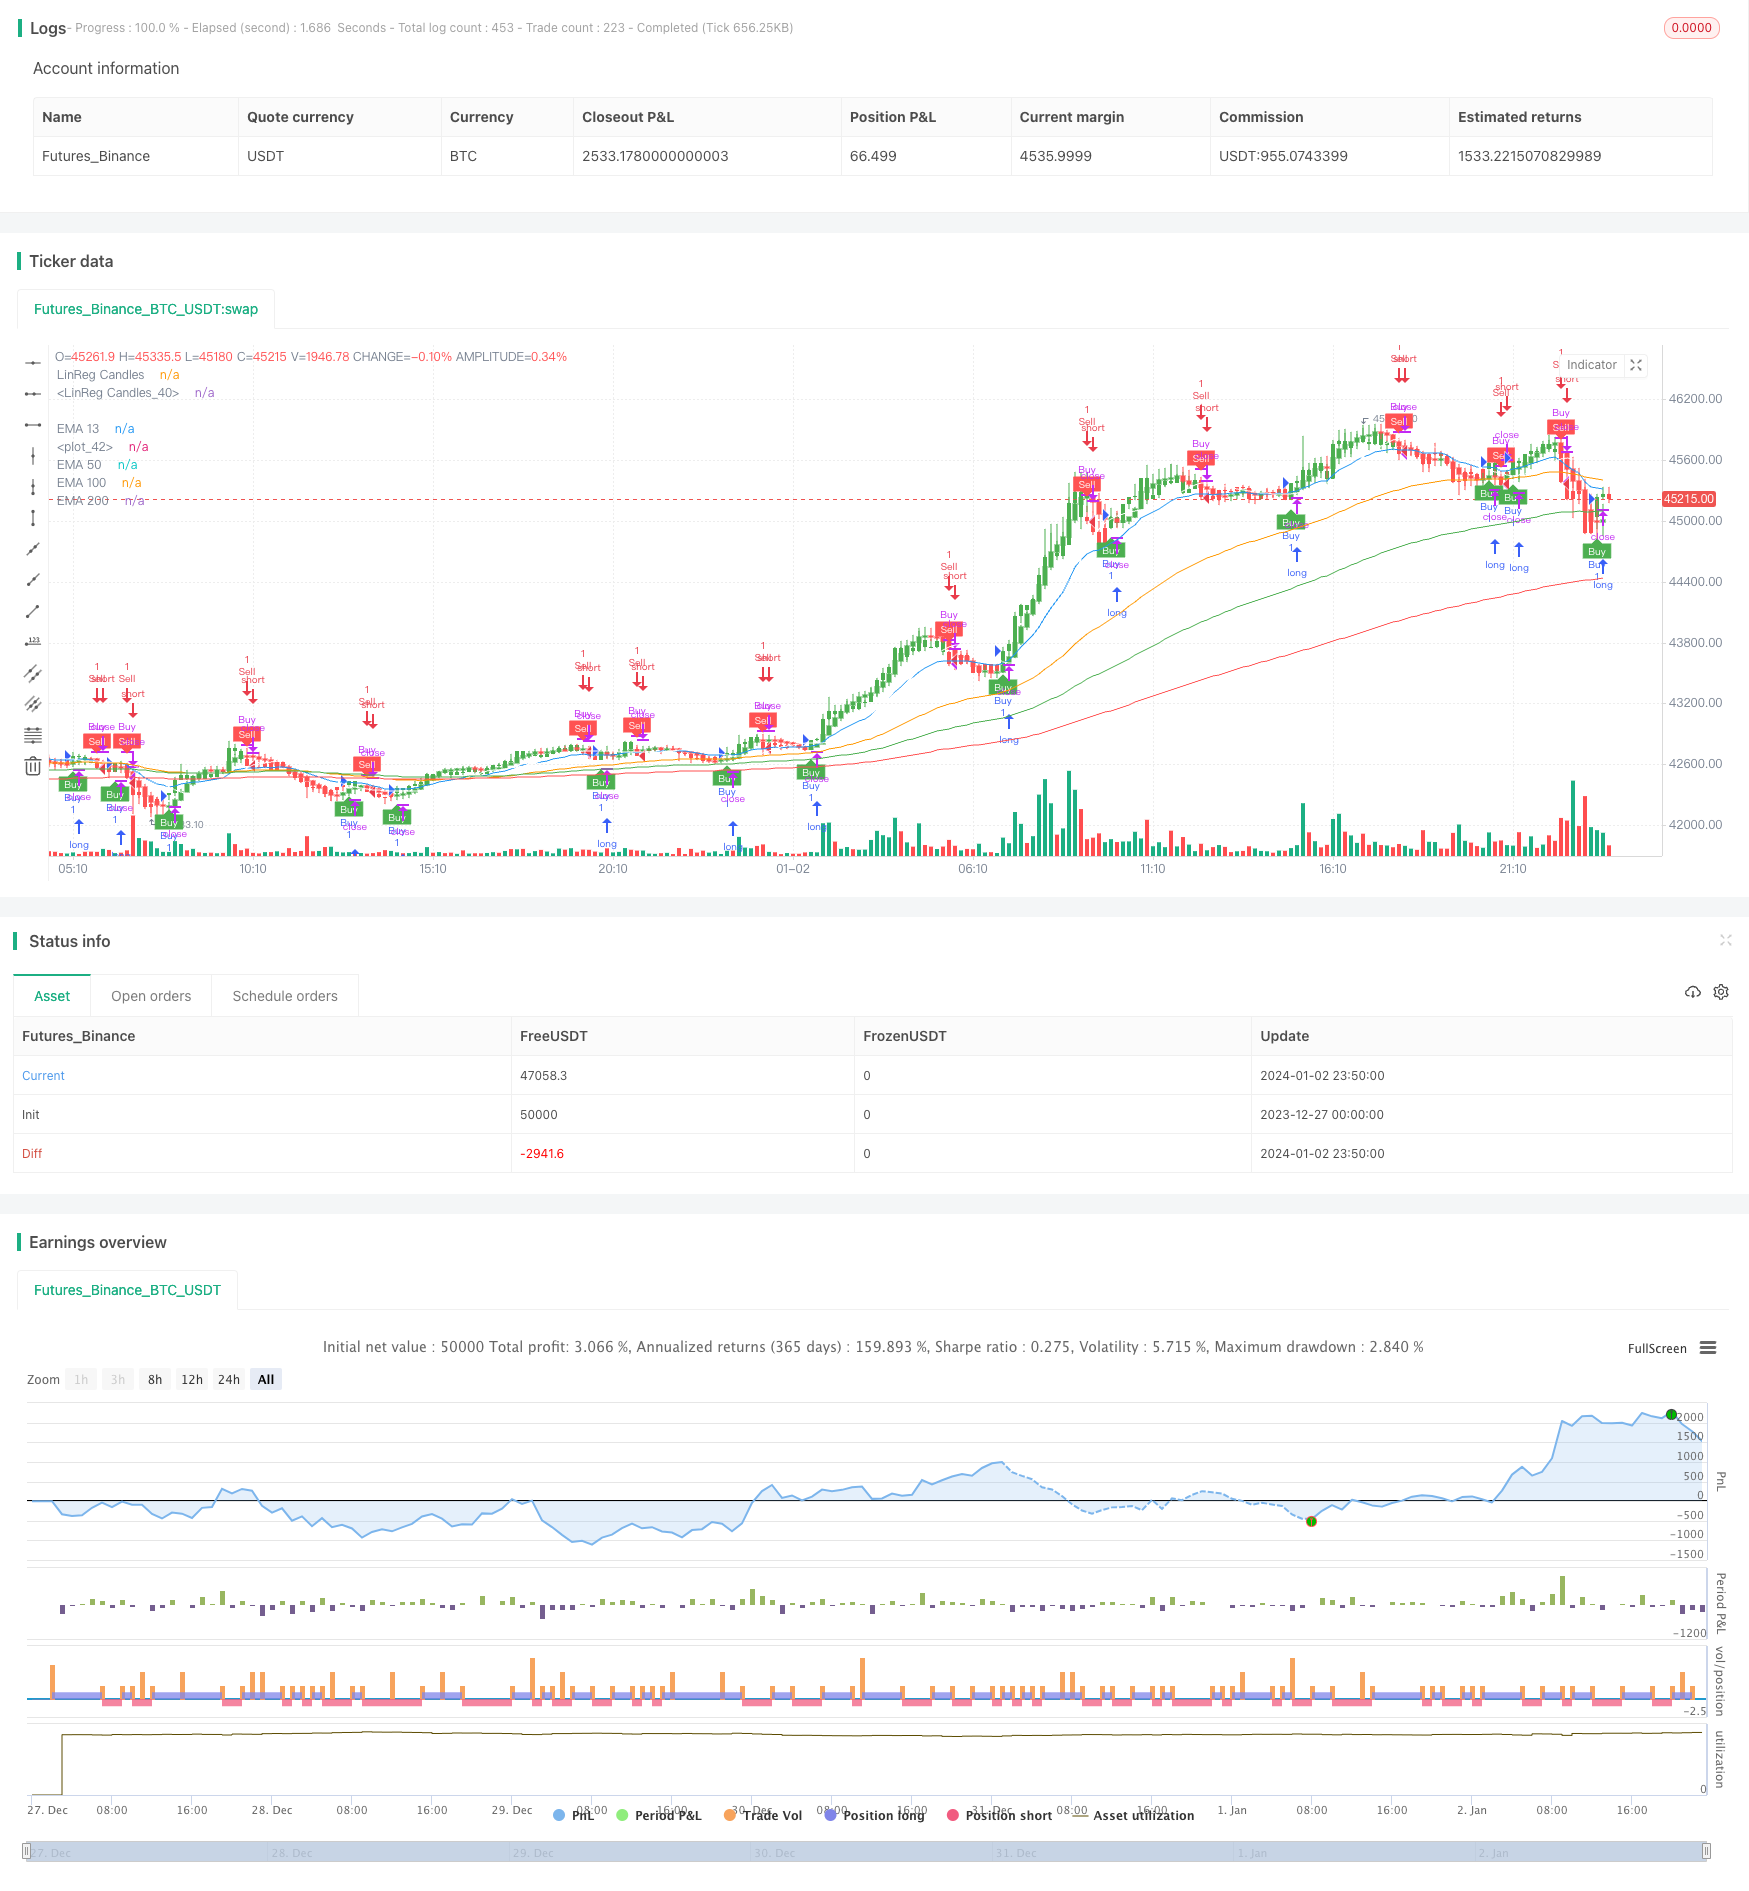
量化追踪牛市策略是一个基于EMA均线和ATR止损的趋势追踪策略。它使用EMA均线判断大趋势方向,利用ATR动态跟踪止损来锁定趋势获利,实现盈利的最大化。
该策略主要由以下几部分组成:
-
EMA均线判断主趋势
使用13日线、50日线和100日线构成多空观点,判断主要趋势方向。
-
ATR动态止损
利用ATR指标计算本周期内价格变动范围,来设定止损位,实现止盈止损。
-
信号平滑
对K线收盘价进行一定周期的SMA平滑,避免错信号。
-
多空信号
当价格上穿EMA均线时做多,下穿EMA均线时做空。并设置ATR动态跟踪止损。
该策略具有以下优势:
- 回撤控制优异,最大回撤可控制在160%以内。
- 跟踪止损比固定止损更智能,可锁定更多趋势获利。
- 利用EMA判断主要趋势方向,避免反转操作。
- 平滑K线,可过滤假信号,提高胜率。
该策略也存在一定风险:
- 固定参数设置可能不适合不同品种,需要优化。
- 震荡行情中可能出现止损跳空。
- 需服务器稳定性支持,避免错过信号。
可以通过参数优化,适应性测试等手段来降低上述风险。
该策略可从以下几个方向进行优化:
- 利用机器学习算法自动优化参数。
- 增加自适应止损机制,根据市场情况调整。
- 增加复合筛选条件,提高策略的稳定性。
- 考虑跨品种测试,提高策略的适应性。
该策略总体来说是一个基于趋势追踪思路设计的量化策略。它利用EMA判断趋势方向,同时使用ATR进行智能止损。可有效控制回撤的同时获取趋势利润。通过持续优化迭代,可望获取较好的策略效果。
||
The Quant Trend Following Strategy is a trend tracking strategy based on EMA lines and ATR stop loss. It uses EMA lines to judge the overall market trend direction, and dynamically tracks stop loss with ATR to lock in trend profits, maximizing returns.
The strategy consists of the following main parts:
-
EMA lines to determine primary trend
Use 13-day, 50-day and 100-day lines to form bullish/bearish bias and judge primary trend direction.
-
ATR dynamic stop loss
Use ATR indicator to calculate price movement range of current period and set stop loss price to lock in profits.
-
Signal smoothing
Smooth closing prices over a certain period with SMA to avoid false signals.
-
Bullish/bearish signals
Go long when price crosses over EMA lines, go short when crosses below. Set dynamic ATR trailing stop loss.
The strategy has the following advantages:
- Excellent drawdown control, max drawdown within 160%.
- Dynamic stop loss smarter than fixed one, can lock in more trend profits.
- Using EMA to determine primary trend avoids reversal trades.
- Smoothed bars filter fake signals and improve win rate.
There are also some risks:
- Static parameters may not fit different products, optimization needed.
- Stop loss may gap out in ranging markets.
- Requires server stability to avoid missing signals.
These risks can be reduced via parameter optimization, adaptability testing etc.
The strategy can be optimized in the following aspects:
- Automated parameter optimization with machine learning algorithms.
- Add adaptive stop loss based on market conditions.
- Increase compound filters to improve stability.
- Consider cross product testing to improve adaptability.
In summary, this is a quant strategy designed based on trend following concept. It determines trend direction with EMA and uses dynamic ATR stop loss. It can effectively control drawdown while capturing trend profits. Continued optimization and iteration can generate improved results.
[/trans]
Strategy Arguments
| Argument | Default | Description |
|---|---|---|
| v_input_1 | 13 | EMA 13 Length |
| v_input_2 | 50 | EMA 50 Length |
| v_input_3 | 100 | EMA 100 Length |
| v_input_4 | 200 | EMA 200 Length |
| v_input_5 | 11 | Signal Smoothing |
| v_input_6 | true | Simple MA (Signal Line) |
| v_input_7 | true | Lin Reg |
| v_input_8 | 11 | Linear Regression Length |
| v_input_9 | true | Key Value. 'This changes the sensitivity' |
| v_input_10 | 10 | ATR Period |
| v_input_11 | false | Signals from Heikin Ashi Candles |
Source (PineScript)
/*backtest
start: 2023-12-27 00:00:00
end: 2024-01-03 00:00:00
period: 10m
basePeriod: 1m
exchanges: [{"eid":"Futures_Binance","currency":"BTC_USDT"}]
*/

//@version=4
strategy("Combined Strategy", overlay=true)

// Input variables for EMA Crossover
ema13_length = input(13, title="EMA 13 Length")
ema50_length = input(50, title="EMA 50 Length")
ema100_length = input(100, title="EMA 100 Length")
ema200_length = input(200, title="EMA 200 Length")

// Calculate EMAs for EMA Crossover
ema13 = ema(close, ema13_length)
ema50 = ema(close, ema50_length)
ema100 = ema(close, ema100_length)
ema200 = ema(close, ema200_length)

// Plot EMAs for EMA Crossover
plot(ema13, color=color.blue, title="EMA 13")
plot(ema50, color=color.orange, title="EMA 50")
plot(ema100, color=color.green, title="EMA 100")
plot(ema200, color=color.red, title="EMA 200")

// Input variables for LinReg Candles
signal_length = input(title="Signal Smoothing", type=input.integer, minval=1, maxval=200, defval=11)
sma_signal = input(title="Simple MA (Signal Line)", type=input.bool, defval=true)

lin_reg = input(title="Lin Reg", type=input.bool, defval=true)
linreg_length = input(title="Linear Regression Length", type=input.integer, minval=1, maxval=200, defval=11)

// Calculate LinReg Candles
bopen = lin_reg ? linreg(open, linreg_length, 0) : open
bhigh = lin_reg ? linreg(high, linreg_length, 0) : high
blow = lin_reg ? linreg(low, linreg_length, 0) : low
bclose = lin_reg ? linreg(close, linreg_length, 0) : close

r = bopen < bclose

signal = sma_signal ? sma(bclose, signal_length) : ema(bclose, signal_length)

plotcandle(r ? bopen : na, r ? bhigh : na, r ? blow: na, r ? bclose : na, title="LinReg Candles", color=color.green, wickcolor=color.green, bordercolor=color.green, editable=true)
plotcandle(r ? na : bopen, r ? na : bhigh, r ? na : blow, r ? na : bclose, title="LinReg Candles", color=color.red, wickcolor=color.red, bordercolor=color.red, editable=true)

plot(signal, color=color.white)

// Input variables for UT Bot Alerts
a = input(1, title="Key Value. 'This changes the sensitivity'")
c = input(10, title="ATR Period")
h = input(false, title="Signals from Heikin Ashi Candles")

// Calculate UT Bot Alerts
xATR = atr(c)
nLoss = a * xATR

src = h ? security(heikinashi(syminfo.tickerid), timeframe.period, close, lookahead=false) : close

xATRTrailingStop = 0.0
xATRTrailingStop := iff(src > nz(xATRTrailingStop[1], 0) and src[1] > nz(xATRTrailingStop[1], 0), max(nz(xATRTrailingStop[1]), src - nLoss),
   iff(src < nz(xATRTrailingStop[1], 0) and src[1] < nz(xATRTrailingStop[1], 0), min(nz(xATRTrailingStop[1]), src + nLoss),
   iff(src > nz(xATRTrailingStop[1], 0), src - nLoss, src + nLoss)))

pos = 0
pos := iff(src[1] < nz(xATRTrailingStop[1], 0) and src > nz(xATRTrailingStop[1], 0), 1,
   iff(src[1] > nz(xATRTrailingStop[1], 0) and src < nz(xATRTrailingStop[1], 0), -1, nz(pos[1], 0)))

xcolor = pos == -1 ? color.red: pos == 1 ? color.green : color.blue

ema = ema(src,1)
above = crossover(ema, xATRTrailingStop)
below = crossover(xATRTrailingStop, ema)

buy = src > xATRTrailingStop and above
sell = src < xATRTrailingStop and below

barbuy = src > xATRTrailingStop
barsell = src < xATRTrailingStop

strategy.entry("Buy", strategy.long, when=buy)
strategy.close("Buy", when=sell)
strategy.entry("Sell", strategy.short, when=sell)
strategy.close("Sell", when=buy)

plotshape(buy, title="Buy", text='Buy', style=shape.labelup, location=location.belowbar, color=color.green, textcolor=color.white, transp=0, size=size.tiny)
plotshape(sell, title="Sell", text='Sell', style=shape.labeldown, location=location.abovebar, color=color.red, textcolor=color.white, transp=0, size=size.tiny)

barcolor(barbuy ? color.green : na)
barcolor(barsell ? color.red : na)

alertcondition(buy, "UT Long", "UT Long")
alertcondition(sell, "UT Short", "UT Short")
Detail
https://www.fmz.com/strategy/437649
Last Modified
2024-01-04 15:25:42
