Name
量化双管齐下策略Quantitative-Dual-indicator-Strategy
Author
ChaoZhang
Strategy Description
[trans]
该策略是基于双EMA指标和Bull Power指标的组合策略。策略名包含“量化”和“双管齐下”关键词,突出了其运用两个独立指标的特点。
该策略由两部分组成:
- 2/20 EMA指标。该指标计算2日和20日的EMA,当价格从下方上穿EMA时产生买入信号,价格从上方下穿EMA时产生卖出信号。
- Bull Power指标。该指标基于当前K线与前一K线的关系计算多空力量,当多空力量大于设置的阈值时产生相应的交易信号。
两部分信号需要同时触发才会打开仓位。比如EMA金叉和Bull Power同为正才开多仓,EMA死叉和Bull Power同为负才开空仓。
- 双指标组合过滤假信号。单一指标容易受外部因素影响产生假信号,组合指标可以相互验证,过滤假信号,提高信号质量。
- 指标参数可调。EMA周期和Bull Power阈值都可以自定义设置,适应不同市场环境。
- 简单明了。该策略仅运用两种常见指标,原理简单明了,容易理解实现。
- 指标失效风险。即使组合指标,在极端行情中依然可能出现指标失效的情况。
- 参数优化风险。不当的参数设置可能导致过多过少交易,降低策略效果。需要充分测试找到最佳参数。
- 增加止损机制。可以设置移动止损或者回看止损来控制单笔损失。
- 优化参数设置。可以测试不同的参数组合,找到最佳的参数以达到更好的策略效果。
- 增加过滤条件。可以在开仓条件中加入类似交易量或波动率的过滤条件,过滤掉一些异常行情。
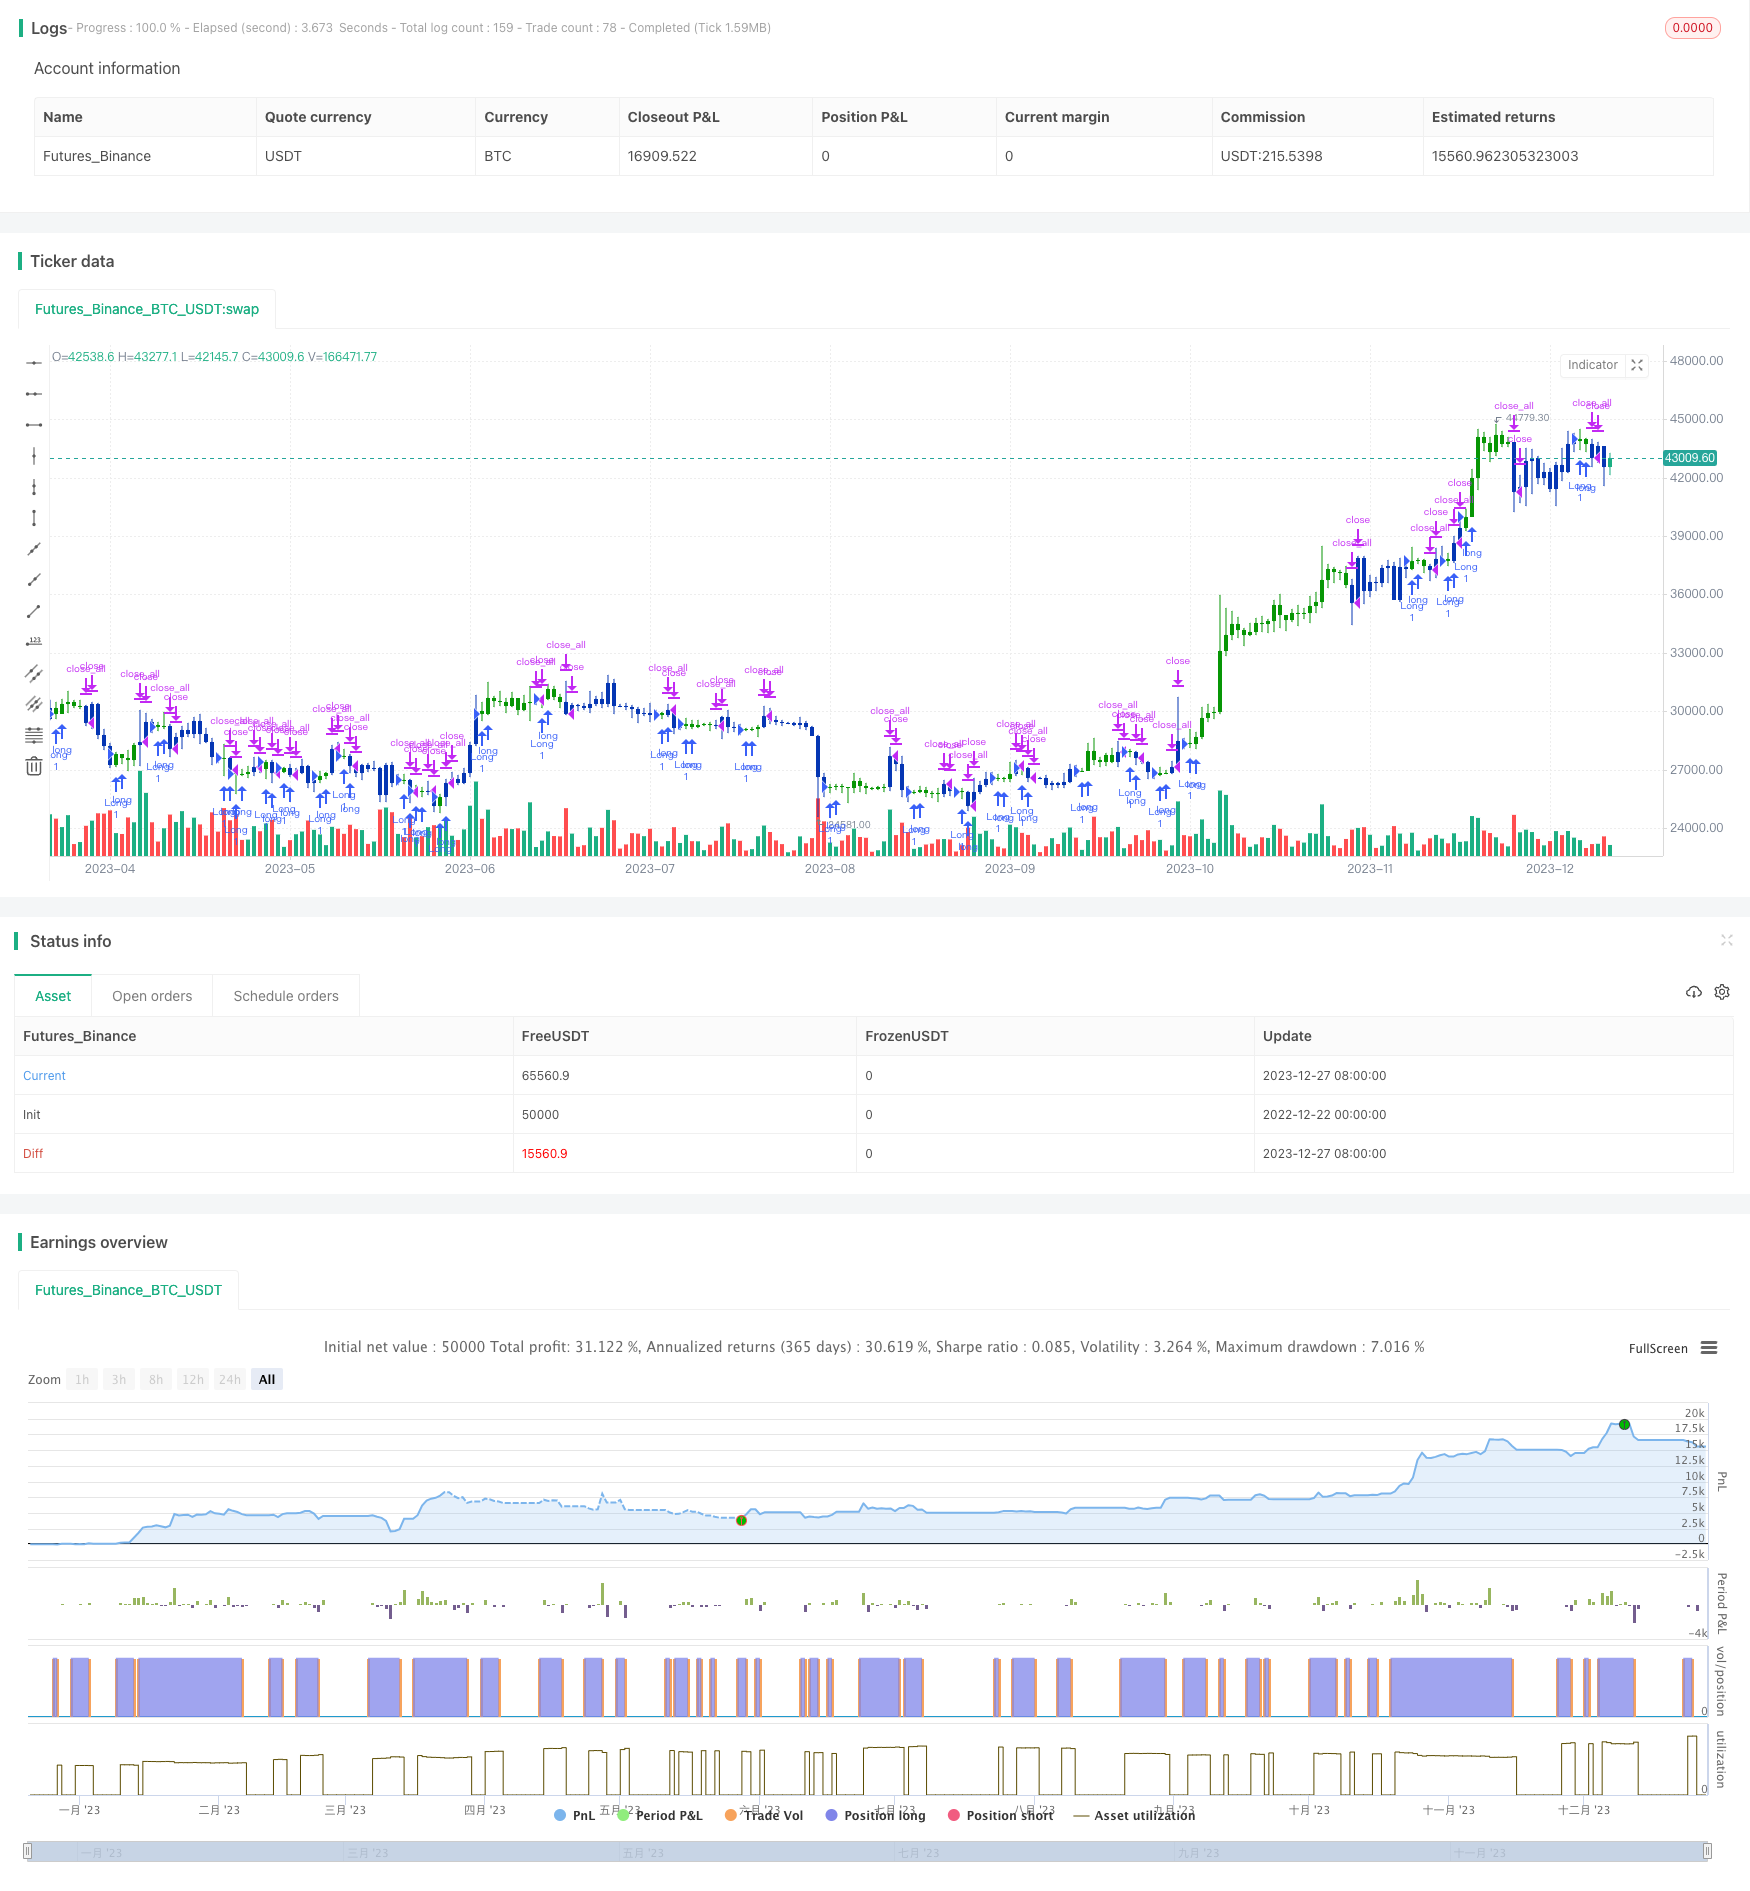
该策略通过双EMA和Bull Power的组合应用实现交易决策。相比单一指标,组合指标可以有效过滤假信号,在保持交易信号质量的同时,又具有参数调节空间。总体来说,该策略简单易懂,实际运用灵活,是一种实用性较强的量化交易策略。
||
This strategy is a combination strategy based on dual EMA indicator and Bull Power indicator. The strategy name contains keywords like "quantitative" and "dual-indicator", highlighting its characteristic of using two independent indicators.
The strategy consists of two parts:
-
2/20 EMA indicator. This indicator calculates the 2-day and 20-day EMA. It generates buy signals when price crosses above EMA and sell signals when price crosses below EMA.
-
Bull Power indicator. This indicator calculates bullish/bearish power based on the current bar's relationship with previous bar. It generates trading signals when bull/bear power exceeds the threshold.
The two parts' signals need to trigger at the same time to open positions. For example, EMA golden cross and Bull Power being positive open long positions, while EMA dead cross and Bull Power being negative open short positions.
- Combine indicators to filter fake signals. Single indicator is prone to be influenced by external factors generating fake signals. Dual-indicator combination can verify each other and filter out fake signals, improving signal quality.
- Customizable parameters. The periods of EMA and threshold of Bull Power are customizable to adapt to different market environments.
- Simple and clear logic. The strategy only uses two common indicators with simple and clear logic, easy to understand and implement.
- Indicator failure risk. Despite using combinational indicators, extreme market conditions may still cause indicator failure.
- Parameter optimization risk. Inappropriate parameter settings may lead to insufficient or excessive trading, undermining strategy performance. Requires sufficient testing to find optimal parameters.
- Add stop loss mechanisms. Set moving or lookback stop loss to control single trade loss.
- Optimize parameter settings. Test different parameter combinations to find the optimal parameters for better performance.
- Add filtering conditions. Adding conditions like trading volumes or volatility to filter abnormal market conditions when opening positions.
The strategy realizes trading decisions by combining dual EMA and Bull Power indicators. Compared to single indicator strategies, the combination eliminates fake signals effectively while retaining customizable parameters. In conclusion, this strategy features simplicity, flexibility and strong practicality as a quantitative trading strategy.
[/trans]
Strategy Arguments
| Argument | Default | Description |
|---|---|---|
| v_input_int_1 | 14 | (?●═════ 2/20 EMA ═════●)Length |
| v_input_float_1 | -15 | (?●═════ Bull Power ═════●)SellLevel |
| v_input_bool_1 | false | (?●═════ MISC ═════●)Trade reverse |
| v_input_int_2 | true | (?●═════ Time Start ═════●)From Day |
| v_input_int_3 | true | From Month |
| v_input_int_4 | 2005 | From Year |
Source (PineScript)
/*backtest
start: 2022-12-22 00:00:00
end: 2023-12-28 00:00:00
period: 1d
basePeriod: 1h
exchanges: [{"eid":"Futures_Binance","currency":"BTC_USDT"}]
*/

//@version=5
////////////////////////////////////////////////////////////
//  Copyright by HPotter v1.0 12/07/2022
// This is combo strategies for get a cumulative signal.
//
// First strategy
// This indicator plots 2/20 exponential moving average. For the Mov
// Avg X 2/20 Indicator, the EMA bar will be painted when the Alert criteria is met.
//
// Second strategy
//  Bull Power Indicator
//  To get more information please see "Bull And Bear Balance Indicator"
//  by Vadim Gimelfarb.
//
// WARNING:
// - For purpose educate only
// - This script to change bars colors.
////////////////////////////////////////////////////////////
EMA20(Length) =>
    pos = 0.0
    xPrice = close
    xXA = ta.ema(xPrice, Length)
    nHH = math.max(high, high[1])
    nLL = math.min(low, low[1])
    nXS = nLL > xXA or nHH < xXA ? nLL : nHH
    iff_1 = nXS < close[1] ? 1 : nz(pos[1], 0)
    pos := nXS > close[1] ? -1 : iff_1
    pos


BP(SellLevel) =>
    pos = 0.0
    value = close < open ?
             close[1] < open ?  math.max(high - close[1], close - low): math.max(high - open, close - low):
              close > open ?
               close[1] > open ?  high - low : math.max(open - close[1], high - low) :
                 high - close > close - low ?
                  close[1] < open ? math.max(high - close[1], close - low) : high - open :
                   high - close < close - low ?
                     close[1] > open ?  high - low : math.max(open - close, high - low) :
                      close[1] > open ? math.max(high - open, close - low) :
                       close[1] < open? math.max(open - close, high - low): high - low
    val2 = ta.sma(value, 15)
    pos :=  val2 > SellLevel ? 1 : -1
    pos

strategy(title='Combo 2/20 EMA & Bull Power', shorttitle='Combo', overlay=true)
var I1 = '●═════ 2/20 EMA ═════●'
Length = input.int(14, minval=1, group=I1)
var I2 = '●═════  Bull Power ═════●'
SellLevel = input.float(-15, step=0.01, group=I2)
var misc = '●═════ MISC ═════●'
reverse = input.bool(false, title='Trade reverse', group=misc)
var timePeriodHeader = '●═════ Time Start ═════●'
d = input.int(1, title='From Day', minval=1, maxval=31, group=timePeriodHeader)
m = input.int(1, title='From Month', minval=1, maxval=12, group=timePeriodHeader)
y = input.int(2005, title='From Year', minval=0, group=timePeriodHeader)
StartTrade = time > timestamp(y, m, d, 00, 00) ? true : false
posEMA20 = EMA20(Length)
prePosBP = BP(SellLevel)
iff_1 = posEMA20 == -1 and prePosBP == -1 and StartTrade ? -1 : 0
pos = posEMA20 == 1 and prePosBP == 1 and StartTrade ? 1 : iff_1
iff_2 = reverse and pos == -1 ? 1 : pos
possig = reverse and pos == 1 ? -1 : iff_2
if possig == 1
    strategy.entry('Long', strategy.long)
if possig == -1
    strategy.entry('Short', strategy.short)
if possig == 0
    strategy.close_all()
barcolor(possig == -1 ? #b50404 : possig == 1 ? #079605 : #0536b3)
Detail
https://www.fmz.com/strategy/437031
Last Modified
2023-12-29 16:29:21
