Name
量化交易动量方向收敛策略Ergotic-Momentum-Direction-Convergence-Trading-Strategy
Author
ChaoZhang
Strategy Description
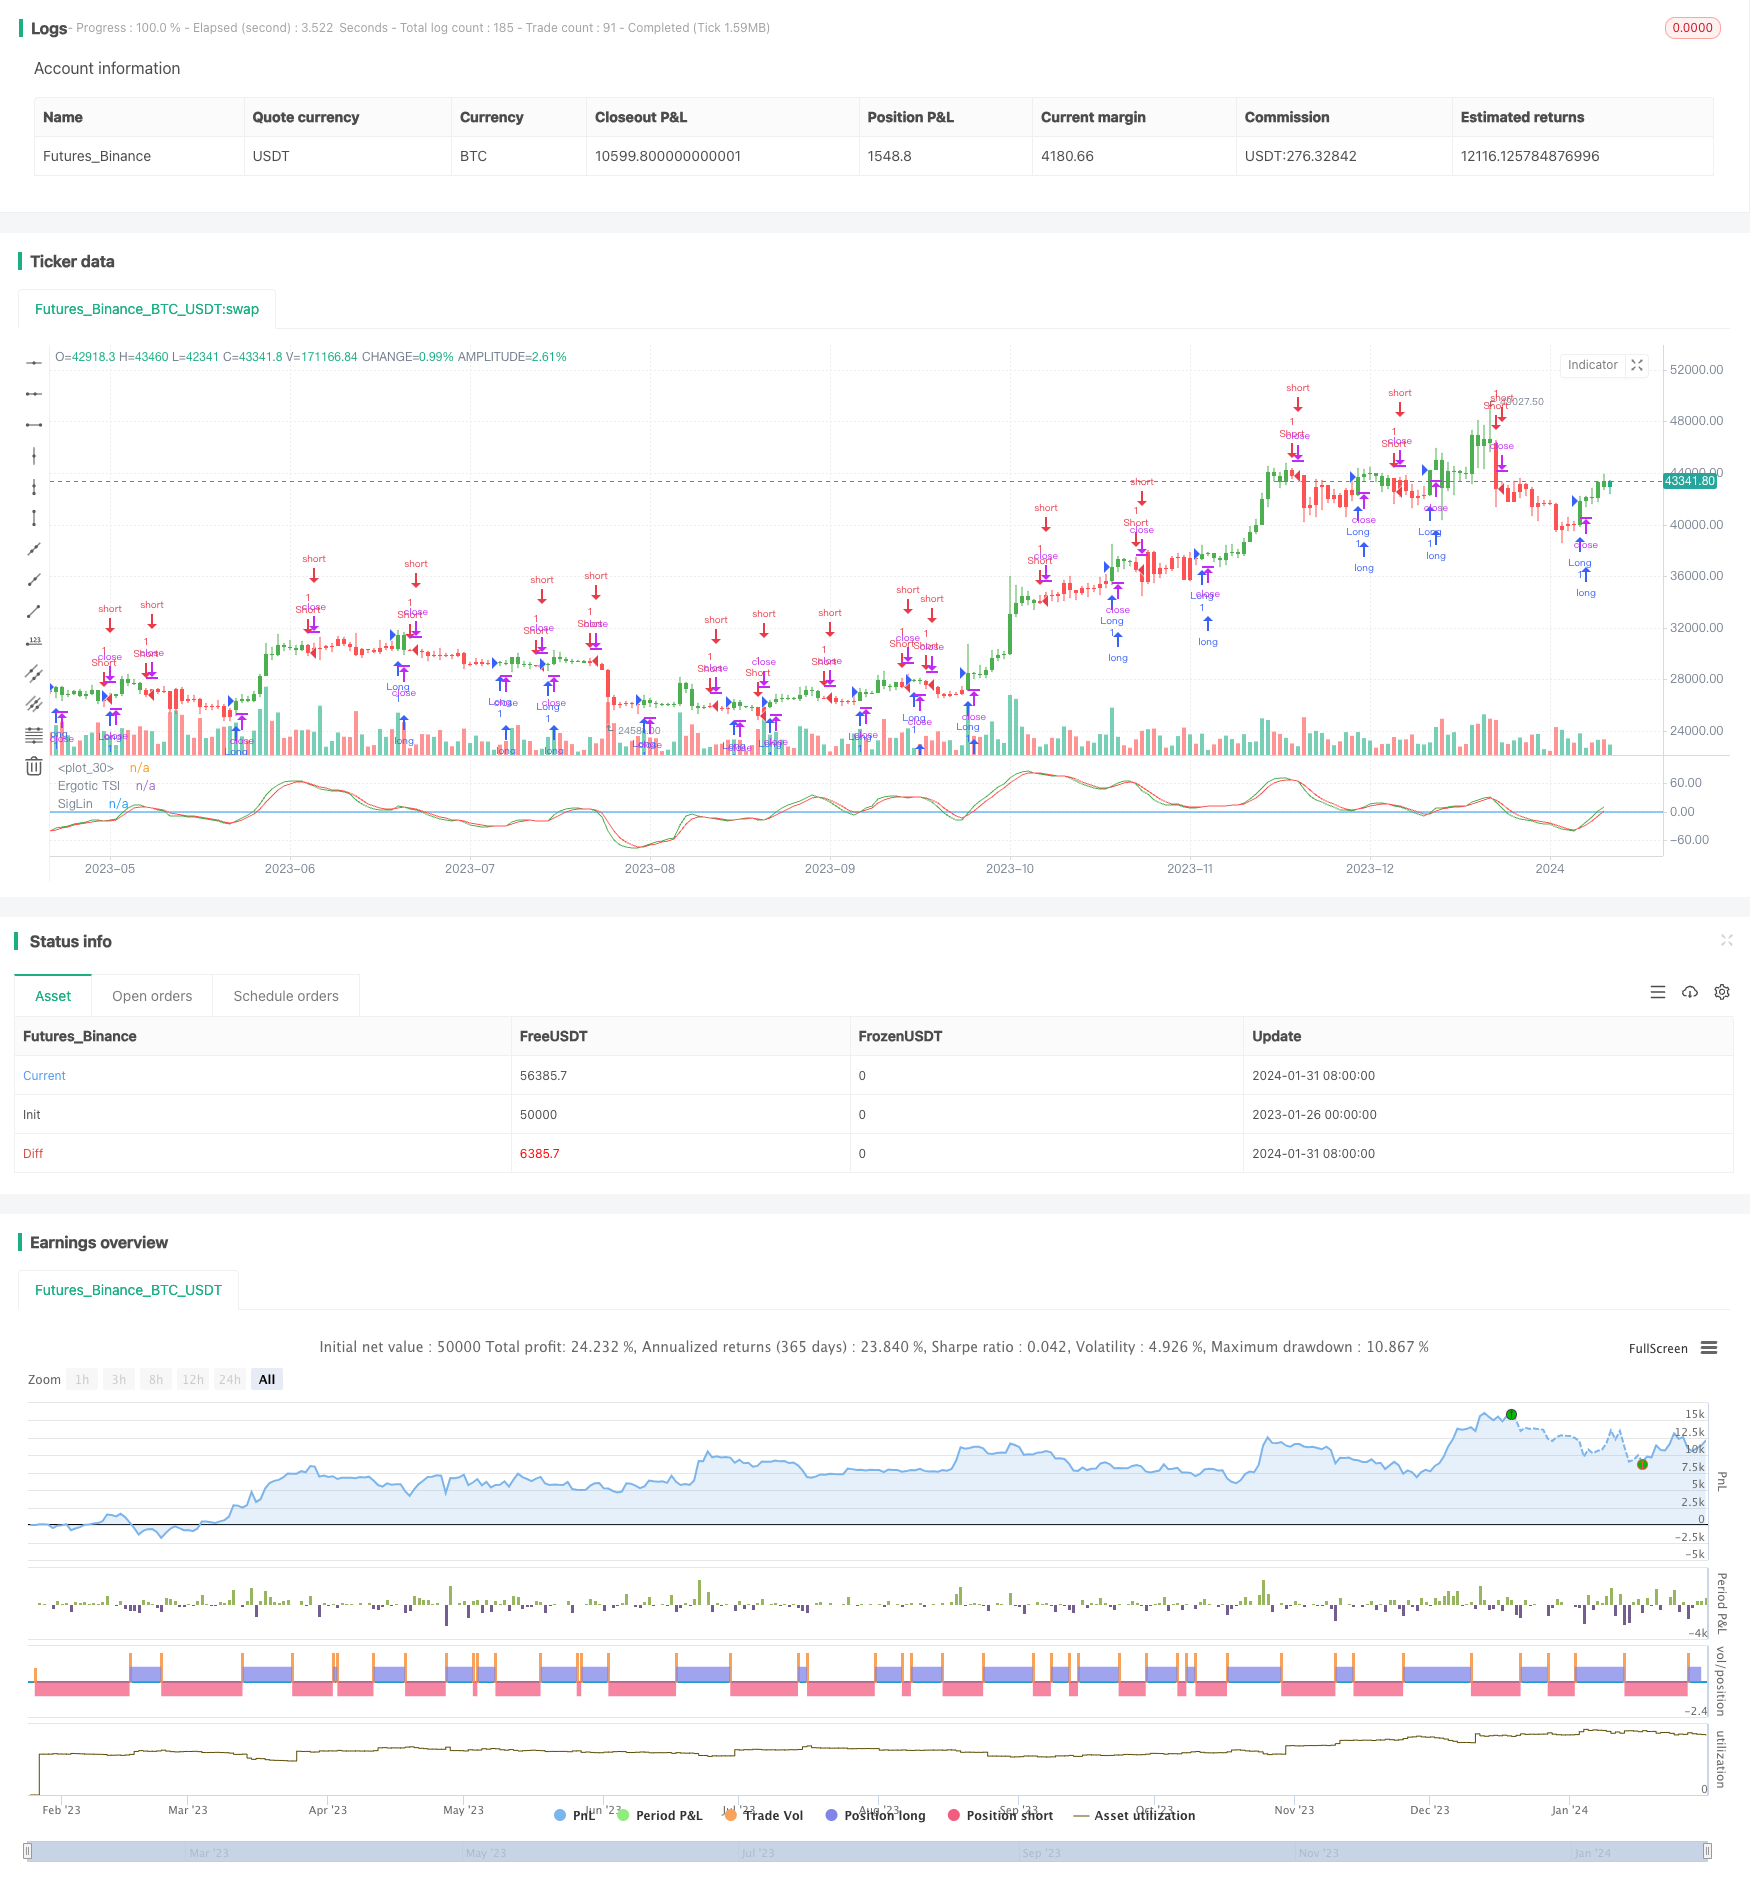
本策略名称为“量化交易动量方向收敛策略”,是根据William Blau在其著作《动量,方向和收敛》(Momentum, Direction and Divergence)一书中描述的技术指标而设计的量化交易策略。该策略聚焦于动量、方向和收敛这三个关键层面,通过计算股票价格的动量指标,判断市场趋势方向,并寻找价格和指标之间的背离现象,以获取交易机会。
本策略的核心指标是应急动量指数(Ergotic TSI),它计算公式如下:
Val1 = 100 * EMA(EMA(EMA(价格变化量,r),s),u)

Val2 = EMA(EMA(EMA(价格变化量的绝对值,r),s),u)

Ergotic TSI = 如果Val2不等于0,则为Val1/Val2,否则为0
其中,r、s、u为平滑参数。该指标反映了价格变化量占价格变化量绝对值的比例,属于动量震荡指标。然后我们计算Ergotic TSI的EMA平滑移动平均线作为信号线。当TSI上穿信号线时做多,下穿信号线时做空。
本策略主要有以下优势:
- 捕捉价格变化趋势的能力强
- 对价格震荡有很好的过滤作用
- 具有较好的背离特征
- 参数设置灵活,可调整平滑度
本策略也存在一些风险:
- 在趋势反转点时会产生错误信号
- 参数设置不当会错过交易机会或增加虚假信号
- 需要适当调整参数以适应不同品种和交易环境
可以通过优化参数,组合其他指标进行确认,设定止损来控制风险。
本策略可以从以下几个方面进行优化:
- 测试不同的价格输入,如开盘价、收盘价、中间价等
- 调整平滑参数r、s、u的值,寻找最佳参数组合
- 增加其他指标或过滤条件进一步确认信号
- 设定止损点和退出机制
本策略综合考虑了动量变化、趋势判断和背离特征,可以有效捕捉趋势机会。通过参数优化、信号过滤及风险控制的手段,可以获得较好的策略表现。总体来说,该策略设计得较为合理,值得进一步研究与实践。
||
The name of this strategy is Ergotic Momentum Direction Convergence Trading Strategy. It is a quantitative trading strategy designed based on the technical indicator described in William Blau's book "Momentum, Direction and Divergence". This strategy focuses on three key aspects - momentum, direction and divergence, by calculating price momentum indicators of stocks, determining market trend direction, and finding divergences between price and indicators to spot trading opportunities.
The core indicator of this strategy is Ergotic TSI, and its calculation formula is as follows:
Val1 = 100 * EMA(EMA(EMA(price change, r), s), u)

Val2 = EMA(EMA(EMA(absolute value of price change, r), s), u))

Ergotic TSI = If Val2 != 0, Val1/Val2, else 0
where r, s, u are smoothing parameters. This indicator reflects the ratio of price change to the absolute value of price change, which belongs to the momentum oscillator indicator. Then we calculate the EMA moving average of Ergotic TSI as the signal line. Go long when TSI crosses over the signal line, and go short when it crosses below.
The main advantages of this strategy are:
- Strong ability to capture price change trends
- Good filtering of price fluctuations
- Relatively good divergence characteristics
- Flexible parameter settings to adjust smoothing
There are also some risks in this strategy:
- Wrong signals may occur at trend reversal points
- Inappropriate parameter settings may miss trading opportunities or increase false signals
- Parameters need proper adjustment to suit different products and trading environments Risks can be controlled by optimizing parameters, combining other indicators for confirmation, and setting stop loss.
This strategy can be optimized in the following aspects:
- Test different price inputs, such as open, close, mid price, etc.
- Adjust r, s, u parameter values to find optimal parameter combinations
- Add other indicators or filters to further confirm signals
- Set stop loss points and exit mechanisms
This strategy integrates considerations of momentum change, trend judgment and divergence features. It can effectively capture trend opportunities. With parameter optimization, signal filtering and risk control methods, good strategy performance can be achieved. Overall, the strategy is designed reasonably and worth further research and practice.
[/trans]
Strategy Arguments
| Argument | Default | Description |
|---|---|---|
| v_input_1 | 4 | r |
| v_input_2 | 8 | s |
| v_input_3 | 6 | u |
| v_input_4 | 3 | SmthLen |
| v_input_5 | false | Trade reverse |
Source (PineScript)
/*backtest
start: 2023-01-26 00:00:00
end: 2024-02-01 00:00:00
period: 1d
basePeriod: 1h
exchanges: [{"eid":"Futures_Binance","currency":"BTC_USDT"}]
*/

//@version = 2
////////////////////////////////////////////////////////////
//  Copyright by HPotter v1.0 13/12/2016
// r - Length of first EMA smoothing of 1 day momentum        4
// s - Length of second EMA smoothing of 1 day smoothing      8
// u- Length of third EMA smoothing of 1 day momentum         6
// Length of EMA signal line                                  3
// Source of Ergotic TSI                                      Close
//
// This is one of the techniques described by William Blau in his book "Momentum,
// Direction and Divergence" (1995). If you like to learn more, we advise you to
// read this book. His book focuses on three key aspects of trading: momentum,
// direction and divergence. Blau, who was an electrical engineer before becoming
// a trader, thoroughly examines the relationship between price and momentum in
// step-by-step examples. From this grounding, he then looks at the deficiencies
// in other oscillators and introduces some innovative techniques, including a
// fresh twist on Stochastics. On directional issues, he analyzes the intricacies
// of ADX and offers a unique approach to help define trending and non-trending periods.
//
// You can use in the xPrice any series: Open, High, Low, Close, HL2, HLC3, OHLC4 and ect...
// You can change long to short in the Input Settings
// Please, use it only for learning or paper trading. Do not for real trading.
////////////////////////////////////////////////////////////
strategy(title="Ergotic TSI Strategy Backtest")
r = input(4, minval=1)
s = input(8, minval=1)
u = input(6, minval=1)
SmthLen = input(3, minval=1)
reverse = input(false, title="Trade reverse")
hline(0, color=blue, linestyle=line)
xPrice = close
xPrice1 = xPrice - xPrice[1]
xPrice2 = abs(xPrice - xPrice[1])
xSMA_R = ema(ema(ema(xPrice1,r), s),u)
xSMA_aR = ema(ema(ema(xPrice2, r), s),u)
Val1 = 100 * xSMA_R
Val2 = xSMA_aR
xTSI = iff (Val2 != 0, Val1 / Val2, 0)
xEMA_TSI = ema(xTSI, SmthLen)
pos = iff(xTSI > xEMA_TSI, 1,
	   iff(xTSI < xEMA_TSI, -1, nz(pos[1], 0)))
possig = iff(reverse and pos == 1, -1,
          iff(reverse and pos == -1, 1, pos))
if (possig == 1)
    strategy.entry("Long", strategy.long)
if (possig == -1)
    strategy.entry("Short", strategy.short)
barcolor(possig == -1 ? red: possig == 1 ? green : blue )
plot(xTSI, color=green, title="Ergotic TSI")
plot(xEMA_TSI, color=red, title="SigLin")
Detail
https://www.fmz.com/strategy/440794
Last Modified
2024-02-02 10:51:11
