Name
通过计算价格波动性趋势突破策略Trend-Breakout-Strategy
Author
ChaoZhang
Strategy Description
趋势突破策略是一种通过计算价格波动性来判断市场趋势并进行交易的量化策略。该策略运用(最高价-最低价)/收盘价的公式计算K线的价格波动性,再通过均线进行平滑处理,判断是否出现趋势反转。当波动性高于最近一定周期的平均水平时,说明可能出现新的趋势,这时策略会发出交易信号。
该策略的核心指标是(最高价-最低价)/收盘价,它反映了K线的波动幅度。策略首先计算这一指标,然后取其绝对值并计算简单移动平均线。如果当前K线的波动幅度指标绝对值高于过去一定周期移动平均值,则说明可能正在形成新的趋势。
具体来说,策略包含以下步骤:
- 计算(最高价-最低价)/收盘价作为波动性指标
- 对波动性指标取绝对值并计算简单移动平均线
- 比较当前K线波动性与过去一定周期(用户输入)移动平均线的大小关系
- 如果当前波动性大于移动平均线,形成多头信号;如果当前波动性小于移动平均线,形成空头信号
- 根据信号方向进行做多或做空
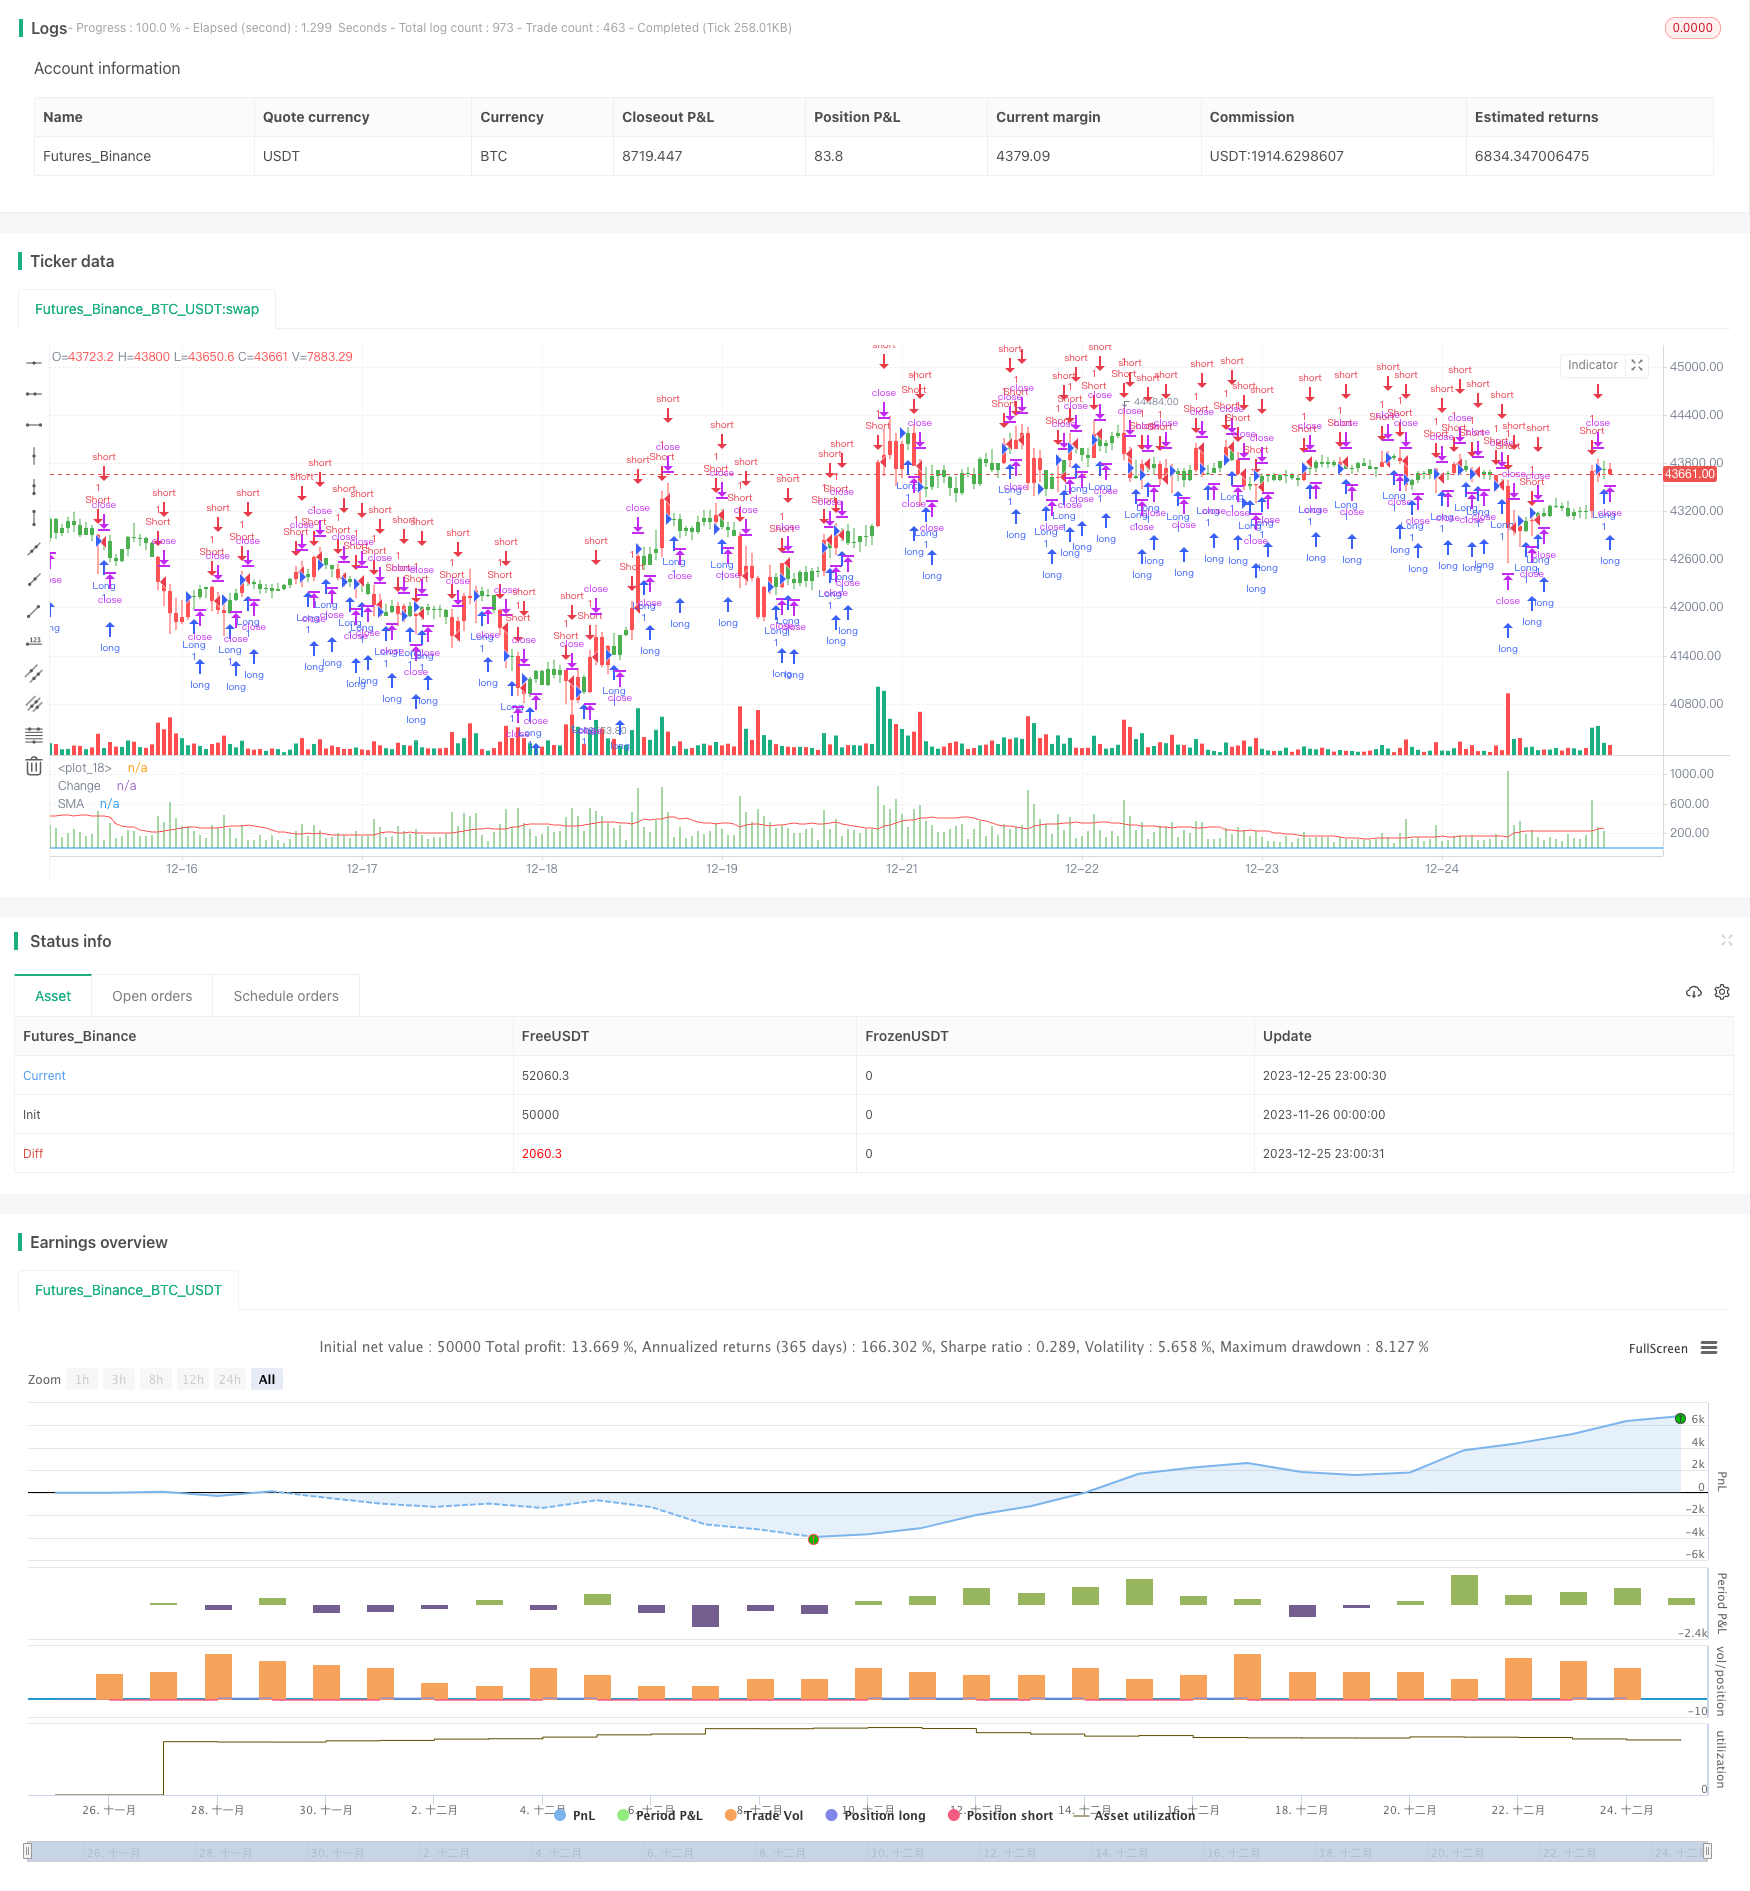
该策略还包含指标绘制、K线颜色改变等可视化操作,方便直观判断市场趋势。总的来说,策略运用价格波动性判断潜在趋势变化的思路简单直接有效。
该策略具有以下主要优势:
- 原理简单直接,容易理解实现
- 采用价格波动性判断市场趋势变化,没有固定指标框架
- 可自定义参数调整判断灵敏度
- 结合指标绘制和K线颜色改变,直观判断效果好
- 可平滑去噪声,有利于抓住中长线趋势
总的来说,该策略突破了传统指标判断的思维定式,只关注价格本身的波动性,灵活捕捉潜在趋势变化。参数可调性强,使用简便,是一种值得推荐的趋势策略。
该策略也存在以下主要风险:
- 对市场波动性过于敏感,可能产生多次无效信号
- 只考虑价格波动性,忽视了其他影响因素
- 参数设置不当可能错过趋势或错误判断
- 无法区分中长线趋势和短线调整
这些风险主要与该策略过于依赖价格波动性判断市场趋势有关。为降低风险,可以考虑结合其他判断指标,判断趋势信号的有效性;也可以适当调整参数,平滑波动性指标,过滤掉短线噪声。
该策略主要可从以下方向进行优化:
- 结合交易量等指标判断趋势有效性
- 增加机器学习模型判断信号质量
- 优化参数设置,使平滑效果更好
- 区分中长线趋势和短线调整
- 结合止损策略控制单笔损失
这些优化措施可以降低错交易概率,提高策略获利率。特别是增加判断信号有效性的指标和模型可以大幅减少无效信号。此外,止损策略也很必要,可以控制单笔损失,保证总体收益。
该趋势突破策略通过计算价格波动性判断市场趋势变化,原理简单直接,使用灵活,可自定义参数调整判断敏感度。策略具有抓住趋势变化的优势,但也存在一定风险。我们可以从优化判断指标、建立过滤模型、调整参数设置等方面进行改进,使策略更稳定可靠。总的来说,该策略为判断市场趋势变化提供了新的思路,值得进一步研究优化。
||
The trend breakout strategy is a quantitative strategy that judges market trends and trades by calculating price volatility. The strategy uses the formula (high-low)/close to calculate price volatility of candlestick, and further processes it through moving average to judge whether a trend reversal occurs. When volatility is higher than the average level over a recent period, a new trend may be emerging. Then the strategy will issue trading signals.
The core indicator of this strategy is (high-low)/close, which reflects the amplitude of candlestick. The strategy first calculates this indicator, then takes its absolute value and calculates simple moving average. If the current candlestick's volatility indicator absolute value is higher than moving average value over a period, it means a new trend may be forming.
Specifically, the strategy includes following steps:
- Calculate (high-low)/close as volatility indicator
- Take absolute value of volatility indicator and calculate simple moving average
- Compare current candlestick volatility with moving average over a period (user input)
- If current volatility is greater than moving average, form long signal; if lower, form short signal
- Make long or short positions based on signal directions
The strategy also contains indictor plotting, candlestick color change and other visualizations for intuitive trend judgment. In summary, the idea of using price volatility to judge potential trend change is simple and effective.
The main advantages of this strategy are:
- Simple and direct principle, easy to understand and implement
- Use price volatility to judge market trend change, no fixed indicator framework
- Customizable parameters to adjust judgment sensitivity
- Good intuitive effect combined with indicator plotting and color change
- Can smooth out noise and catch mid-long term trends
In general, this strategy breaks through the thinking pattern of traditional indicator judgment, and only focuses on price volatility itself to flexibly capture potential trend changes. The strategy is adjustable, easy to use, and worth recommending.
The main risks of this strategy include:
- Too sensitive to market volatility, may generate multiple invalid signals
- Only consider price volatility, ignore other factors
- Improper parameter settings may miss trends or cause wrong judgements
- Unable to distinguish mid-long term trends and short-term adjustments
These risks are mainly related to over reliance of the strategy on price volatility to determine market trends. To reduce risks, we can consider combining other judgment indicators to verify the validity of trend signals, and properly adjust parameters to smooth volatility indicators, filtering out short-term noises.
The main directions for optimizing this strategy include:
- Combine trading volume and other indicators to determine trend validity
- Add machine learning models to judge signal quality
- Optimize parameter settings for better smoothing effects
- Distinguish mid-long term trends and short-term adjustments
- Combine with stop loss strategies to control per trade loss
These optimization measures can reduce the probability of wrong trades and improve the profitability of the strategy. In particular, adding indicators and models to determine signal validity can greatly reduce invalid signals. In addition, stop loss strategies are also necessary to control single trade loss and ensure overall returns.
This trend breakout strategy judges market trend changes by calculating price volatility. The principle is simple and direct, and the usage is flexible with customizable parameters for sensitivity adjustment. The strategy has the advantage of capturing trend changes, but also has some risks. We can improve it by optimizing judgment indicators, establishing filtering models, adjusting parameter settings and so on, to make the strategy more stable and reliable. In general, this strategy provides a new idea for determining market trend changes and is worth further research and optimization.
[/trans]
Strategy Arguments
| Argument | Default | Description |
|---|---|---|
| v_input_1 | 4 | Bar Width |
| v_input_2 | true | Look Back |
| v_input_3 | false | % change |
| v_input_4 | 16 | SMA Length |
| v_input_5 | false | Trade reverse |
Source (PineScript)
/*backtest
start: 2023-11-26 00:00:00
end: 2023-12-26 00:00:00
period: 1h
basePeriod: 15m
exchanges: [{"eid":"Futures_Binance","currency":"BTC_USDT"}]
*/

//@version=3
////////////////////////////////////////////////////////////
//  Copyright by HPotter v2.0 25/10/2017
//
//  This histogram displays (high-low)/close
//  Can be applied to any time frame.
//
// WARNING:
// - For purpose educate only
// - This script to change bars colors.
////////////////////////////////////////////////////////////
strategy(title="(H-L)/C Histogram Backtest", precision = 2)
input_barwidth = input(4, title="Bar Width")
input_barsback = input(1, title="Look Back")
input_percentorprice = input(false, title="% change")
input_smalength = input(16, title="SMA Length")
reverse = input(false, title="Trade reverse")
hline(0, color=blue, linestyle=line)
xPrice = (high-low)/close
xPriceHL = (high-low)
xPrice1 = iff(input_percentorprice, xPrice * 100, xPriceHL)
xPrice1SMA = sma(abs(xPrice1), input_smalength)
pos = 0.0
pos := iff(xPrice1SMA[input_barsback] > abs(xPrice1), 1,
	   iff(xPrice1SMA[input_barsback] < abs(xPrice1), -1, nz(pos[1], 0)))
possig = iff(reverse and pos == 1, -1,
          iff(reverse and pos == -1, 1, pos))
if (possig == 1)
    strategy.entry("Long", strategy.long)
if (possig == -1)
    strategy.entry("Short", strategy.short)
barcolor(possig == -1 ? red: possig == 1 ? green : blue )
plot(abs(xPrice1), color=green, style = histogram, linewidth = input_barwidth, title="Change")
plot(xPrice1SMA[input_barsback], color=red, title="SMA")
Detail
https://www.fmz.com/strategy/436793
Last Modified
2023-12-27 17:34:31
