Name
超趋势Bollinger带双指数移动平均线交易策略SuperTrend-Bollinger-Bands-Dual-Moving-Average-Trading-Strategy
Author
ChaoZhang
Strategy Description
该策略集成了多种技术指标,包括超趋势指标、双指数移动平均线和布林带,以发挥各指标的优势,实现更准确的交易信号。
策略使用12周期的ATR和价格的平均值计算超趋势的上轨和下轨,根据价格突破上轨和下轨来判断多头和空头信号。同时,使用200周期的双指数移动平均线作为判断趋势的辅助指标。此外,策略还使用布林带来确定入市和止损的最佳时机。
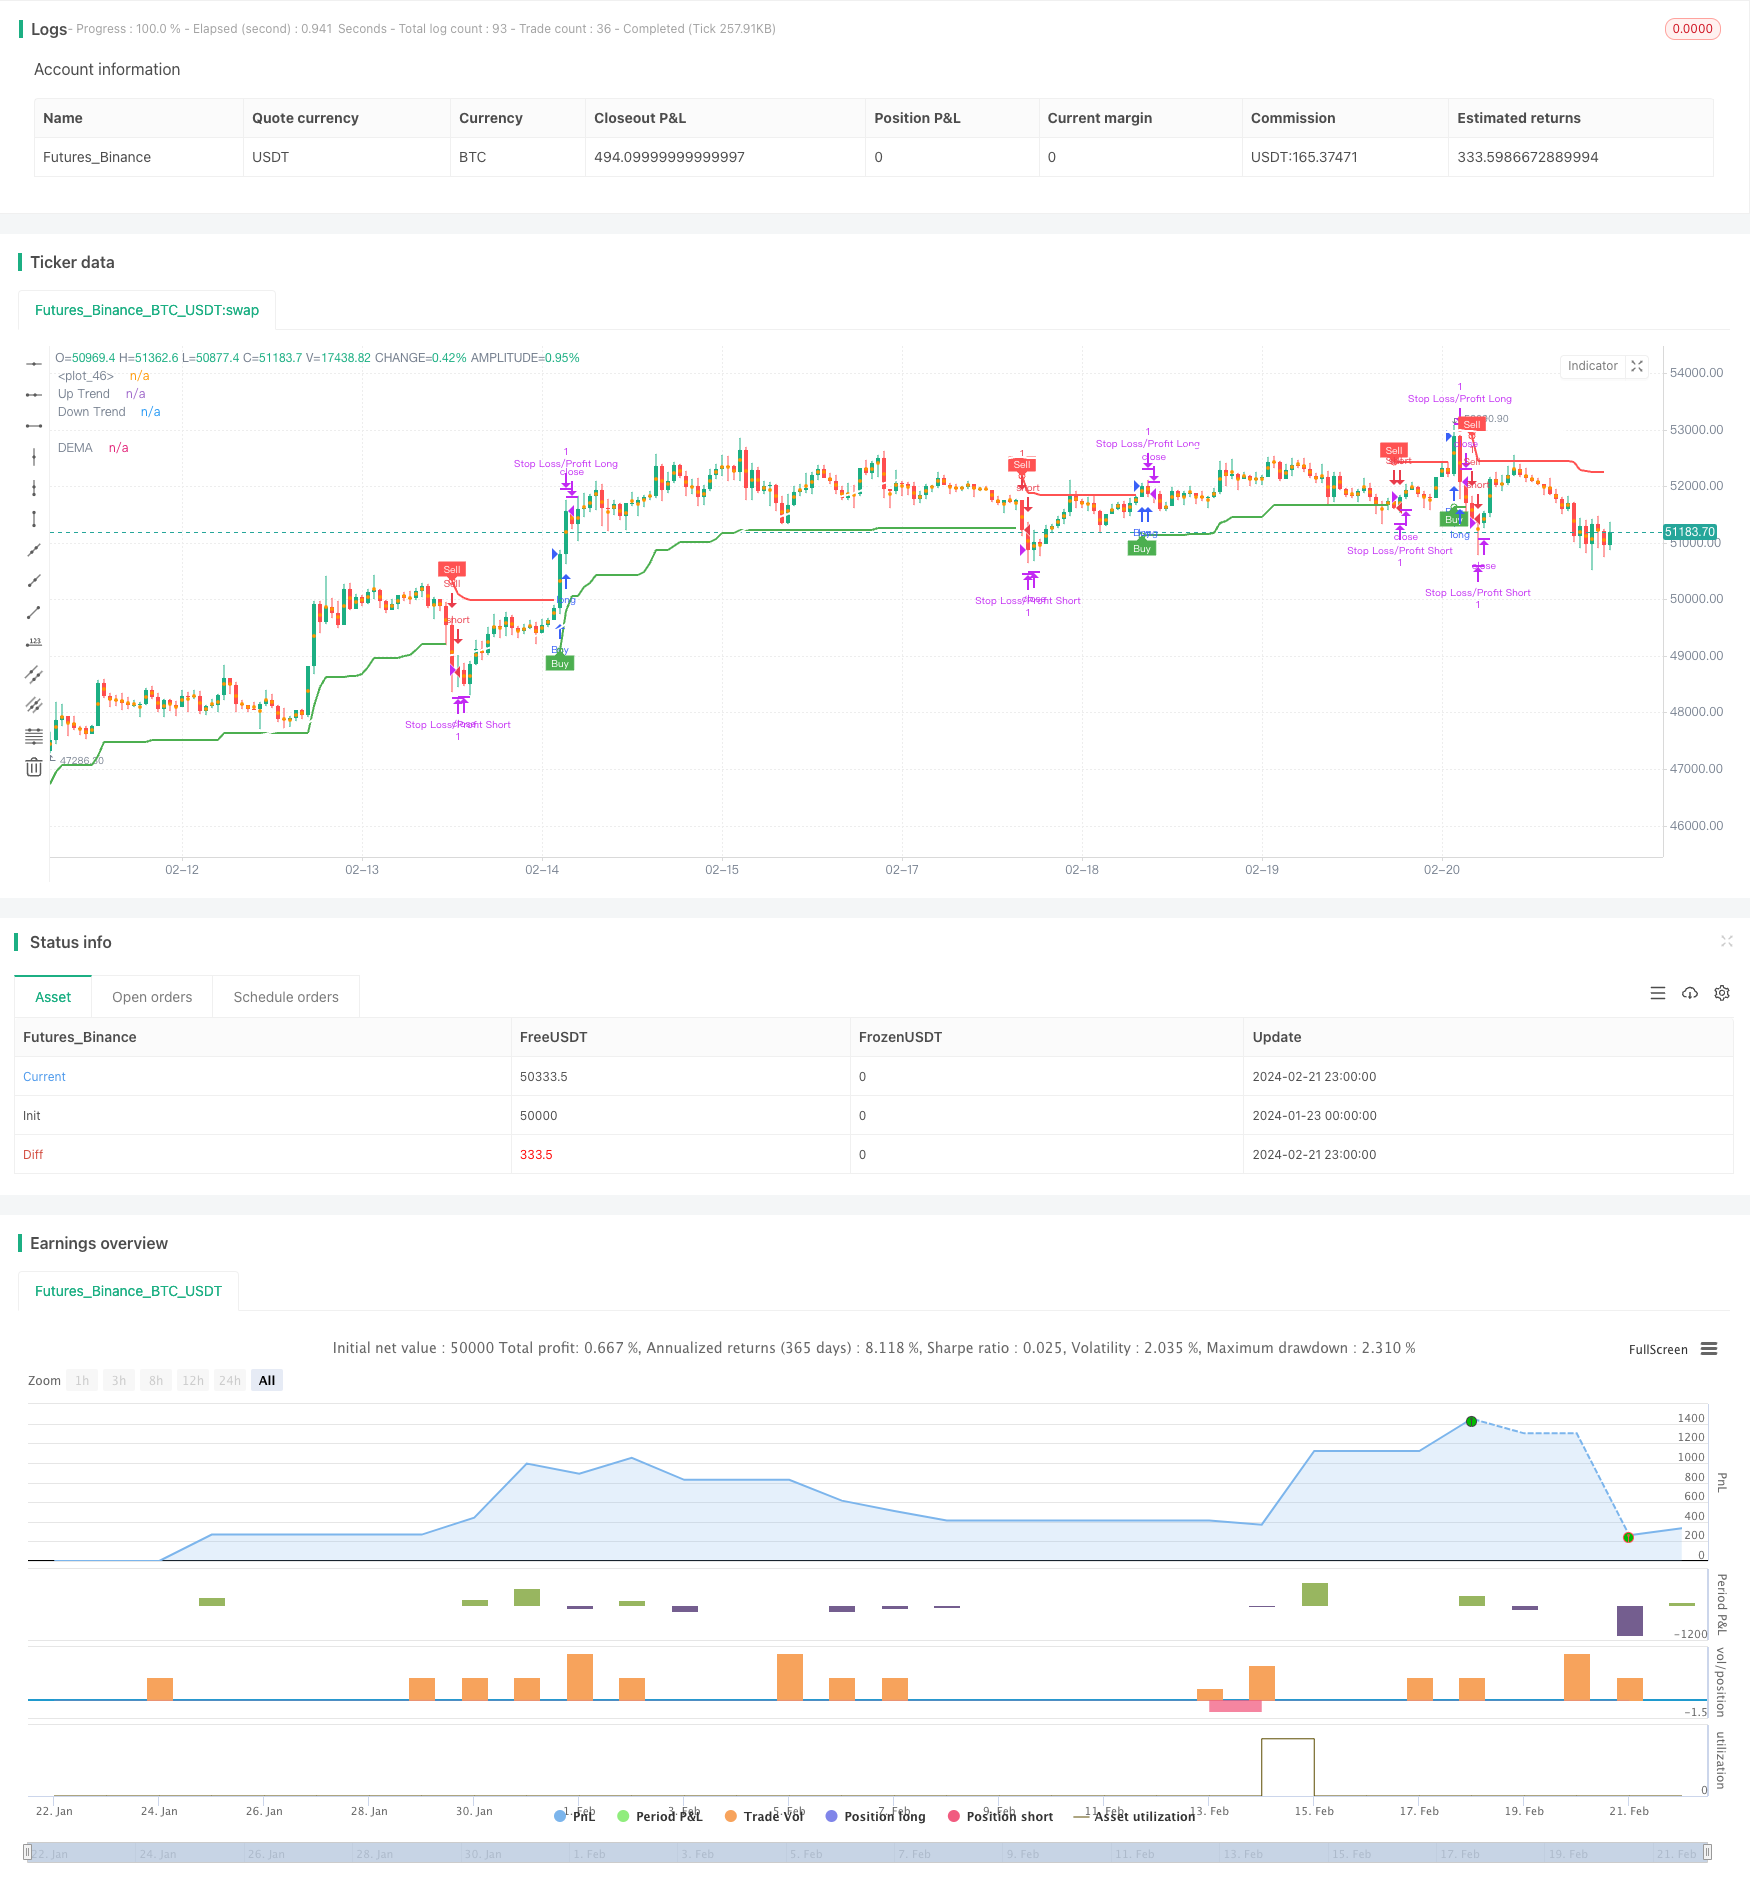
当价格上穿上轨时产生买入信号;当价格下破下轨时产生卖出信号。在价格突破超趋势上轨或下轨时,会在相应的轨道上绘制标记和文字“Buy”或“Sell”。同时发送移动端信号。
双指数移动平均线被绘制在价格曲线的上方或下方,用白色表示。它用于判断总体趋势的方向。
布林带则用来寻找入市和止损的最佳时机。它的上下轨围绕价格波动形成一个通道,可以用来确定何时价格已经脱离常态范围,也就是波动过大时机。
在入市后,策略使用止损和止盈方式来锁定利润或者减少损失。通过设置止损价格和止盈价格来实现自动减仓。
该策略集成多种指标,可以充分发挥各指标的优势,实现更准确的交易信号。
超趋势具有过滤市场噪音的能力,避免交易频繁。双指数移动平均线可以判断大致趋势,避免逆势交易。布林带可以把握入市和止损的最佳时机。
使用移动端信号可以及时获得交易提示。自动止盈止损可以锁定利润和减少损失。
由于策略集成多个指标,增加了策略的复杂度,也增加了出错的概率。指标设置也可能导致错过交易机会或者产生错误信号。
此外,止损设置过于激进也可能造成损失放大。移动端信号的稳定性也会影响及时获利止损的效果。
可以测试不同的参数设置,寻找最佳参数组合。也可以根据不同市场调整参数。
可以尝试只使用部分指标,减少错误信号的概率。或者添加其他辅助指标进行优化。
止损和止盈条件也可以进行调整,设置追踪止损或者部分止损等方式。
该策略综合运用多种技术指标的优势实现交易信号的判断,具有较强的实用性。但也面临一定的风险,需要不断测试和优化才能真正运用自如并获取稳定收益。
||
This strategy integrates multiple technical indicators, including Supertrend, Dual Moving Average (DEMA), and Bollinger Bands, to take advantage of their strengths and generate more accurate trading signals.
The strategy uses a 12-period ATR and price average to calculate the upper and lower bands of Supertrend and identifies long and short signals when price breaks through those bands. Meanwhile, a 200-period DEMA serves as an auxiliary indicator for trend judgment. In addition, Bollinger Bands help determine the optimal timing for entries and stop losses.
Buy signals are generated when price breaks above the upper band. Sell signals are generated when price breaks below the lower band. When price breaks through Supertrend's upper or lower band, markers and the text "Buy" or "Sell" will be plotted at corresponding bands. Mobile alerts are also sent out simultaneously.
The DEMA is plotted above or below the price curve in white color for judging the overall market trend direction.
The Bollinger Bands are used to identify the best timing for entries and stop losses. Its upper and lower bands form a channel encompassing price fluctuations, which helps determine when prices have departed from their normal range, i.e. become excessively volatile.
After entering a trade, the strategy utilizes stop loss and take profit methods to lock in profits or reduce losses by setting stop loss price and take profit price for automatic position reduction.
Integrating multiple indicators allows this strategy to make the most of their individual strengths for generating more accurate trading signals.
Supertrend is capable of filtering out market noise and avoids over-trading. The DEMA can determine the general trend direction and prevent trading against the trend. Bollinger Bands pinpoint optimal timing for entries and stop losses.
Mobile alerts enable timely trading prompts. Automatic stop loss and take profit allow locking in profits and cutting losses.
The integration of multiple indicators increases the complexity of the strategy and the probability of errors. Indicator parameter settings could also lead to missing trading opportunities or generating false signals.
In addition, over-aggressive stop loss settings may amplify losses. The stability of mobile alerts also impacts the effectiveness of timely profit-taking and stop losses.
Different parameter combinations could be tested to find the optimal parameter set. Parameters can also be adjusted based on different market conditions.
Attempting standalone usage of individual indicators may reduce false signals. Supplementary indicators could also be added for further optimization.
Stop loss and take profit criteria are also subject to adjustments such as trailing stop loss and partial stop loss.
This strategy combines the strengths of multiple technical indicators for trade signal generation and has relatively high practicality. But it also faces certain risks and requires continual testing and optimization to be effectively and profitably employed.
[/trans]
Strategy Arguments
| Argument | Default | Description |
|---|---|---|
| v_input_1 | 12 | ATR Period |
| v_input_2_hl2 | 0 | Source: hl2 |
| v_input_3 | 3 | ATR Multiplier |
| v_input_4 | true | Change ATR Calculation Method? |
| v_input_5 | true | Show Supertrend Indicator? |
| v_input_6 | 200 | DEMA Period |
| v_input_7 | true | Show DEMA Indicator? |
Source (PineScript)
/*backtest
start: 2024-01-23 00:00:00
end: 2024-02-22 00:00:00
period: 1h
basePeriod: 15m
exchanges: [{"eid":"Futures_Binance","currency":"BTC_USDT"}]
*/

// This Pine Script™ code is subject to the terms of the Mozilla Public License 2.0 at https://mozilla.org/MPL/2.0/
// © zhuenrong

//@version=4
strategy("Supertrend + DEMA + Bollinger Bands", overlay=true)

// Input parameters for Supertrend
atrLength = input(title="ATR Period", type=input.integer, defval=12)
src = input(hl2, title="Source")
multiplier = input(title="ATR Multiplier", type=input.float, step=0.1, defval=3.0)
changeATR = input(title="Change ATR Calculation Method?", type=input.bool, defval=true)
showSupertrend = input(title="Show Supertrend Indicator?", type=input.bool, defval=true)

// Input parameters for DEMA
demaLength = input(200, title="DEMA Period")
showDEMA = input(title="Show DEMA Indicator?", type=input.bool, defval=true)

// Calculate ATR for Supertrend
atr2 = sma(tr, atrLength)
atr = changeATR ? atr(atrLength) : atr2

// Calculate Supertrend
up = src - (multiplier * atr)
up1 = nz(up[1], up)
up := close[1] > up1 ? max(up, up1) : up

dn = src + (multiplier * atr)
dn1 = nz(dn[1], dn)
dn := close[1] < dn1 ? min(dn, dn1) : dn

trend = 1
trend := nz(trend[1], trend)
trend := trend == -1 and close > dn1 ? 1 : trend == 1 and close < up1 ? -1 : trend

// Plot Supertrend
upPlot = plot(showSupertrend ? (trend == 1 ? up : na) : na, title="Up Trend", style=plot.style_linebr, linewidth=2, color=color.new(color.green, 0))
buySignal = trend == 1 and trend[1] == -1
plotshape(buySignal ? up : na, title="UpTrend Begins", location=location.absolute, style=shape.circle, size=size.tiny, color=color.new(color.green, 0))
plotshape(buySignal ? up : na, title="Buy", text="Buy", location=location.absolute, style=shape.labelup, size=size.tiny, color=color.new(color.green, 0), textcolor=color.new(color.white, 0))

dnPlot = plot(showSupertrend ? (trend == 1 ? na : dn) : na, title="Down Trend", style=plot.style_linebr, linewidth=2, color=color.new(color.red, 0))
sellSignal = trend == -1 and trend[1] == 1
plotshape(sellSignal ? dn : na, title="DownTrend Begins", location=location.absolute, style=shape.circle, size=size.tiny, color=color.new(color.red, 0))
plotshape(sellSignal ? dn : na, title="Sell", text="Sell", location=location.absolute, style=shape.labeldown, size=size.tiny, color=color.new(color.red, 0), textcolor=color.new(color.white, 0))

mPlot = plot(ohlc4, title="", style=plot.style_circles, linewidth=0)

longFillColor = (trend == 1 ? color.new(color.green, 80) : color.new(color.white, 0))
shortFillColor = (trend == -1 ? color.new(color.red, 80) : color.new(color.white, 0))

fill(mPlot, upPlot, title="UpTrend Highlighter", color=longFillColor)
fill(mPlot, dnPlot, title="DownTrend Highlighter", color=shortFillColor)

// Alert conditions
alertcondition(buySignal, title="Custom Supertrend Buy", message="Custom Supertrend Buy!")
alertcondition(sellSignal, title="Custom Supertrend Sell", message="Custom Supertrend Sell!")

// Calculate DEMA
ema1 = ema(close, demaLength)
dema = 2 * ema1 - ema(ema1, demaLength)

// Plot DEMA with white color
plot(showDEMA ? dema : na, color=color.new(color.white, 0), title="DEMA", linewidth=2)
// Add push notification on mobile if buy and sell occurred
if (buySignal)
    strategy.entry("Buy", strategy.long)
    //strategy.exit("Sell")
    //alert("Buy Signal - Supertrend")

if (sellSignal)
    strategy.entry("Sell", strategy.short)
    //strategy.exit("Cover")
    //alert("Sell Signal - Supertrend")


// === Stop LOSS ===

if strategy.position_size>0
    strategy.exit("Stop Loss/Profit Long","Buy", stop=strategy.position_avg_price*100, limit=strategy.position_avg_price*1.1)
if strategy.position_size<0
    strategy.exit("Stop Loss/Profit Short","Sell", stop=strategy.position_avg_price*100, limit=strategy.position_avg_price*1.1)
Detail
https://www.fmz.com/strategy/442634
Last Modified
2024-02-23 13:58:36