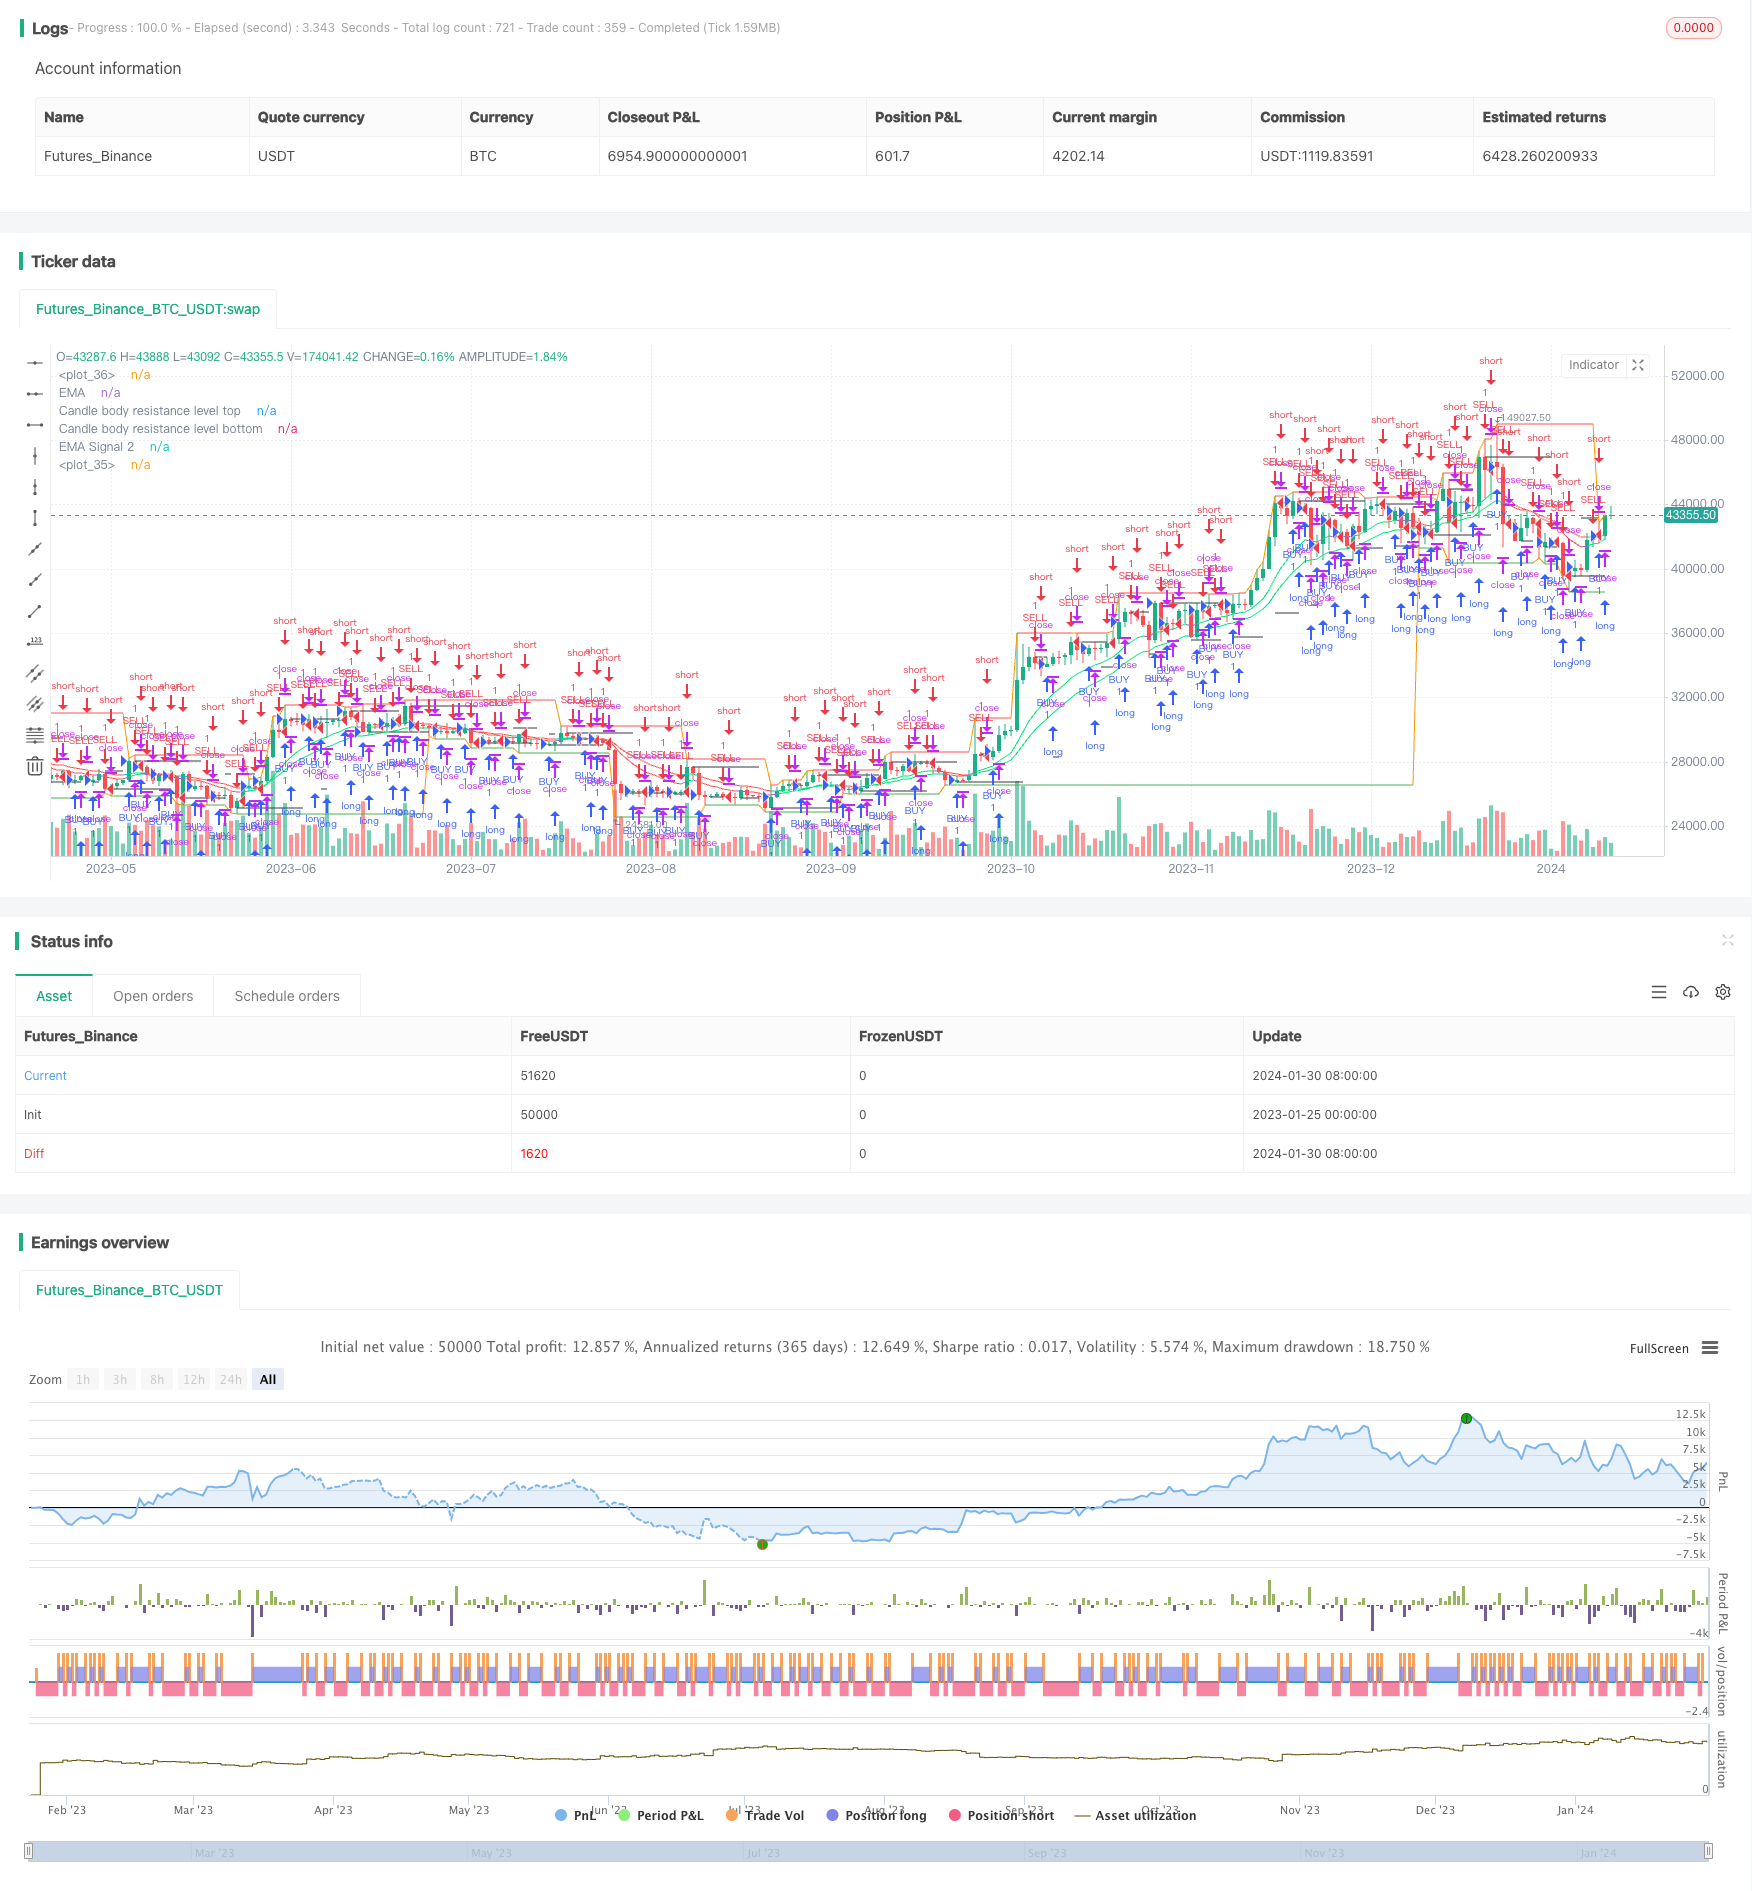
Name
耐心剖析K线蕴含宝贵信息的三重均线波段策略The-Triple-Moving-Average-Channel-Strategy-for-Patiently-Mining-Valuable-Information-from-Candlestick-Lines
Author
ChaoZhang
Strategy Description
三重均线波段策略运用多条移动平均线指标,通过对K线进行深入分析挖掘隐藏在价格波动之中的规律,实现低风险套利交易。
该策略在布林线基础上叠加多组EMA指标,构建价格通道,发现价格波动规律。具体来说:
- 使用BodyResistanceChannel指标绘制K线实体阻力位。
- 使用Support/Resistance指标绘制多日支撑和阻力位。
- 使用双EMA系统判断价格趋势方向。
- 使用Hull均线指标平滑价格曲线。
在此基础上结合形态识别,判断反转机会,制定套利交易策略。
该策略具有以下优势:
- 使用多组EMA构建价格通道,可明确判断价格波动走向。
- 应用Hull均线指标可有效平滑价格突破判断。
- 结合反转形态和通道指标,实现高概率低风险交易。
- 构建多层指标体系,交易信号稳定可靠。
该策略也存在以下风险:
- 价格通道破裂引发巨额亏损的风险。针对性解决方案是采用移动止损,降低单笔损失。
- 反转形态判断错误引发错误信号的风险。针对性解决方案是优化参数,提高形态判断准确率。
- 指标参数不匹配导致交易信号质量下降的风险。针对性解决方案是多组合参数优化测试。
该策略主要可优化的方向有:
- 优化EMA周期参数组合,使指标更加匹配市场特征。
- 调整止损位置,在保证盈利的前提下最大限度降低单笔亏损风险。
- 增加基于波动率的动态仓位调整模块,有效控制风险。
- 利用深度学习技术挖掘更多价格规律,提高信号质量。
三重均线波段策略深入挖掘价格波动规律,稳定高效,值得长期应用与持续优化。投资需要理性和耐心,渐进做单才是致胜之道。
||
The triple moving average channel strategy utilizes multiple moving average indicators to deeply analyze candlestick chart and unearth hidden rules behind price fluctuations, thus achieving low-risk arbitrage trading.
This strategy stacks multiple EMA metrics on top of Bollinger Bands to build price channels and discover patterns in price volatility. Specifically:
- The BodyResistanceChannel indicator is used to plot resistance levels of candle body.
- The Support/Resistance indicator is leveraged to draw multi-day support and resistance levels.
- The dual EMA system helps determine the trend direction.
- The Hull MA indicator smoothes the price curve.
On this basis, reversal opportunities are identified through pattern recognition to formulate arbitrage strategies.
The advantages of this strategy include:
- Building price channels with multiple EMAS helps clearly determine price trend.
- The Hull MA indicator effectively smoothes out price breakouts.
- Combining reversal patterns and channel indicators allows high-probability and low-risk trading.
- Constructing a multi-layer indicator system ensures stable and reliable trading signals.
Potential risks of this strategy also exist:
- The risk of huge losses when price channel is breached. The solution is to adopt moving stop loss to reduce per trade loss.
- The risk of wrong signals when reversal pattern recognition goes wrong. The solution is parameter optimization to improve pattern accuracy.
- The risk of deteriorating signal quality when indicator parameters mismatch. The solution is multi-parameter optimization testing.
The main optimization directions include:
- Optimize combinations of EMA period parameters to better suit market conditions.
- Adjust stop loss levels to maximize per trade return while minimizing per trade loss risk.
- Introduce dynamic position sizing module based on volatility to effectively manage risks.
- Utilize deep learning technologies to uncover more price patterns and improve signal quality.
The triple moving average channel strategy deeply mines price movement regularity with stability and efficiency, worthy of long-term application and continuous optimization. Investing requires rationality and patience, progressive position scaling is the key to success.
[/trans]
Strategy Arguments
| Argument | Default | Description |
|---|---|---|
| v_input_1_close | 0 | Candle body resistance Channel: close |
| v_input_2 | false | Bar Channel On/Off |
| v_input_3 | 10 | Support / Resistance length: |
| v_input_4 | 13 | EMA 1 |
| v_input_5 | 21 | EMA 2 |
| v_input_6 | false | Display Hull MA Set: |
| v_input_7_close | 0 | Hull MA's Source:: close |
| v_input_8 | 8 | Hull MA's Base Length: |
| v_input_9 | 5 | Hull MA's Length Scalar: |
| v_input_10 | 720 | Piriod |
Source (PineScript)
/*backtest
start: 2023-01-25 00:00:00
end: 2024-01-31 00:00:00
period: 1d
basePeriod: 1h
exchanges: [{"eid":"Futures_Binance","currency":"BTC_USDT"}]
*/

//@version=3
//╭╮╱╱╭╮╭╮╱╱╭╮
//┃╰╮╭╯┃┃┃╱╱┃┃
//╰╮┃┃╭┻╯┣╮╭┫╰━┳╮╭┳━━╮
//╱┃╰╯┃╭╮┃┃┃┃╭╮┃┃┃┃━━┫
//╱╰╮╭┫╰╯┃╰╯┃╰╯┃╰╯┣━━┃
//╱╱╰╯╰━━┻━━┻━━┻━━┻━━╯
//╭━━━┳╮╱╱╱╱╱╱╱╭╮
//┃╭━╮┃┃╱╱╱╱╱╱╱┃┃
//┃┃╱╰┫╰━┳━━┳━╮╭━╮╭━━┫┃
//┃┃╱╭┫╭╮┃╭╮┃╭╮┫╭╮┫┃━┫┃
//┃╰━╯┃┃┃┃╭╮┃┃┃┃┃┃┃┃━┫╰╮
//╰━━━┻╯╰┻╯╰┻╯╰┻╯╰┻━━┻━╯
//━╯
// http://www.vdubus.co.uk/
strategy(title='Vdub FX SniperVX3 / Strategy  v3', shorttitle='Vdub_FX_SniperVX3_Strategy', overlay=true, pyramiding=0, initial_capital=1000, currency=currency.USD)

//Candle body resistance Channel-----------------------------//
len = 34
src = input(close, title="Candle body resistance Channel")
out = sma(src, len)
last8h = highest(close, 13)
lastl8 = lowest(close, 13)
bearish = cross(close,out) == 1 and falling(close, 1)
bullish = cross(close,out) == 1 and rising(close, 1)
channel2=input(false, title="Bar Channel On/Off")
ul2=plot(channel2?last8h:last8h==nz(last8h[1])?last8h:na, color=black, linewidth=1, style=linebr, title="Candle body resistance level top", offset=0)
ll2=plot(channel2?lastl8:lastl8==nz(lastl8[1])?lastl8:na, color=black, linewidth=1, style=linebr, title="Candle body resistance level bottom", offset=0)
//fill(ul2, ll2, color=black, transp=95, title="Candle body resistance Channel")

//-----------------Support and Resistance
RST = input(title='Support / Resistance length:', defval=10)
RSTT = valuewhen(high >= highest(high, RST), high, 0)
RSTB = valuewhen(low <= lowest(low, RST), low, 0)
RT2 = plot(RSTT, color=RSTT != RSTT[1] ? na : red, linewidth=1, offset=+0)
RB2 = plot(RSTB, color=RSTB != RSTB[1] ? na : green, linewidth=1, offset=0)

//--------------------Trend colour ema------------------------------------------------//
src0 = close, len0 = input(13, minval=1, title="EMA 1")
ema0 = ema(src0, len0)
direction = rising(ema0, 2) ? +1 : falling(ema0, 2) ? -1 : 0
plot_color = direction > 0  ? lime: direction < 0 ? red : na
plot(ema0, title="EMA", style=line, linewidth=1, color = plot_color)

//-------------------- ema 2------------------------------------------------//
src02 = close, len02 = input(21, minval=1, title="EMA 2")
ema02 = ema(src02, len02)
direction2 = rising(ema02, 2) ? +1 : falling(ema02, 2) ? -1 : 0
plot_color2 = direction2 > 0  ? lime: direction2 < 0 ? red : na
plot(ema02, title="EMA Signal 2", style=line, linewidth=1, color = plot_color2)

//=============Hull MA//
show_hma = input(false, title="Display Hull MA Set:")
hma_src = input(close, title="Hull MA's Source:")
hma_base_length = input(8, minval=1, title="Hull MA's Base Length:")
hma_length_scalar = input(5, minval=0, title="Hull MA's Length Scalar:")
hullma(src, length)=>wma(2*wma(src, length/2)-wma(src, length), round(sqrt(length)))
plot(not show_hma ? na : hullma(hma_src, hma_base_length+hma_length_scalar*6), color=black, linewidth=2, title="Hull MA")

//============ signal Generator ==================================//
Piriod=input('720')
ch1 = request.security(syminfo.tickerid, Piriod, open)
ch2 = request.security(syminfo.tickerid, Piriod, close)
longCondition = crossover(request.security(syminfo.tickerid, Piriod, close),request.security(syminfo.tickerid, Piriod, open))
if (longCondition)
    strategy.entry("BUY", strategy.long)
shortCondition = crossunder(request.security(syminfo.tickerid, Piriod, close),request.security(syminfo.tickerid, Piriod, open))
if (shortCondition)
    strategy.entry("SELL", strategy.short)

///////////////////////////////////////////////////////////////////////////////////////////
Detail
https://www.fmz.com/strategy/440693
Last Modified
2024-02-01 11:12:47