Name
收缩带Bollinger与RSI组合策略Bollinger-Bands-and-RSI-Combination-Strategy
Author
ChaoZhang
Strategy Description
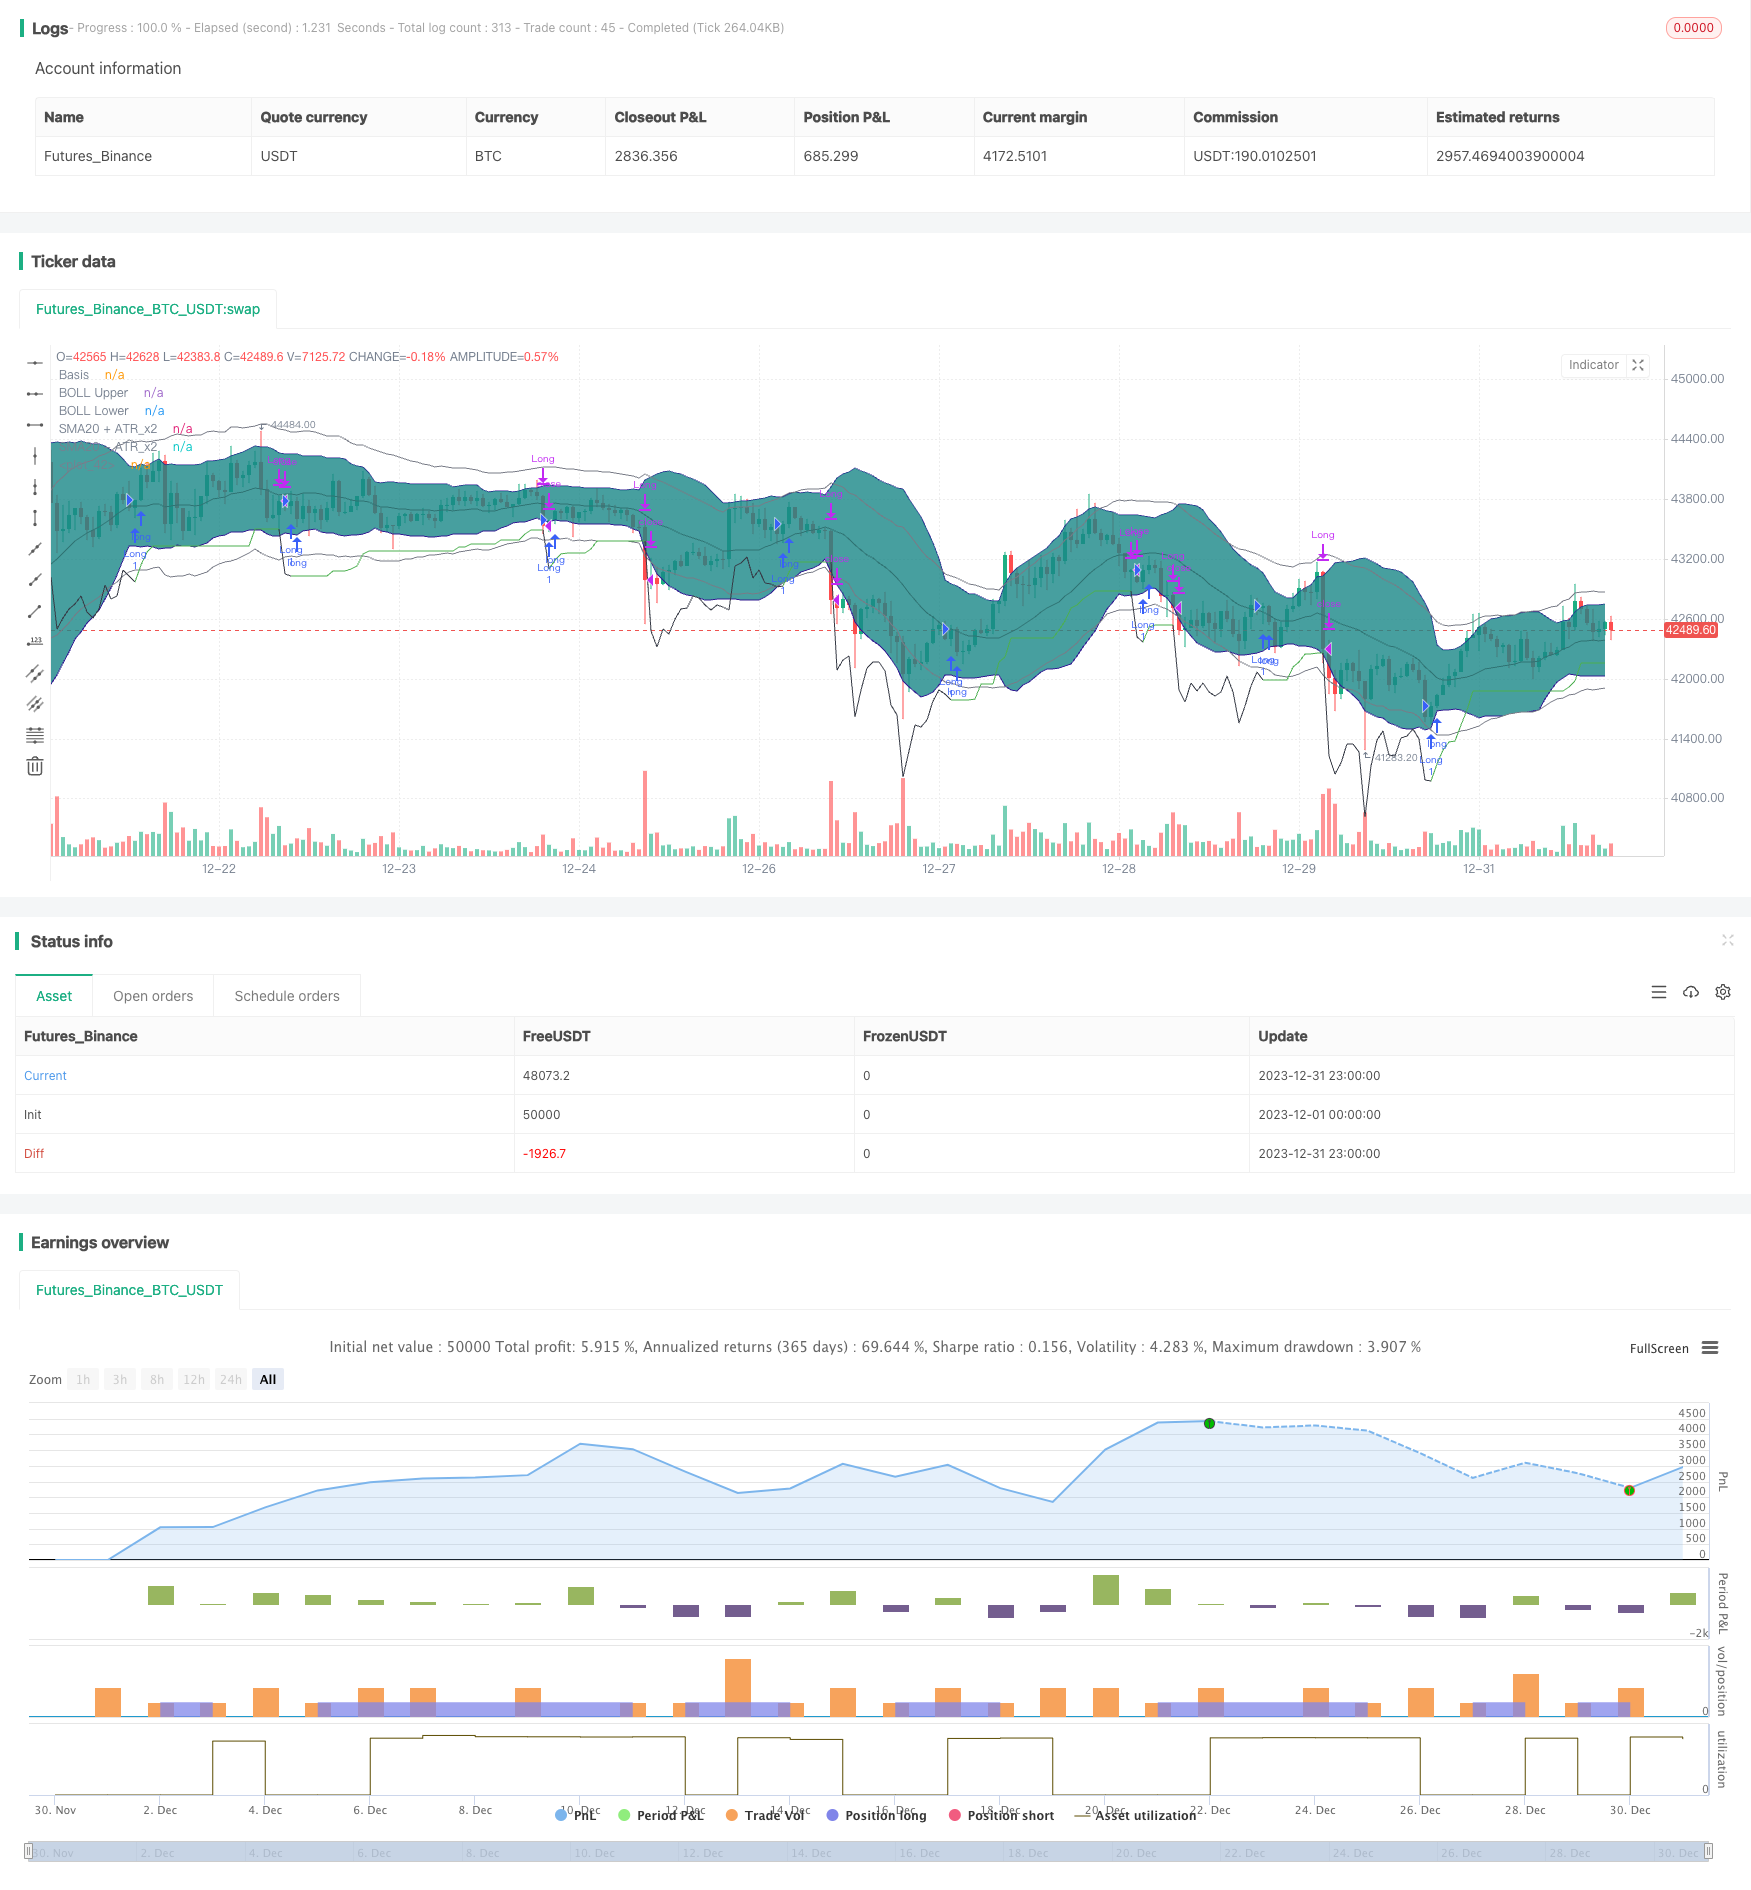
该策略将布林带和相对强弱指标(RSI)组合使用,识别出布林带收缩期配合RSI上升的机会,采取趋势跟踪止损以控制风险。
本策略的交易逻辑核心在于识别布林带的收缩,并在RSI呈上升态势时判断趋势处于上涨初期。具体来说,当20日布林带中轨上的标准差小于ATR*2时,我们判定布林带发生收缩;同时,若10日和14日的RSI都呈上升趋势,那么我们预测价格即将突破布林带上轨,采取做多策略。
进入场内后,我们采用ATR安全距离+随价格上涨的止损方式来锁定利润并控制风险。当价格超过止损线或RSI过热(14日RSI超过70,10日RSI超过14日RSI)时平仓。
本策略最大优势在于利用布林带收缩来判断行情整理期,结合RSI指标预测价格的突破方向。此外,采用适应性止损而不是固定止损,可以根据市场波动程度来灵活调整,从而在保证风险可控的前提下获得更大收益。
本策略的主要风险在于识别布林带收缩和RSI上升时,行情可能是假突破。此外,在止损方面,波动过大时适应性止损可能无法及时止损。可以通过改进止损方式(例如曲线止损)来降低此风险。
本策略可以从以下几个方面进行优化:
-
改进布林带参数设置,优化判断收缩效果
-
尝试不同的RSI周期参数
-
测试其他止损方式(曲线止损、回看止损等)的效果
-
根据不同品种特性调整参数
本策略综合利用布林带和RSI的互补性,在控制风险的前提下获得较好回撤收益比。后续可从止损方式、参数选择等方面进行优化,使策略更适用于不同交易品种。
||
This strategy combines Bollinger Bands and Relative Strength Index (RSI) to identify opportunities when Bollinger Bands are squeezing and RSI is rising, with trailing stop loss to control risks.
The core logic of this strategy is to identify Bollinger Bands squeeze and predict price breakout when RSI is in uptrend. Specifically, when 20-period BB middle band standard deviation is less than ATR*2, we determine BB squeeze happening; meanwhile, if both 10 and 14 period RSI are rising, we predict prices may break above BB upper band soon and go long.
After entering the market, we use ATR safety distance + adaptive stop loss to lock profit and manage risks. Positions will be closed when price hits stop loss or RSI becomes overbought (14-period RSI above 70 and 10-period RSI exceeds 14).
The biggest advantage of this strategy is to identify consolidation period with BB squeeze and predict breakout direction with RSI. Also, using adaptive stop loss based on market volatility rather than fixed stop loss can better lock profit while controlling risk.
The major risk of this strategy is misidentification of BB squeeze and RSI uptrend, which may lead to false breakout. Besides, adaptive stop loss may fail to close positions timely during high volatility. Improving stop loss methods like curve stop loss can mitigate this risk.
This strategy can be further optimized in the following aspects:
-
Improve BB parameters to identify squeeze more accurately
-
Test different values for RSI periods
-
Examine other stop loss techniques like curve SL or back-looking SL
-
Adjust parameters based on symbol characteristics
This strategy leverages the complementarity of BB and RSI to achieve good risk-adjusted returns. Further optimizations on aspects like stop loss and parameter tuning can make it fit better for different trading instruments.
[/trans]
Strategy Arguments
| Argument | Default | Description |
|---|---|---|
| v_input_1 | timestamp(01 Apr 2016 13:30 +0000) | Backtest Start Time |
| v_input_2 | false | Define backtest end-time (If false, will test up to most recent candle) |
| v_input_3 | timestamp(01 May 2021 19:30 +0000) | Backtest End Time (if checked above) |
| v_input_4 | true | No. of candles to lookback when determining ATR is decreasing |
| v_input_5 | 70 | [Exit] RSI(14) value considered as overbought |
Source (PineScript)
/*backtest
start: 2023-12-01 00:00:00
end: 2023-12-31 23:59:59
period: 1h
basePeriod: 15m
exchanges: [{"eid":"Futures_Binance","currency":"BTC_USDT"}]
*/

// This source code is subject to the terms of the Mozilla Public License 2.0 at https://mozilla.org/MPL/2.0/
// © DojiEmoji
//

//@version=4
strategy("[KL] BOLL + RSI Strategy",overlay=true,pyramiding=1)

// Timeframe {
backtest_timeframe_start = input(defval = timestamp("01 Apr 2016 13:30 +0000"), title = "Backtest Start Time", type = input.time)
USE_ENDTIME = input(false,title="Define backtest end-time (If false, will test up to most recent candle)")
backtest_timeframe_end = input(defval = timestamp("01 May 2021 19:30 +0000"), title = "Backtest End Time (if checked above)", type = input.time)
within_timeframe = true
// }

// Bollinger bands (sdv=2, len=20) {
BOLL_length = 20, BOLL_src = close, SMA20 = sma(BOLL_src, BOLL_length), BOLL_sDEV_x2 = 2 * stdev(BOLL_src, BOLL_length)
BOLL_upper = SMA20 + BOLL_sDEV_x2, BOLL_lower = SMA20 - BOLL_sDEV_x2
plot(SMA20, "Basis", color=#872323, offset = 0)
BOLL_p1 = plot(BOLL_upper, "BOLL Upper", color=color.navy, offset = 0, transp=50)
BOLL_p2 = plot(BOLL_lower, "BOLL Lower", color=color.navy, offset = 0, transp=50)
fill(BOLL_p1, BOLL_p2, title = "Background", color=#198787, transp=85)
// }

// Volatility Indicators {
ATR_x2 = atr(BOLL_length) * 2 // multiplier aligns with BOLL
avg_atr = sma(ATR_x2, input(1,title="No. of candles to lookback when determining ATR is decreasing"))
plot(SMA20+ATR_x2, "SMA20 + ATR_x2", color=color.gray, offset = 0, transp=50)
plot(SMA20-ATR_x2, "SMA20 - ATR_x2", color=color.gray, offset = 0, transp=50)
plotchar(ATR_x2, "ATR_x2", "", location = location.bottom)
//}

// Trailing stop loss {
TSL_source = low
var entry_price = float(0), var stop_loss_price = float(0)

trail_profit_line_color = color.green
if strategy.position_size == 0 or not within_timeframe
    trail_profit_line_color := color.black
    stop_loss_price := TSL_source - ATR_x2
else if strategy.position_size > 0
    stop_loss_price := max(stop_loss_price, TSL_source - ATR_x2)
plot(stop_loss_price, color=trail_profit_line_color)

if strategy.position_size > 0 and stop_loss_price > stop_loss_price[1]
	alert("Stop loss limit raised", alert.freq_once_per_bar)

// } end of Trailing stop loss

//Buy setup - Long positions {
is_squeezing = ATR_x2 > BOLL_sDEV_x2
if is_squeezing and within_timeframe and not is_squeezing[1]
	alert("BOLL bands are squeezing", alert.freq_once_per_bar)
else if not is_squeezing and within_timeframe and is_squeezing[1]
	alert("BOLL bands stopped squeezing", alert.freq_once_per_bar)

ema_trend = ema(close, 20)

concat(a, b) =>
	concat = a
	if a != ""
		concat := concat + ", "
	concat := concat + b
	concat
// }

// Sell setup - Long position {
rsi_10 = rsi(close, 10), rsi_14 = rsi(close, 14)
overbought = rsi_14 > input(70,title="[Exit] RSI(14) value considered as overbought") and rsi_10 > rsi_14
// } end of Sell setup - Long position

// MAIN: {
if within_timeframe
	entry_msg = ""
	exit_msg = ""

    // ENTRY {
	conf_count = 0
    volat_decr = avg_atr <= avg_atr[1]
	rsi_upslope = rsi_10 > rsi_10[1] and rsi_14 > rsi_14[1]

	if volat_decr and rsi_upslope and is_squeezing and strategy.position_size == 0
		strategy.entry("Long",strategy.long, comment=entry_msg)
		entry_price := close
		stop_loss_price := TSL_source - ATR_x2
	// }

    // EXIT	{
	if strategy.position_size > 0
		bExit = false
		if close <= entry_price and TSL_source <= stop_loss_price
            exit_msg := concat(exit_msg, "stop loss [TSL]")
			bExit := true
        else if close > entry_price and TSL_source <= stop_loss_price
            exit_msg := concat(exit_msg, "take profit [TSL]")
            bExit := true
		else if overbought
			exit_msg := concat(exit_msg, "overbought")
			bExit := true

        strategy.close("Long", when=bExit, comment=exit_msg)
	// }
// }

// CLEAN UP:
if strategy.position_size == 0 and not is_squeezing
	entry_price := 0
	stop_loss_price := float(0)
Detail
https://www.fmz.com/strategy/440426
Last Modified
2024-01-30 15:15:32
