Name
支撑阻力震荡交易策略Quantitative-Support-and-Resistance-Oscillation-Strategy
Author
ChaoZhang
Strategy Description
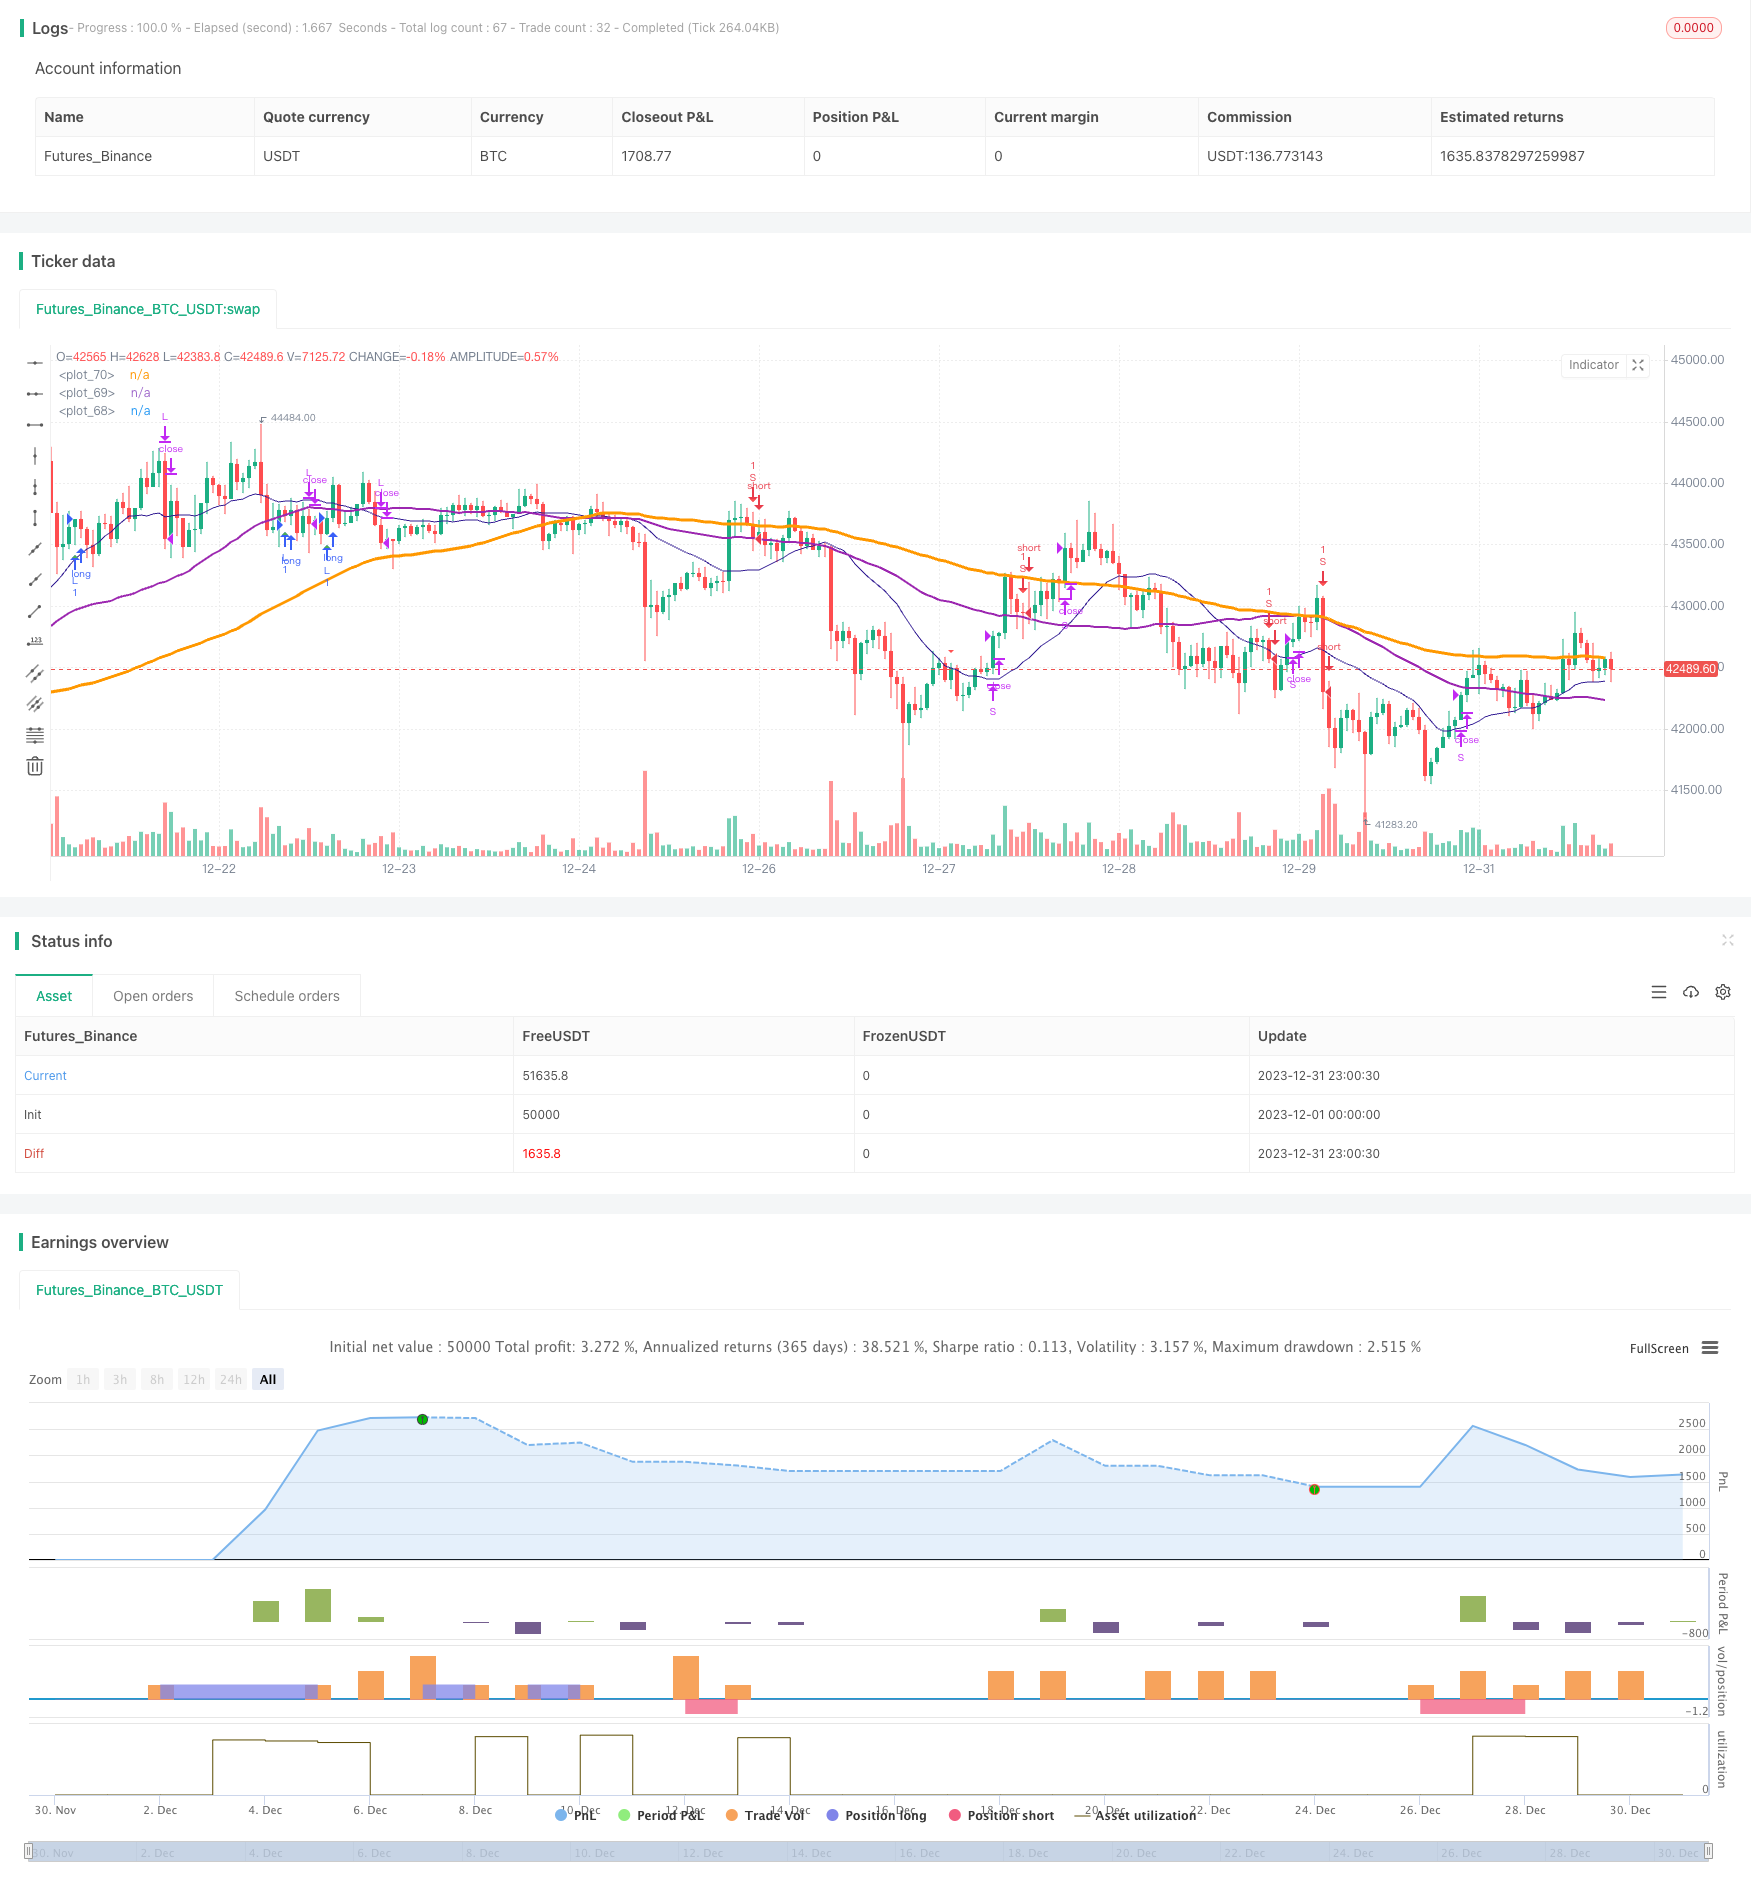
本策略通过结合RSI、随机指标的交叉策略,结合平仓滑点优化策略,实现了交易逻辑的精确控制和准确止损止盈。同时,通过引入信号优化,可以更好地掌控趋势,实现资金的合理管理。
- RSI指标判断超买超卖区域,配合随机指标K值和D值的金叉死叉形成交易信号 。
- 引入对K线的分型识别,辅助判断趋势信号,避免错误交易。
- SMA均线辅助判断趋势方向。当短期均线从下向上突破长期均线时为看涨信号。
- 平仓滑点策略,根据最高价最低价波动范围来设置止损止盈价格。
- RSI指标参数优化,很好地判定超买超卖区域,避免错误交易
- STO指标参数优化,平滑度参数的调节,可以滤除噪声,提高信号质量
- 引入Heikin-Ashi技术分析,识别K线实体方向变化,确保交易信号准确性
- SMA均线辅助判断大趋势方向,避免逆势交易
- 结合止盈止损滑点策略,可以最大程度锁定每次交易的盈利
- 大盘持续下跌时,资金面临较大风险
- 交易频率可能过高,增加交易成本和滑点成本
- RSI指标容易形成虚假信号,应结合其他指标过滤
- 调整RSI参数,优化超买超卖判断
- 调整STO指标参数,平滑度和周期,提高信号质量
- 调整移动均线周期,优化趋势判断
- 引入更多技术指标,提高信号判断准确性
- 优化止损止盈比例,降低单次交易风险
该策略整合了多种主流技术指标优势,通过参数优化和规则完善,实现了交易信号质量和止盈止损的平衡。具有一定的通用性和稳定盈利能力。通过持续优化,可以进一步提高胜率和盈利率。
||
This strategy combines RSI crossover strategy with optimized stop loss strategy to achieve precise logic control and accurate stop loss and take profit. Meanwhile, by introducing signal optimization, it can better grasp the trend and achieve reasonable capital management.
- RSI indicator determines overbought and oversold area. Combined with K and D value golden cross and dead cross to form trading signals.
- Introduces candlestick pattern recognition to assist in judging trend signals to avoid wrong trades.
- SMA lines assist in determining trend direction. Uptrend when short period SMA breaks out upper long period SMA.
- RSI parameter optimization determines overbought and oversold area precisely to avoid wrong trades.
- STO parameter optimization, smoothness adjustment filters out noise and improves signal quality.
- Heikin-Ashi technology introduced to recognize candlestick direction change and ensure accurate trading signals.
- SMA lines assist judging major trend direction, avoids trading against the trend.
- Stop loss strategy locks in maximum profit for each trade.
- Facing greater risk when market continues going down.
- High trading frequency increases trading cost and slippage cost.
- RSI tends to generate false signals, needs filtering by other indicators.
- Adjust RSI parameters, optimize overbought oversold judgement.
- Adjust STO parameters, smoothness and period to improve signal quality.
- Adjust moving average period to optimize trend judgement.
- Introduce more technical indicators to improve signal accuracy.
- Optimize stop loss ratio to reduce single trade risk.
The strategy integrates advantages of multiple mainstream technical indicators. Through parameter optimization and logic refinement, it balances trading signal quality and stop loss. With certain versatility and steady profitability. Further optimization can improve win rate and profitability. [/trans]
Strategy Arguments
| Argument | Default | Description |
|---|---|---|
| v_input_1 | 3 | smoothK |
| v_input_2 | 3 | smoothD |
| v_input_3 | 14 | lengthRSI |
| v_input_4 | 14 | lengthStoch |
| v_input_5 | 80 | overbought |
| v_input_6 | 20 | oversold |
| v_input_7 | 100 | smaLengh |
| v_input_8 | 50 | smaLengh2 |
| v_input_9 | 20 | smaLengh3 |
| v_input_10_close | 0 | RSI Source: close |
| v_input_11 | 2017 | Backtest Start Year |
| v_input_12 | true | Backtest Start Month |
| v_input_13 | true | Backtest Start Day |
Source (PineScript)
/*backtest
start: 2023-12-01 00:00:00
end: 2023-12-31 23:59:59
period: 1h
basePeriod: 15m
exchanges: [{"eid":"Futures_Binance","currency":"BTC_USDT"}]
*/

//@version=4
//study(title="@sentenzal strategy", shorttitle="@sentenzal strategy", overlay=true)
strategy(title="@sentenzal strategy", shorttitle="@sentenzal strategy", overlay=true  )
smoothK = input(3, minval=1)
smoothD = input(3, minval=1)
lengthRSI = input(14, minval=1)
lengthStoch = input(14, minval=1)
overbought = input(80, minval=1)
oversold = input(20, minval=1)
smaLengh = input(100, minval=1)
smaLengh2 = input(50, minval=1)
smaLengh3 = input(20, minval=1)

src = input(close, title="RSI Source")
testStartYear = input(2017, "Backtest Start Year")
testStartMonth = input(1, "Backtest Start Month")
testStartDay = input(1, "Backtest Start Day")
testPeriodStart = timestamp(testStartYear,testStartMonth,testStartDay,0,0)
testPeriod() =>
    time >= testPeriodStart ? true : false

rsi1 = rsi(src, lengthRSI)
k = sma(stoch(rsi1, rsi1, rsi1, lengthStoch), smoothK)
d = sma(k, smoothD)
crossBuy = crossover(k, d) and k < oversold
crossSell = crossunder(k, d) and k > overbought

dcLower = lowest(low, 10)
dcUpper = highest(high, 10)


heikinashi_close = security(heikinashi(syminfo.tickerid), timeframe.period, close)
heikinashi_open = security(heikinashi(syminfo.tickerid), timeframe.period, open)
heikinashi_low = security(heikinashi(syminfo.tickerid), timeframe.period, low)
heikinashi_high = security(heikinashi(syminfo.tickerid), timeframe.period, high)
heikinashiPositive = heikinashi_close >= heikinashi_open

heikinashiBuy = heikinashiPositive == true and heikinashiPositive[1] == false  and heikinashiPositive[2] == false
heikinashiSell = heikinashiPositive == false and heikinashiPositive[1] == true and heikinashiPositive[2] == true

//plotshape(heikinashiBuy, style=shape.arrowup, color=green, location=location.belowbar, size=size.tiny)
//plotshape(heikinashiSell, style=shape.arrowdown, color=red, location=location.abovebar, size=size.tiny)

buy = (crossBuy == true or crossBuy[1] == true or crossBuy[2] == true) and (heikinashiBuy == true or heikinashiBuy[1] == true or heikinashiBuy[2] == true)
sell = (crossSell == true or crossSell[1] == true or crossSell[2] == true) and (heikinashiSell == true or heikinashiSell[1] == true or heikinashiSell[2] == true)

mult = timeframe.period == '15' ? 4 : 1
mult2 = timeframe.period == '240' ? 0.25 : mult

movingAverage = sma(close, round(smaLengh))
movingAverage2 = sma(close, round(smaLengh2))
movingAverage3 = sma(close, round(smaLengh3))

uptrend = movingAverage < movingAverage2 and movingAverage2 < movingAverage3 and close > movingAverage
downtrend = movingAverage > movingAverage2 and movingAverage2 > movingAverage3 and close < movingAverage

signalBuy = (buy[1] == false and buy[2] == false and buy == true) and uptrend
signalSell = (sell[1] == false and sell[2] == false and sell == true) and downtrend

takeProfitSell = (buy[1] == false and buy[2] == false and buy == true) and uptrend == false
takeProfitBuy = (sell[1] == false and sell[2] == false and sell == true)  and uptrend

plotshape(signalBuy, style=shape.triangleup, color=green, location=location.belowbar, size=size.tiny)
plotshape(signalSell, style=shape.triangledown, color=red, location=location.abovebar, size=size.tiny)


plot(movingAverage, linewidth=3, color=orange, transp=0)
plot(movingAverage2, linewidth=2, color=purple, transp=0)
plot(movingAverage3, linewidth=1, color=navy, transp=0)

alertcondition(signalBuy, title='Signal Buy', message='Signal Buy')
alertcondition(signalSell, title='Signal Sell', message='Signal Sell')


strategy.close("L", when=dcLower[1] > low)
strategy.close("S", when=dcUpper[1] < high)

strategy.entry("L", strategy.long, 1, when = signalBuy and testPeriod() and uptrend)
strategy.entry("S", strategy.short, 1, when = signalSell and testPeriod() and uptrend ==false)

//strategy.exit("Exit Long", from_entry = "L", loss = 25000000, profit=25000000)
//strategy.exit("Exit Short", from_entry = "S", loss = 25000000, profit=25000000)
Detail
https://www.fmz.com/strategy/439993
Last Modified
2024-01-25 15:53:06
