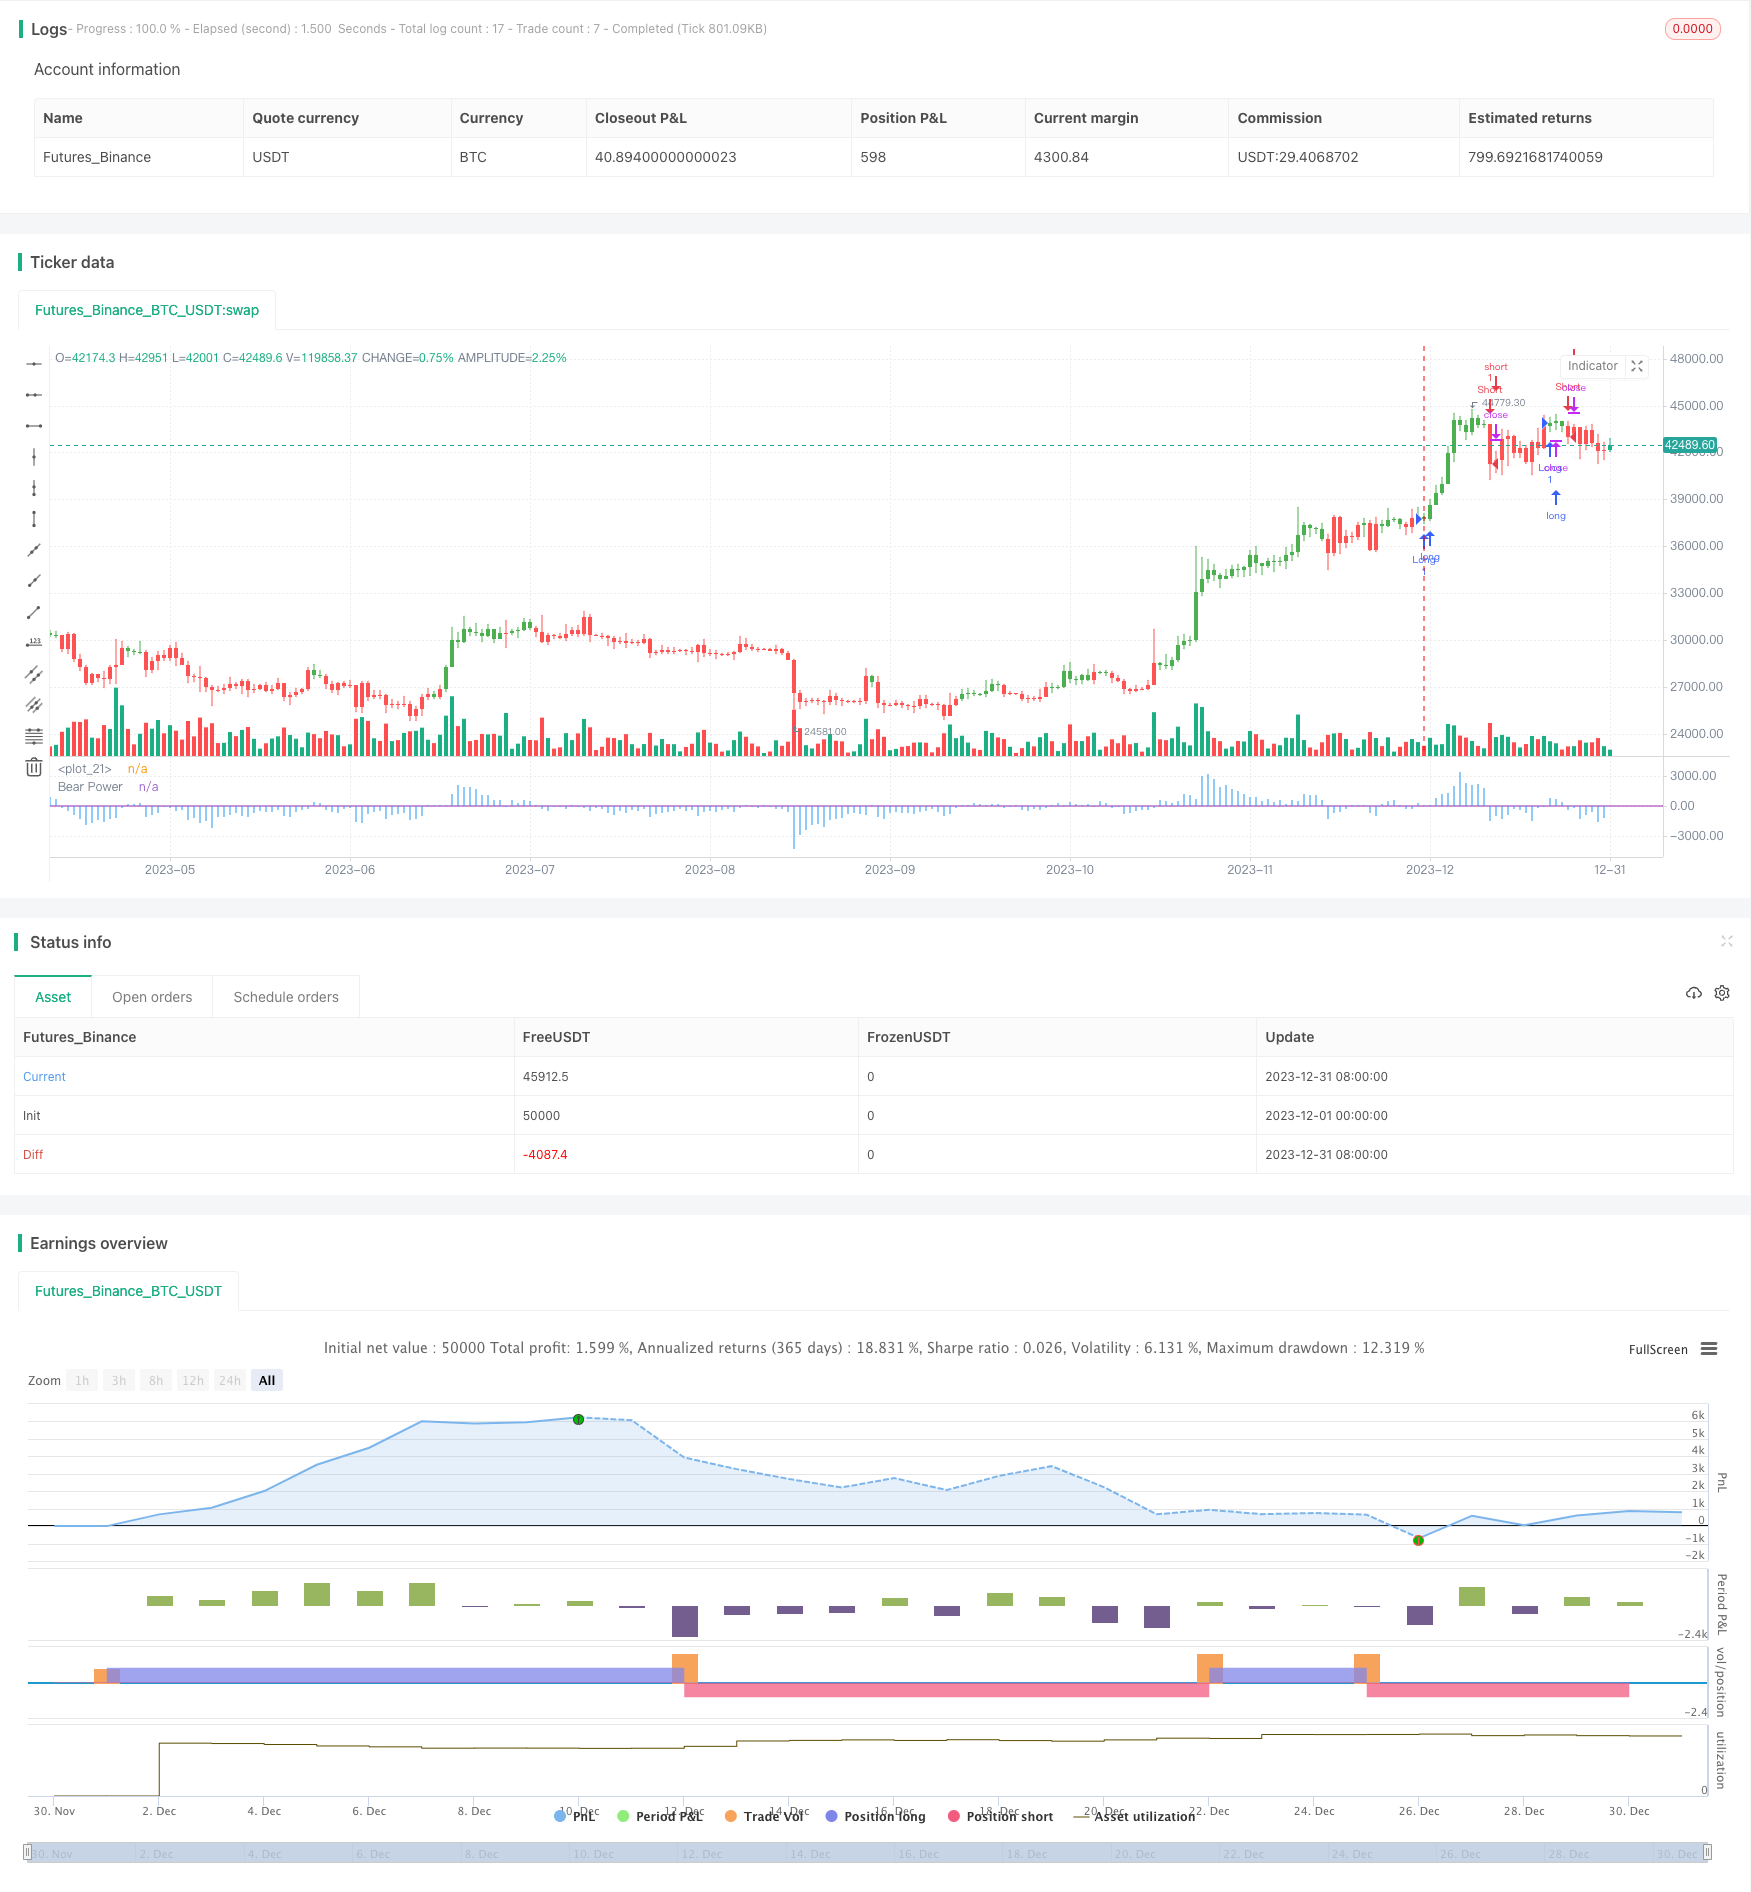
Name
承压指标追踪策略Bear-Power-Tracking-Strategy
Author
ChaoZhang
Strategy Description
承压指标追踪策略是根据Alexander Elder博士的Elder Ray指标设计的,用于测量市场的买入和卖出压力。该策略采用13日指数移动平均线来表示市场价值的共识,使用承压指标来测量卖方将价格推低共识价值的能力。
该策略的核心指标是承压指标,它由当日最低价减去13日指数移动平均线计算得到。当承压指标上穿指定阈值时做多,下穿时做空。它反映了卖方将价格压低平均共识价值的能力。
另外,多空方向还可以通过“交易反转”参数切换。该参数为布尔类型,默认为False。当其为True时,信号发出时做反向操作。
该策略简单实用,通过一个指标判断多空方向,容易实现。
该策略具有以下优势:
- 使用单一指标,实现简单,容易理解和应用
- 可灵活调整参数,适用于不同市场环境
- 可选择反转交易,丰富策略类型
该策略也存在一些风险:
- 单一指标容易产生假信号
- 未考虑止损,可能造成较大损失
- 参数不当可能导致过于频繁交易
可通过多指标确认,设置止损,调整参数等方式进一步优化。
该策略可优化的几个方向:
- 增加其他指标过滤信号,如MACD,KDJ等,避免假突破
- 加入移动止损来限制亏损
- 优化指标参数,调整入场退出点
- 可以考虑结合股票基本面选股
- 可以和其他策略组合使用
承压指标追踪策略概念简单,通过比较单一指标和指定阈值来判断 entrada 和 salida,容易操作。但作为基于指标的策略,可优化空间还很大,可从指标、止损、股票筛选等方面进行综合优化,使策略更稳定可靠。
||
The Bear Power Tracking Strategy is designed based on Dr. Alexander Elder's Elder Ray indicator to measure buying and selling pressure in the market. It uses a 13-day exponential moving average (EMA) to indicate the market consensus of value and uses the Bear Power indicator to measure the ability of sellers to push prices below the consensus value.
The core indicator of this strategy is Bear Power, which is calculated by subtracting the 13-day EMA from the daily low price. It reflects the ability of sellers to push prices below the average consensus of value.
When Bear Power crosses above the specified threshold, a long position is opened. When it crosses below, a short position is opened.
In addition, the long/short direction can also be switched via the "Reverse Trade" boolean parameter, which reverses the signal when set to True.
The strategy is simple and easy to implement with one indicator judging direction.
The advantages of this strategy include:
- Simple to understand and implement with a single indicator
- Flexible parameter adjustment for different market environments
- Reversal trade enrichs strategy types
There are also some risks:
- False signals may be generated with a single indicator
- No stop loss may lead to huge losses
- Improper parameters may cause over-trading
Confirmation with multiple indicators, stop loss and parameter tuning could help optimize it.
Some directions to optimize the strategy:
- Add other indicators like MACD, KDJ to filter signals
- Add moving stop loss to limit losses
- Optimize indicator parameters for entry and exit points
- Fundamental analysis stock selection
- Combine with other strategies
The Bear Power Tracking Strategy has a simple concept of judging entry and exit by comparing one indicator to a threshold. As a indicator-based strategy, there is still large room for optimization in aspects like indicators, stop loss and stock selection to make it more steady and reliable.
[/trans]
Strategy Arguments
| Argument | Default | Description |
|---|---|---|
| v_input_1 | 13 | Length |
| v_input_2 | false | Trigger |
| v_input_3 | false | Trade reverse |
Source (PineScript)
/*backtest
start: 2023-12-01 00:00:00
end: 2023-12-31 23:59:59
period: 1d
basePeriod: 1h
exchanges: [{"eid":"Futures_Binance","currency":"BTC_USDT"}]
*/

//@version = 2
////////////////////////////////////////////////////////////
//  Copyright by HPotter v1.0 07/12/2016
// Developed by Dr Alexander Elder, the Elder-ray indicator measures buying
// and selling pressure in the market. The Elder-ray is often used as part
// of the Triple Screen trading system but may also be used on its own.
// Dr Elder uses a 13-day exponential moving average (EMA) to indicate the
// market consensus of value. Bear Power measures the ability of sellers to
// drive prices below the consensus of value. Bear Power reflects the ability
// of sellers to drive prices below the average consensus of value.
// Bull Power is calculated by subtracting the 13-day EMA from the day's High.
// Bear power subtracts the 13-day EMA from the day's Low.
// You can use in the xPrice any series: Open, High, Low, Close, HL2, HLC3, OHLC4 and ect...
// You can change long to short in the Input Settings
// Please, use it only for learning or paper trading. Do not for real trading.
////////////////////////////////////////////////////////////
strategy(title="Elder Ray (Bear Power) Strategy Backtest")
Length = input(13, minval=1)
Trigger = input(0)
reverse = input(false, title="Trade reverse")
hline(0, color=purple, linestyle=line)
xPrice = close
xMA = ema(xPrice,Length)
DayLow = iff(dayofmonth != dayofmonth[1], low, min(low, nz(DayLow[1])))
nRes = DayLow - xMA
pos = iff(nRes > Trigger, 1,
	   iff(nRes < Trigger, -1, nz(pos[1], 0)))
possig = iff(reverse and pos == 1, -1,
         iff(reverse and pos == -1, 1, pos))
if (possig == 1)
    strategy.entry("Long", strategy.long)
if (possig == -1)
    strategy.entry("Short", strategy.short)
barcolor(possig == -1 ? red: possig == 1 ? green : blue )
plot(nRes, color=blue, title="Bear Power", style = histogram)
Detail
https://www.fmz.com/strategy/438463
Last Modified
2024-01-12 11:43:08
