Name
多时间框架RSI策略Multi-Timeframe-RSI-Strategy
Author
ChaoZhang
Strategy Description
[trans]
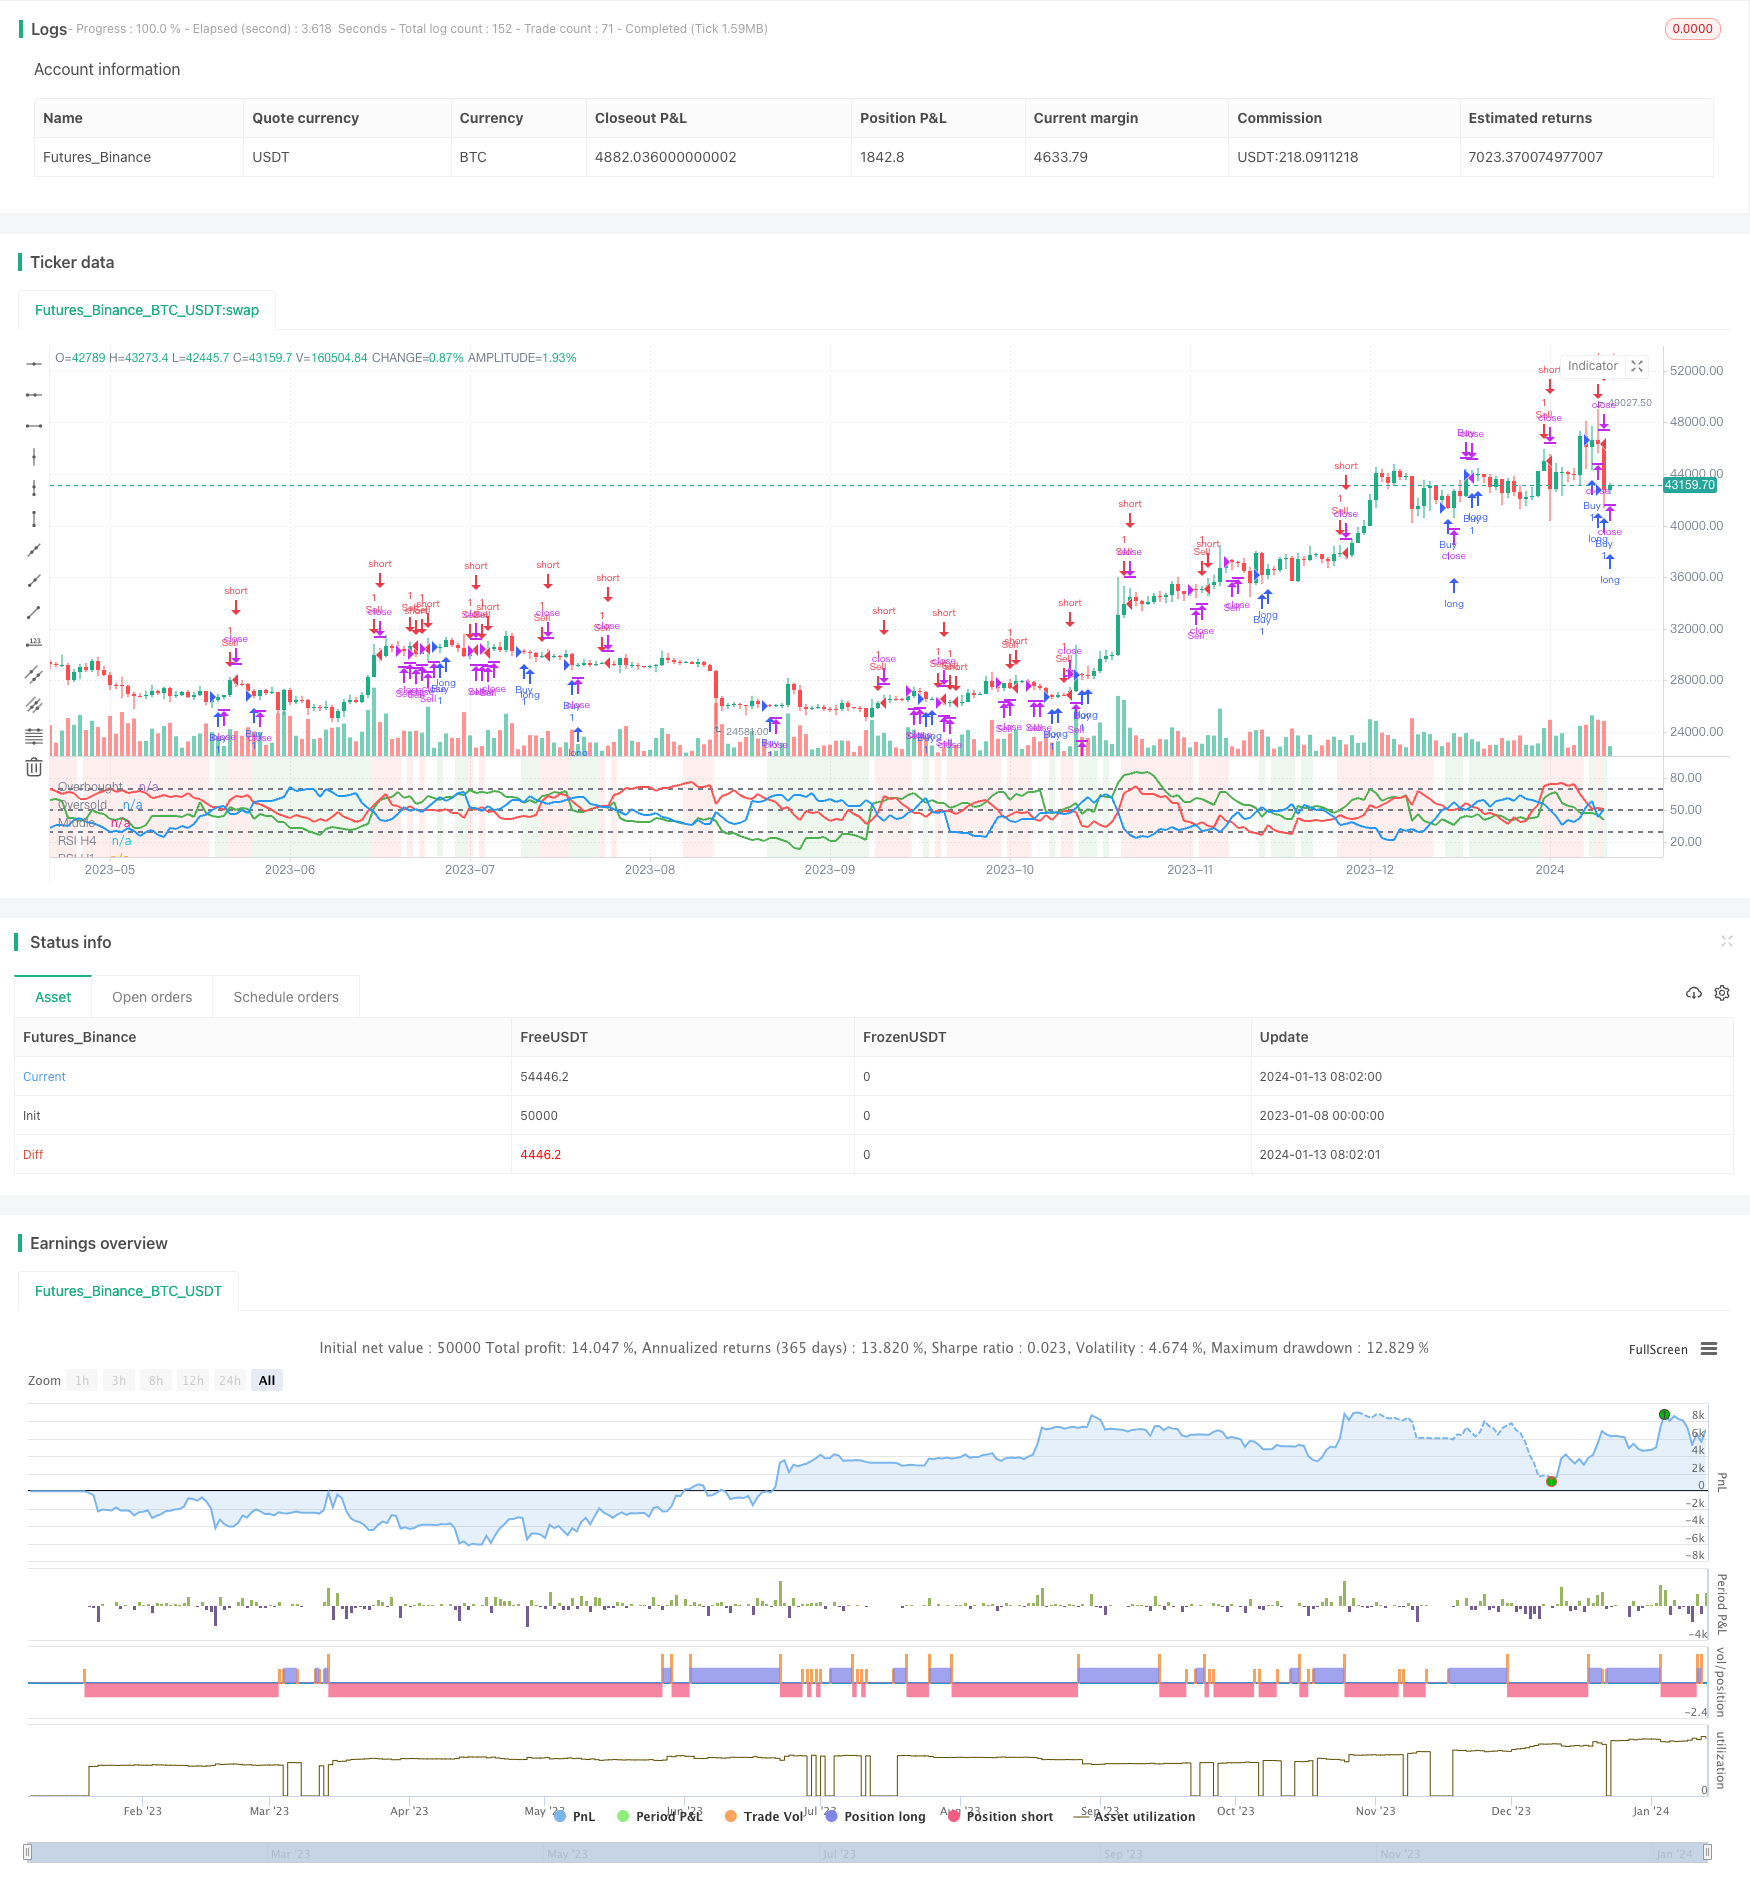
多时间框架RSI策略通过比较不同时间周期的RSI指标,判断市场趋势和 extremity,产生交易信号。该策略同时结合三种时间周期的RSI指标-15分钟、1小时和4小时,在保证交易频率的同时提高判断准确性。
该策略的核心指标是相对强弱指数(RSI)。RSI通过比较一段时期内的平均收盘涨幅和平均收盘跌幅,判断过去一段时间内市场是处于超买还是超卖状态。当RSI高于70时为超买区,低于30时为超卖区。
本策略采用15分钟、1小时和4小时三个时间周期的RSI。首先,比较15分钟RSI与其他两个时间周期的RSI值,判断趋势一致性。其次,当15分钟RSI低于30时产生买入信号,高于70时产生卖出信号。最后,结合趋势一致性判断和extremity判断,确定入场时机。
多时间框架RSI策略最大的优势在于可同时兼顾判断准确性和交易频率。相比单一时间周期,多周期可提高判断可靠性,同时15分钟周期保证了交易频率。此外,RSI指标本身对突破判断非常敏感,能提前反应趋势转折。
该策略面临的主要风险是产生大量假信号。由于采用了多个时间周期,当周期之间不一致时,会增加判断难度并误导交易决策。此外,RSI指标对盘整市也更敏感,容易产生错误信号。
为控制风险,建议采用止损机制,同时测试和优化RSI的参数,寻找最佳平衡点。此外,可以考虑结合其他指标进行确认,避免过多依赖单一指标。
该策略可从以下几个方面进行优化:
-
测试更多时间周期的组合,寻找最佳参数配置
-
优化RSI的超买超卖阈值
-
结合其他指标确认信号
-
增加止损和止盈规则
通过继续测试和优化,可使策略参数达到最优配置,从而提高策略稳定性。
多时间框架RSI策略综合利用了RSI指标和多时间框架分析的优势。通过比较不同周期指标的值,可实现对市场趋势和extremity的有效判断。与单一指标和时间框架相比,该策略可明显提高判断准确率。通过后续的测试和优化,可将该策略打造成稳定可靠的量化交易系统。
||
The Multi Timeframe RSI strategy generates trading signals by comparing RSI indicators across different timeframes to determine market trend and extremity. It incorporates RSI from three timeframes - 15mins, 1hr, and 4hr - to ensure both trading frequency and judgment accuracy.
The core indicator of this strategy is Relative Strength Index (RSI). RSI compares the average gain and average loss over a period to determine if the market is overbought or oversold. Values above 70 indicate overbought conditions while values below 30 indicate oversold conditions.
This strategy utilizes 15mins, 1hr and 4hr RSI. First, it compares 15mins RSI with the other two timeframes to determine trend consistency. Second, it generates buy signals when 15mins RSI crosses below 30 and sell signals when 15mins RSI goes above 70. Finally, entry signals are confirmed by combining trend consistency and extremity judgments.
The biggest advantage of multi timeframe RSI strategy is it balances judgment accuracy and trading frequency. Multiple timeframes improve reliability while 15mins timeframe ensures frequency. Also, RSI is very sensitive in detecting trend reversals ahead of price action.
The main risk is generating excessive false signals. Inconsistencies between periods can increase difficulty in judgment and mislead trading decisions. Also, RSI is more sensitive to ranging markets, prone to wrong signals.
To control risk, stop losses should be implemented. RSI parameters should be tested and optimized to find the best balance. Confirmation from other indicators should be considered instead of solely relying on RSI.
The strategy can be improved in the following ways:
-
Test more timeframe combinations to find optimal parameters
-
Optimize overbought and oversold threshold levels of RSI
-
Incorporate other indicators for signal confirmation
-
Add stop loss and take profit rules
Further testing and optimization will lead to best parameter configuration for higher strategy stability.
The multi timeframe RSI strategy effectively utilizes the advantages of RSI indicator and multiple timeframes analysis to determine market trend and extremity. Compared to single indicator and timeframe systems, it can significantly improve judgment accuracy. With further testing and optimization, this strategy can be refined into a robust automated trading system.
[/trans]
Source (PineScript)
/*backtest
start: 2023-01-08 00:00:00
end: 2024-01-14 00:00:00
period: 1d
basePeriod: 1h
exchanges: [{"eid":"Futures_Binance","currency":"BTC_USDT"}]
*/

//@version=5
strategy("Multi-Timeframe RSI", overlay=false)

// Lấy dữ liệu RSI từ các biểu đồ khác nhau
rsiM15 = request.security(syminfo.tickerid, "15", ta.rsi(close, 14))
rsiH1 = request.security(syminfo.tickerid, "60", ta.rsi(close, 14))
rsiH4 = request.security(syminfo.tickerid, "240", ta.rsi(close, 14))

// Vẽ đường RSI của M15
plot(rsiM15, title="RSI M15", color=color.blue, linewidth=2)

// Vẽ đường RSI của H1
plot(rsiH1, title="RSI H1", color=color.red, linewidth=2)

// Vẽ đường RSI của H4
plot(rsiH4, title="RSI H4", color=color.green, linewidth=2)

// Điều kiện mua: RSI của M15 > RSI của H1 và RSI của M15 > RSI của H4
buyCondition = rsiM15 > rsiH1 and rsiM15 > rsiH4

// Điều kiện bán: RSI của M15 < RSI của H1 và RSI của M15 < RSI của H4
sellCondition = rsiM15 < rsiH1 and rsiM15 < rsiH4

// Điều kiện đóng lệnh buy: RSI của M15 < RSI của H1
closeBuyCondition = rsiM15 < rsiH1

// Điều kiện đóng lệnh sell: RSI của M15 > RSI của H1
closeSellCondition = rsiM15 > rsiH1

// Vẽ đường Overbought (70)
hline(70, "Overbought", color=color.gray, linewidth=2)

// Vẽ đường Oversold (30)
hline(30, "Oversold", color=color.gray, linewidth=2)

// Vẽ đường Middle (50)
hline(50, "Middle", color=color.gray, linewidth=2)

// Đánh dấu điều kiện mua và bán
bgcolor(buyCondition ? color.new(color.green, 90) : sellCondition ? color.new(color.red, 90) : na)

// Mã chiến lược
if (buyCondition)
    strategy.entry("Buy", strategy.long)
if (sellCondition)
    strategy.entry("Sell", strategy.short)

// Điều kiện đóng lệnh buy
if (closeBuyCondition)
    strategy.close("Buy")

// Điều kiện đóng lệnh sell
if (closeSellCondition)
    strategy.close("Sell")
Detail
https://www.fmz.com/strategy/438798
Last Modified
2024-01-15 14:15:32