Name
基于RSI的追踪趋势策略Trend-Following-RSI-Scalping-Strategy
Author
ChaoZhang
Strategy Description
根据技术分析,RSI指标高于70应代表超买状态,因此属于卖出信号。加密货币代表了一个全新的资产类别,它重塑了技术分析的概念。FOMO型购买可以产生很强的力量,使得数字资产可以在超买状态下保持足够长的时间,为追踪上涨趋势提供了良好的短线交易机会。
构建一个基于通常被认为是反向指标的RSI的追踪趋势交易策略,这看起来似乎违反直觉。但是通过200多次回测证明,这是一个非常有趣的长期策略设置。
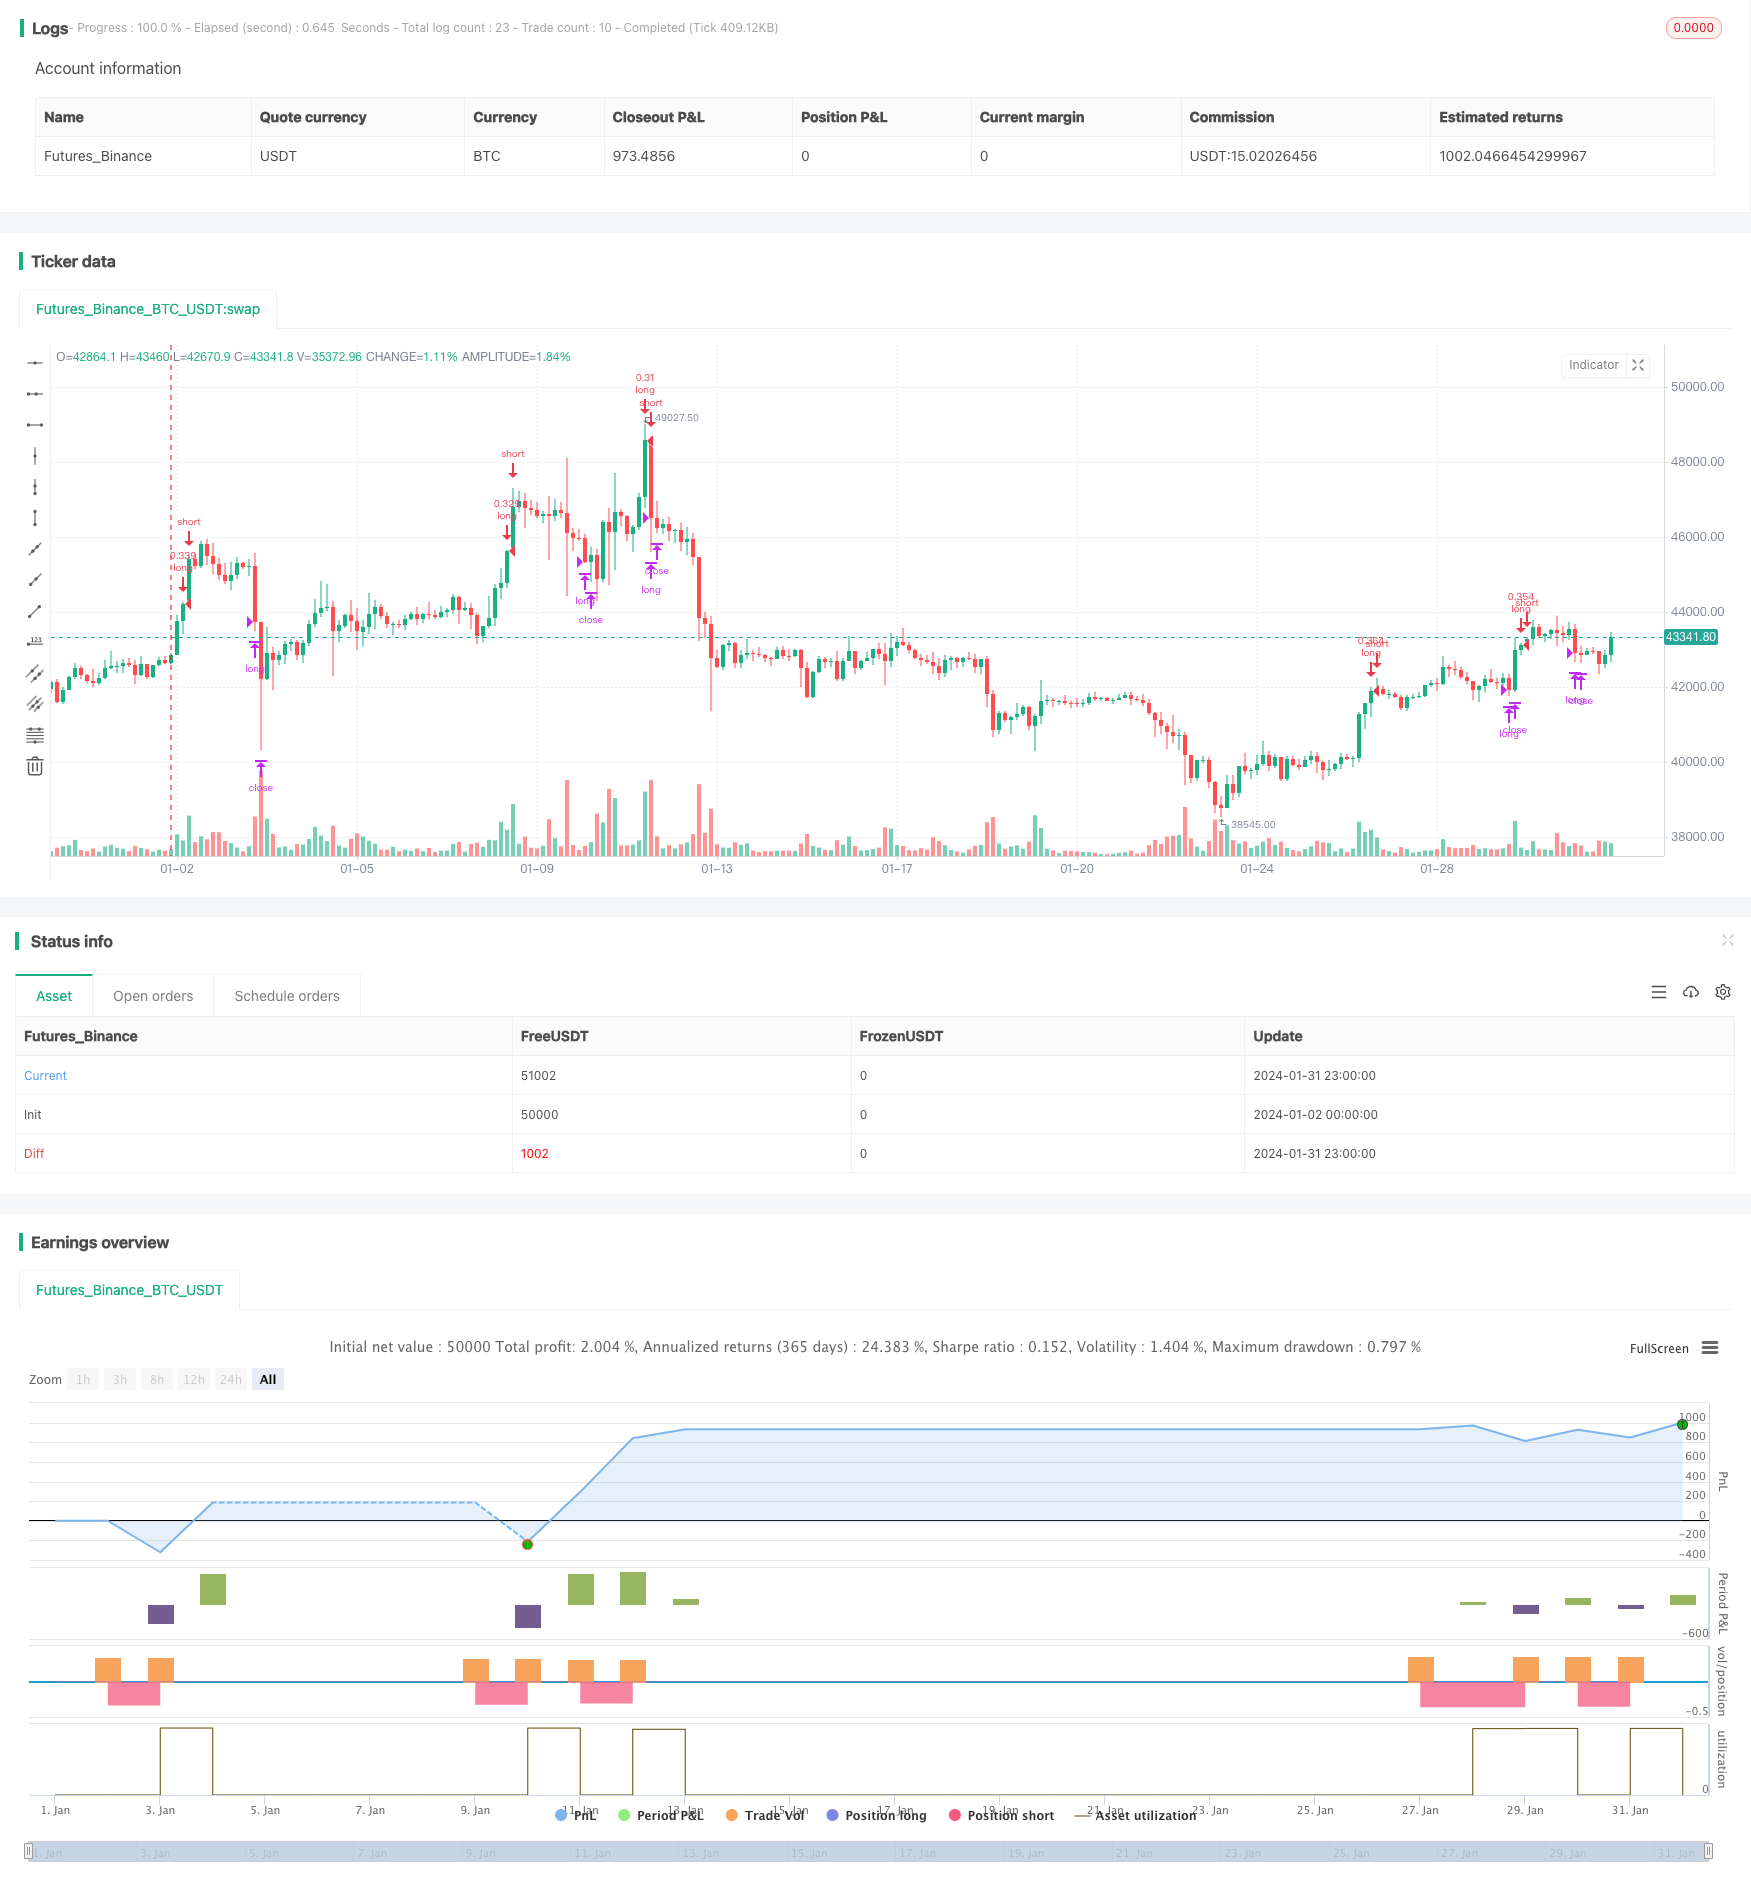
该策略假设每笔订单交易可用资金的30%。考虑了0.1%的交易费用,该费用与币安(全球最大的加密货币交易所)的基础费用相符。
- 进入信号:当RSI大于70且在回测窗口内时做多
- 退出信号:当RSI小于55或者收盘价大于止盈价时平仓
- 利用RSI指标识别趋势,避免在震荡行情中错过信号
- 定额仓位管理,有效控制单笔损失
- 适合中长线持有,避免被短期波动击出
- 需确保RSI参数设定合理,否则可能在超买超卖中产生错误信号
- 追踪止盈需要及时更新,否则可能错过利润
- 需关注市场异常波动带来的风险,必要时调整仓位或停损
- 可以考虑结合其他指标如MACD等判断趋势
- 可以测试不同的RSI参数设置
- 可以引入动态止盈,根据市场波动自动调整止盈价
本策略利用RSI指标识别超买状态判断趋势方向,在追踪上涨趋势中逐步止盈。相比传统看跌的RSI运用方式,本策略提供了新的思路。通过严格的回测验证,该策略获得了良好的表现。但我们也需要关注一些潜在风险,并做好参数调整与优化。总体来说,本策略为量化交易提供了一个简单实用的趋势跟踪方案。
||
According to technical analysis, an RSI above 70 should signal overbought conditions and thus a sell signal. Cryptocurrencies represent an entirely new asset class that is reshaping concepts of technical analysis. FOMO buying can be very powerful, and coins can remain in overbought territory long enough to provide excellent scalping opportunities on the upside.
Building a trend-following trading strategy based on the RSI, which is generally considered a contrarian indicator, may sound counterintuitive. However, over 200 backtests prove this is a very interesting long-term setup.
The strategy assumes each order to trade 30% of the available capital. A trading fee of 0.1% is taken into account, aligned with the base fee applied on Binance, the world's largest cryptocurrency exchange.
- Entry Signal: Go long when RSI goes above 70 and within backtest window
- Exit Signal: Close long position when RSI drops below 55 or close goes above take profit
- Identify trends using RSI, avoiding missing signals in ranging markets
- Fixed position sizing manages single trade risk
- Suitable for mid-to-long term holds, avoiding shakeouts from short-term fluctuations
- Ensure RSI parameters are set reasonably, otherwise overbought/oversold errors occur
- Tracking take profit requires timely updates, otherwise profits are left on the table
- Monitor risk from exceptional market volatility, adjust position sizing or stop losses if necessary
- Consider combining other indicators like MACD to confirm trend
- Test different RSI parameter settings
- Introduce dynamic take profit based on market volatility
This strategy identifies overbought conditions with RSI to determine trend direction and takes progressive profits trailing the uptrend. Compared to traditional RSI contrarian usage, this strategy offers a new perspective. Rigorous backtesting shows promising results, but we need to monitor risks and optimize parameters. Overall, it provides a simple, practical trend following approach for quantitative trading.
[/trans]
Strategy Arguments
| Argument | Default | Description |
|---|---|---|
| v_input_1 | true | From Month |
| v_input_2 | 10 | From Day |
| v_input_3 | 2020 | From Year |
| v_input_4 | true | Thru Month |
| v_input_5 | true | Thru Day |
| v_input_6 | 2112 | Thru Year |
| v_input_7 | true | Show Date Range |
| v_input_8 | 14 | RSI period |
| v_input_9 | 6 | v_input_9 |
Source (PineScript)
/*backtest
start: 2024-01-02 00:00:00
end: 2024-02-01 00:00:00
period: 3h
basePeriod: 15m
exchanges: [{"eid":"Futures_Binance","currency":"BTC_USDT"}]
*/

//@version=1
strategy(shorttitle='Trend-following RSI Scalping Strategy (by Coinrule)',title='Trend-following RSI Strategy ', overlay=true, initial_capital = 1000, default_qty_type = strategy.percent_of_equity, default_qty_type = strategy.percent_of_equity, default_qty_value = 30, commission_type=strategy.commission.percent, commission_value=0.1)

//Backtest dates
fromMonth = input(defval = 1,  title = "From Month")
fromDay   = input(defval = 10,    title = "From Day")
fromYear  = input(defval = 2020, title = "From Year")
thruMonth = input(defval = 1,    title = "Thru Month")
thruDay   = input(defval = 1,    title = "Thru Day")
thruYear  = input(defval = 2112, title = "Thru Year")

showDate  = input(defval = true, title = "Show Date Range")

start     = timestamp(fromYear, fromMonth, fromDay, 00, 00)        // backtest start window
finish    = timestamp(thruYear, thruMonth, thruDay, 23, 59)        // backtest finish window
window()  => true


// RSI inputs and calculations
lengthRSI = input(14, title = 'RSI period', minval=1)
RSI = rsi(close, lengthRSI)

//Entry


strategy.entry(id="long", long = true, when = RSI > 70 and window())

//Exit

Take_profit= ((input (6))/100)
longTakeProfit = strategy.position_avg_price * (1 + Take_profit)

strategy.close("long", when = RSI < 55 or close > longTakeProfit and window())
Detail
https://www.fmz.com/strategy/440832
Last Modified
2024-02-02 14:54:53
