Name
基于MACD的长线策略MACD-Long-Only-Strategy
Author
ChaoZhang
Strategy Description
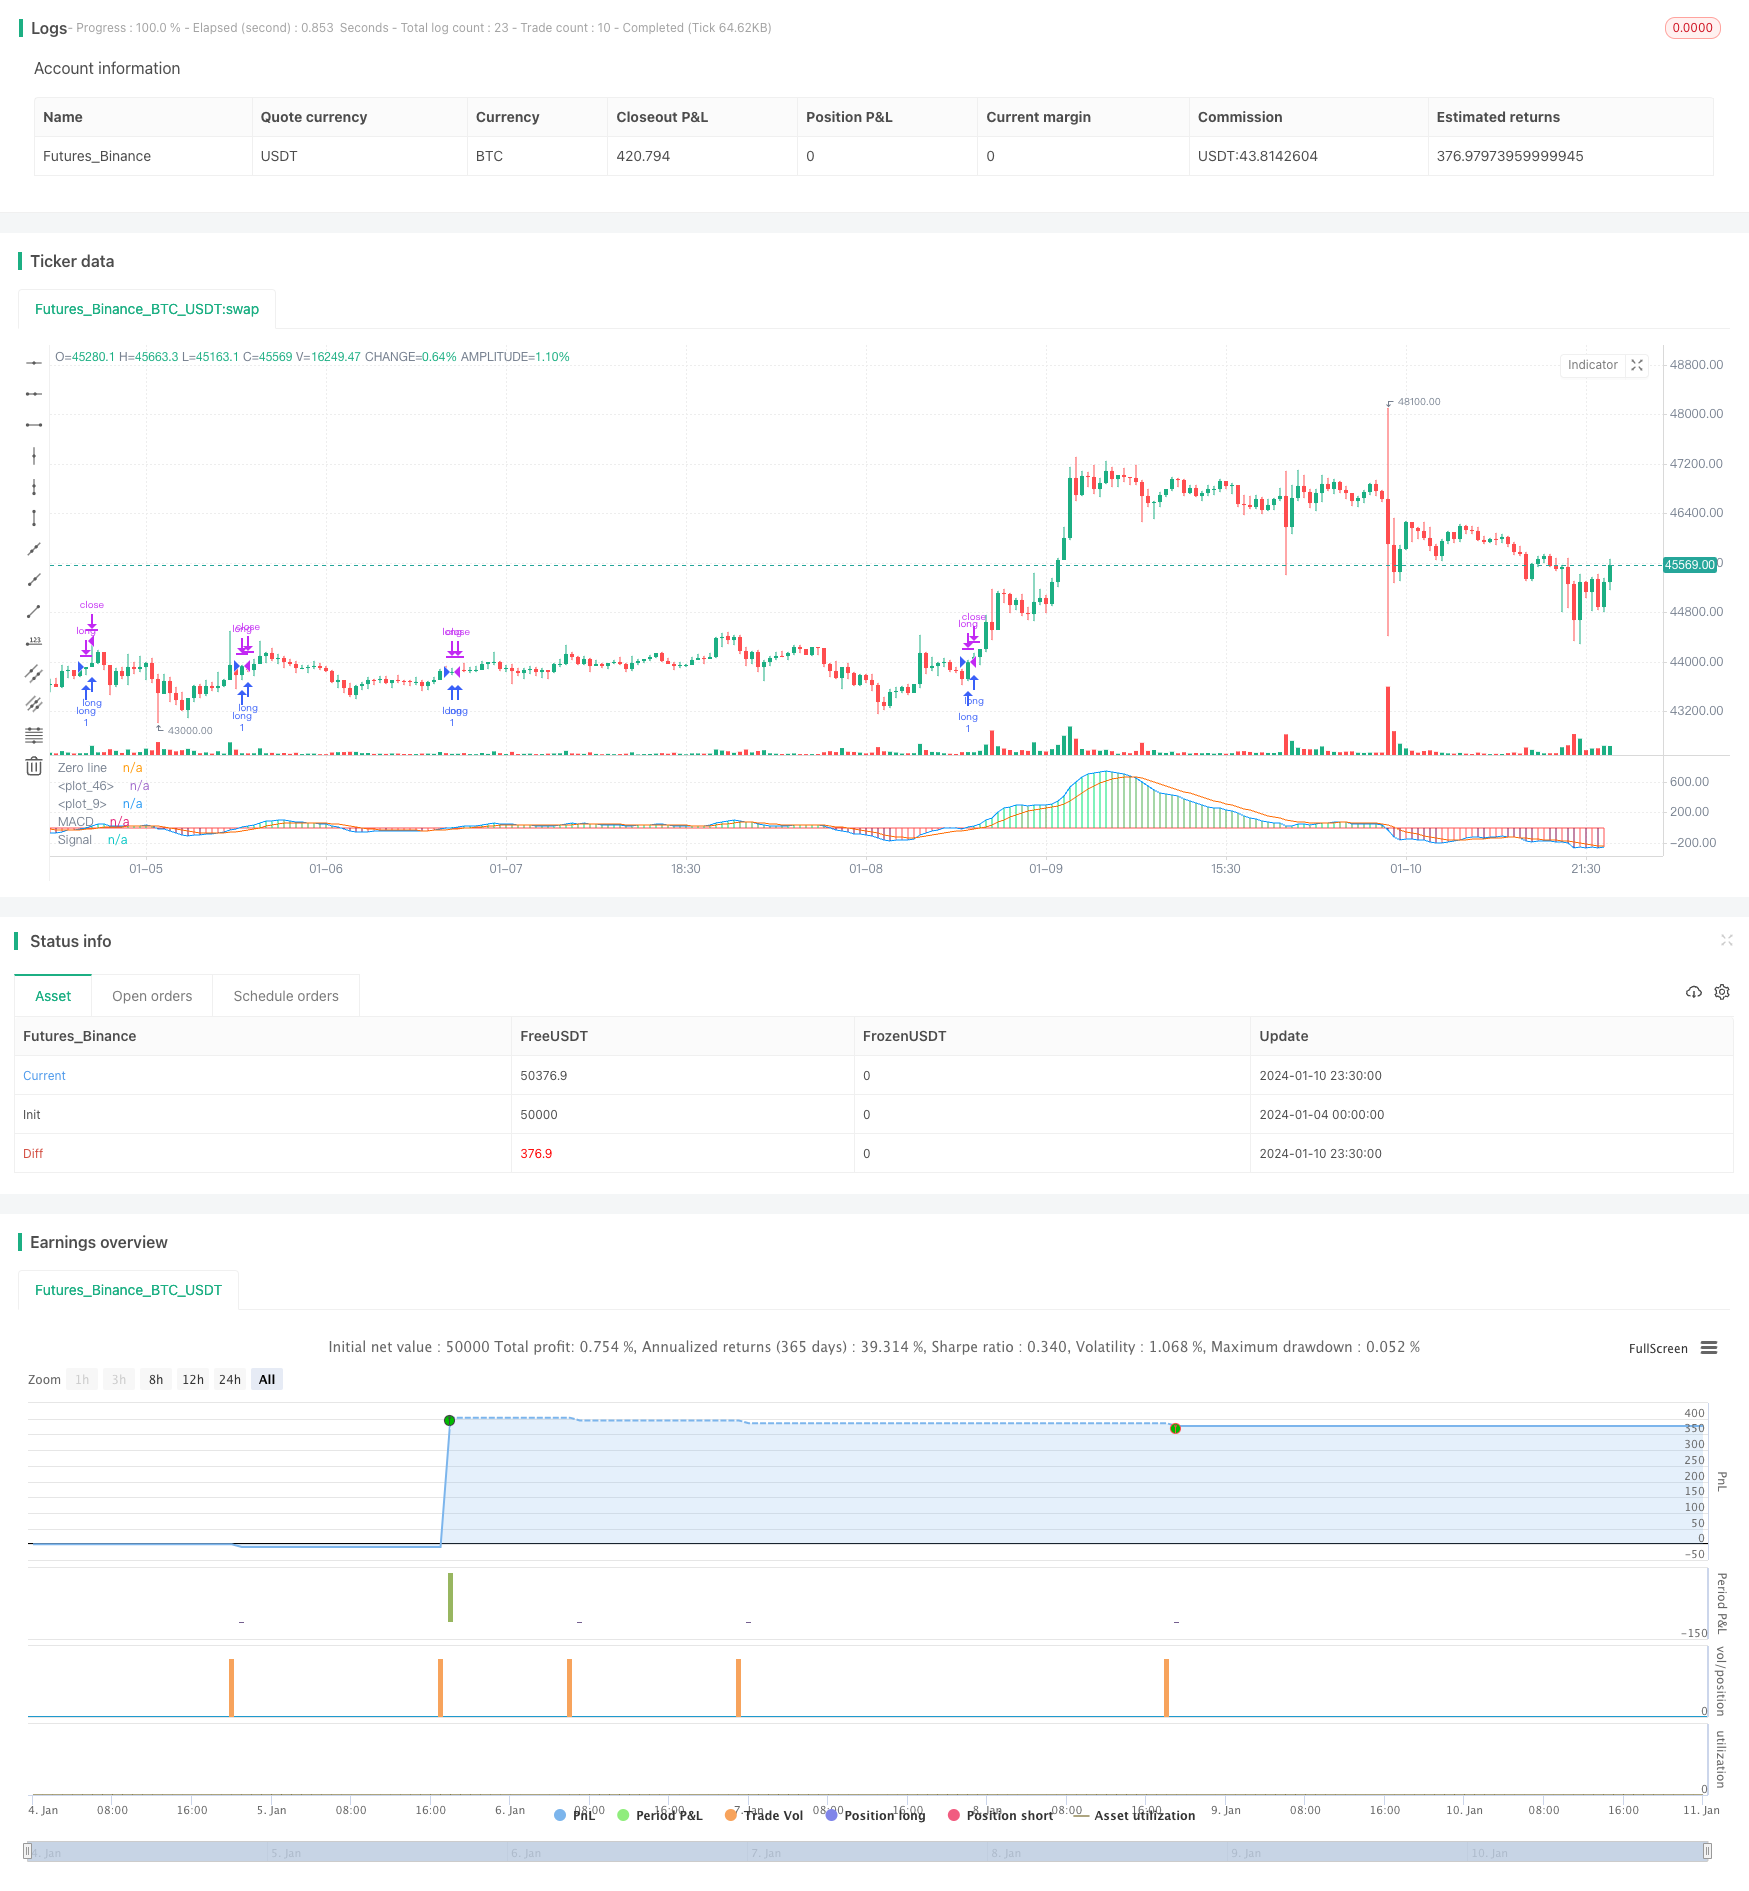
本策略基于MACD指标以及长线和平仓线,实现了货币对的长线交易。当MACD指标线穿过长线时进行开仓,当MACD指标线穿过平仓线时进行平仓。同时设置了止损策略。
该策略使用MACD指标的快线和慢线。快线参数为12日EMA,慢线参数为26日EMA。两条均线之间差值为MACD柱状图。另外计算9日EMA作为讯号线。当MACD柱状图上穿0.04时做多,下穿0.015时平多单。同时设置了5%的止损。
具体来说,策略首先计算MACD指标的快线、慢线和信号线。然后设置长线为-0.04,平仓线为0.015。如果当前MACD柱状图大于长线,进行做多;如果当前MACD柱状图小于平仓线,进行平多仓。此外,设置止损线为开仓价格的95%。
该策略具有以下优势:
- 使用MACD指标判断行情趋势,准确率较高
- 同时使用长线和平仓线双重过滤,避免错误信号
- 设置止损策略,有效控制风险
- 简单明了,逻辑清晰,易于理解与实施
- 仅需和MACD指标,资源占用低
该策略也存在一定风险:
- MACD指标具有一定滞后性,可能错过短线机会
- 止损设置可能过于保守,无法持续跟踪长线趋势
- 参数设置需要反复测试优化,否则可能过拟合
- 仅适用于,其他货币对效果存疑
可以通过适当调整参数、组合其他指标等方法来优化和改进。
该策略可以从以下几个方面进行优化:
-
测试不同的MACD参数组合,寻找更优参数
可以尝试不同长度的快线、慢线、信号线,找到更合适的组合
-
更换其他指标试探
例如RSI,KD等指标可能带来截然不同的效果
-
优化长线和平仓线参数
可以通过反复回测数据,寻找更合适的长平仓参数
-
调整止损策略
可以考虑trailing stop等方法,让止损更加动态跟踪
-
测试多种货币对
将策略运用到其他货币对,考察效果
本策略overall是一个非常简单直观的长线交易策略。利用MACD指标判断行情,并设置双重过滤条件减少误交易。同时配置了止损来控制风险。该策略逻辑清晰,资源占用低,易于理解和实施,值得推荐。当然,通过参数优化、指标调整等手段,该策略还有很大的改进空间,可以使效果更加出色。
||
This strategy is based on the MACD indicator and long and close lines to implement long-term trading of the currency pair. It opens positions when the MACD indicator line crosses over the long line and closes positions when the MACD indicator line crosses below the close line. Stop loss strategy is also configured.
The strategy uses fast and slow lines of the MACD indicator. The fast line has a parameter of 12-day EMA and the slow line has a parameter of 26-day EMA. The difference between the two lines is the MACD histogram. In addition, 9-day EMA is calculated as the signal line. It goes long when the MACD histogram crosses above 0.04 and closes long positions when crossing below 0.015. Also, 5% stop loss is set.
Specifically, the strategy first calculates the fast line, slow line and signal line of the MACD indicator. Then the long line is set at -0.04, the close line is set at 0.015. If the current MACD histogram is greater than the long line, it goes long. If the current MACD histogram is less than the close line, it closes the long position. In addition, the stop loss line is set at 95% of the entry price.
The strategy has the following advantages:
- Use MACD indicator to judge market trend with high accuracy
- Double filter with long and close lines avoids wrong signals
- Stop loss strategy effectively controls risks
- Simple and clear logic, easy to understand and implement
- Only needs and MACD indicator, less resource occupation
The strategy also has some risks:
- MACD indicator has some lagging, may miss short-term opportunities
- Stop loss setting may be too conservative to keep tracking long term trends
- Parameter tuning needs lots of backtesting, otherwise overfitting may occur
- Only applicable to , effectiveness for other pairs is uncertain
Methods like adjusting parameters, combining other indicators can be used to optimize and improve.
The strategy can be optimized in the following aspects:
-
Test different MACD parameter combinations to find better parameters
Fast line, slow line, signal line with different lengths can be tried to find more suitable combinations
-
Try other indicators
Indicators like RSI, KD may have very different results
-
Optimize long and close line parameters
More suitable parameters can be found through repetitive backtesting
-
Adjust stop loss strategy
Consider trailing stops to make stop loss more dynamic
-
Test on different currency pairs
Apply the strategy to other pairs and examine the effects
In conclusion, this is an overall very simple and intuitive long term trading strategy. It judges market conditions using MACD indicator and sets double filter criteria to reduce false trading. Risk control is also configured through stop loss. The logic is clear and resource occupation is low. It is easy to understand and implement, worth recommending. Of course, there is still much room for improvement through parameter tuning, indicator change and other means, to make the strategy even more outstanding.
[/trans]
Strategy Arguments
| Argument | Default | Description |
|---|---|---|
| v_input_1 | 12 | Fast moving average |
| v_input_2 | 26 | Slow moving average |
| v_input_3 | 12 | Fast Length |
| v_input_4 | 26 | Slow Length |
| v_input_5_close | 0 | Source: close |
| v_input_6 | 9 | Signal Smoothing |
| v_input_7 | false | Simple MA(Oscillator) |
| v_input_8 | false | Simple MA(Signal Line) |
| v_input_9 | -0.04 | Enter Long |
| v_input_10 | 0.015 | Close Long |
| v_input_11 | 0.05 | Stop Loss % |
Source (PineScript)
/*backtest
start: 2024-01-04 00:00:00
end: 2024-01-11 00:00:00
period: 30m
basePeriod: 15m
exchanges: [{"eid":"Futures_Binance","currency":"BTC_USDT"}]
*/

//@version=3
strategy(shorttitle = "GBPJPY MACD", title = "GBPJPY MACD")
fastMA = input(title="Fast moving average",  defval = 12, minval = 7)
slowMA = input(title="Slow moving average",  defval = 26, minval = 7)
lastColor = yellow
[currMacd,_,_] = macd(close[0], fastMA, slowMA, 9)
[prevMacd,_,_] = macd(close[1], fastMA, slowMA, 9)
plotColor = currMacd > 0 ? currMacd > prevMacd ? lime : green : currMacd < prevMacd ? maroon : red
plot(currMacd, style = histogram, color = plotColor, linewidth = 3)
plot(0, title = "Zero line", linewidth = 1, color = gray)

//MACD
// Getting inputs
fast_length = input(title="Fast Length",  defval=12)
slow_length = input(title="Slow Length",  defval=26)
src = input(title="Source",  defval=close)
signal_length = input(title="Signal Smoothing",  minval = 1, maxval = 50, defval =9)
sma_source = input(title="Simple MA(Oscillator)", type=bool, defval=false)
sma_signal = input(title="Simple MA(Signal Line)", type=bool, defval=false)

// Plot colors
col_grow_above = #26A69A
col_grow_below = #FFCDD2
col_fall_above = #B2DFDB
col_fall_below = #EF5350
col_macd = #0094ff
col_signal = #ff6a00

// Calculating
fast_ma = sma_source ? sma(src, fast_length) : ema(src, fast_length)
slow_ma = sma_source ? sma(src, slow_length) : ema(src, slow_length)
macd = fast_ma - slow_ma
signal = sma_signal ? sma(macd, signal_length) : ema(macd, signal_length)
hist = macd - signal

//plot(hist, title="Histogram", style=columns, color=(hist>=0 ? (hist[1] < hist ? col_grow_above : col_fall_above) : (hist[1] < hist ? col_grow_below : col_fall_below) ), transp=0 )
plot(macd, title="MACD", color=col_macd, transp=0)
plot(signal, title="Signal", color=col_signal, transp=0)
///END OF MACD

//Long and Close Long Lines
linebuy = input(title="Enter Long", type=float, defval=-0.04)
linesell = input(title="Close Long", type=float, defval=0.015)

//Plot Long and Close Long Lines
plot(linebuy,color=green),plot(linesell,color=red)


//Stop Loss Input
sl_inp = input(0.05, title='Stop Loss %', type=float)/100


//Order Conditions
longCond = crossover(currMacd, linebuy)
exitLong = crossover(currMacd, linesell)
stop_level = strategy.position_avg_price * (1 - sl_inp)


//Order Entries
strategy.entry("long", strategy.long,  when=longCond==true)
strategy.close("long", when=exitLong==true)
strategy.exit("Stop Loss", stop=stop_level)
Detail
https://www.fmz.com/strategy/438452
Last Modified
2024-01-12 11:02:06