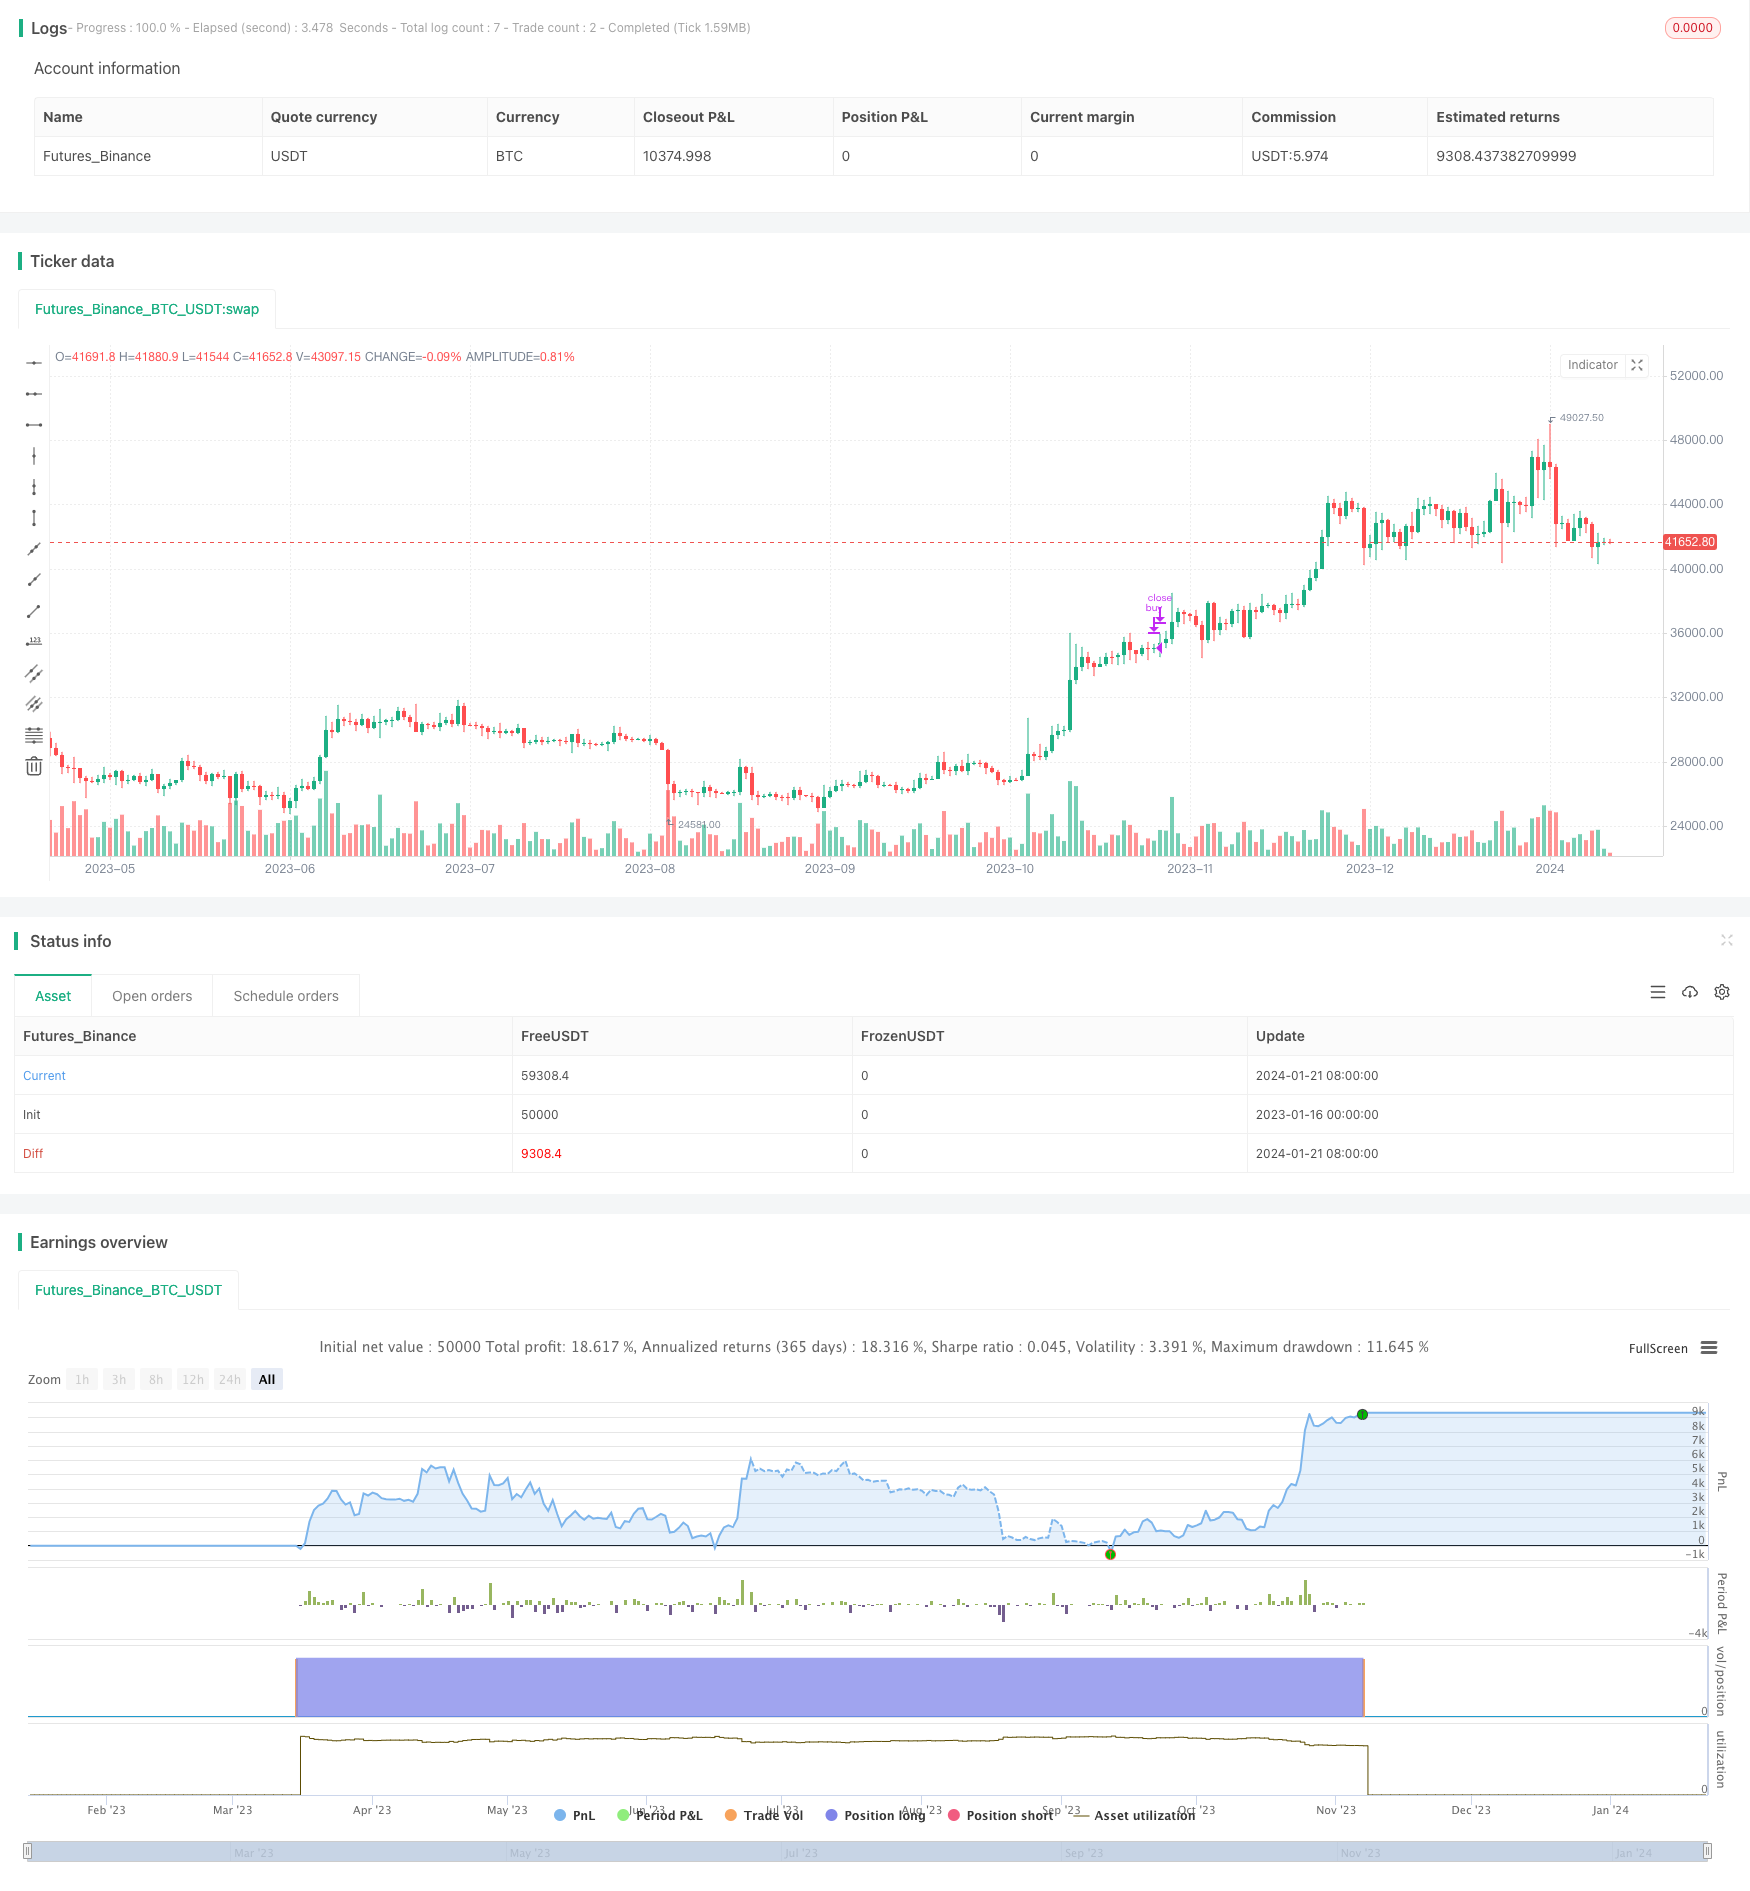
Name
基于MACD与RSI交叉策略MACD-and-RSI-Crossover-Strategy
Author
ChaoZhang
Strategy Description
该策略通过计算MACD和RSI这两个指标的交叉,产生交易信号。当RSI超买超卖时,在MACD金叉死叉发生时,产生买入和卖出信号。该策略结合了两种不同类型指标的优点,既考虑了价格的趋势性,也结合了超买超卖情况,从而提高策略的效果。
该策略主要利用MACD和RSI这两个指标的组合来产生交易信号。其中,MACD一般用来判断价格趋势和动量变化,RSI一般用来判断超买超卖情况。
该策略首先计算出MACD的快慢均线和信号线。快线大于慢线产生金叉信号,快线小于慢线产生死叉信号。这表示价格的趋势和动量正在发生变化。
同时,该策略计算RSI指标,并设定超买线和超卖线。当RSI低于超卖线时表示超卖,当RSI高于超买线时表示超买。
在RSI超买超卖的情况下,策略在MACD金叉时产生买入信号,在MACD死叉时产生卖出信号。也就是在价格趋势发生转折的时候,利用MACD指标的灵敏度来捕捉转折点。而RSI指标的作用是避免在没有超买超卖的情况下发生错误交易。
该策略结合MACD和RSI两个指标的优势,可以提高策略的效果。
-
MACD指标能敏感捕捉价格变化,RSI指标考虑超买超卖情况,两者互补。
-
结合两个指标,可以过滤掉一些噪音交易信号,减少不必要的交易。
-
MACD统计价格平均数差值,RSI统计价格变化比例,两种方法可以互相验证。
-
MACD反应价格变化迅速,RSI反应价格背离比较明显,组合使用效果好。
该策略也存在一定的风险需要注意:
-
MACD和RSI都易受突发事件影响,可能产生错误信号。可以适当调整参数,过滤信号。
-
单一股票效果可能不佳,可以考虑指数或组合使用。
-
需要同时满足MACD交叉和RSI超买超卖条件才发出信号,可能错过部分机会。可以适当降低RSI参数要求。
该策略还可以从以下几个方面进行优化:
-
优化MACD和RSI的参数,使其更符合不同品种的特点。
-
增加止损策略,在亏损达到一定比例时及时止损。
-
结合其他指标,例如布林带、KDJ等,设定更严格的交易信号条件。
-
在高频数据上运行策略,利用MACD的快慢特性,提高策略效果。
-
根据回测结果,调整RSI的超买超卖线,寻找最佳参数组合。
该MACD与RSI交叉策略,结合了趋势跟踪和超买超卖判断,可以有效获取价格转折点,增强策略效果。但也存在一定局限,仍需根据市场行情不断测试与优化,方能充分发挥策略效果。
||
This strategy generates trading signals by calculating the crossover of the MACD and RSI indicators. It produces buy and sell signals when the RSI is overbought or oversold and MACD crossover occurs. The strategy combines the advantages of two different types of indicators, considering both the trend of prices and overbought/oversold situations, thereby improving the effectiveness of the strategy.
The strategy mainly uses the combination of MACD and RSI indicators to generate trading signals. MACD is generally used to determine price trends and momentum changes, while RSI is used to determine overbought/oversold conditions.
The strategy first calculates the fast line, slow line and signal line of the MACD. When the fast line is greater than the slow line, a golden cross signal is generated. When the fast line is less than the slow line, a death cross signal is generated. This indicates that the price trend and momentum are changing.
At the same time, the strategy calculates the RSI indicator and sets overbought and oversold lines. When the RSI is lower than the oversold line, it indicates overselling. When the RSI is higher than the overbought line, it indicates overbuying.
When RSI overbought/oversold occurs, the strategy generates buy signals when MACD golden cross happens, and generates sell signals when MACD death cross happens. That is when the price trend reverses, the MACD indicator is used to capture turning points due to its sensitivity. The RSI indicator avoids wrong trades when no overbought/oversold occurs.
The strategy combines the advantages of MACD and RSI indicators to improve its effectiveness:
-
MACD can sensitively capture price changes, while RSI considers overbought/oversold situations, complementing each other.
-
Combining the two indicators can filter out some noisy trading signals and reduce unnecessary trades.
-
MACD measures the difference between moving averages, while RSI measures the proportion of price changes, the two methods can verify each other.
-
MACD responds quickly to price changes, while RSI overbought/oversold divergences are obvious, good combo effect.
There are also certain risks in this strategy:
-
Both MACD and RSI are vulnerable to sudden events, which may generate wrong signals. Parameters can be adjusted to filter out signals.
-
The effect on individual stocks may not be ideal, indices or portfolios can be considered.
-
Satisfying both MACD crossover and RSI overbought/oversold may miss some opportunities. RSI parameter requirements could be reduced.
The strategy can also be optimized in the following aspects:
-
Optimize MACD and RSI parameters to suit different trading varieties.
-
Add stop loss strategy to stop loss in time when losses reach a certain percentage.
-
Combine with other indicators such as Bollinger Bands and KDJ to set more strict trading signal conditions.
-
Run the strategy at high frequency data to utilize the fast/slow properties of MACD and improve strategy performance.
-
According to backtest results, adjust overbought/oversold lines of RSI to find the best parameter combinations.
The MACD and RSI crossover strategy combines trend following and overbought/oversold judgment, which can effectively capture price reversal points and enhance strategy performance. But there are still some limitations, requiring continuous testing and optimization according to market conditions for the strategy to achieve maximum performance.
[/trans]
Strategy Arguments
| Argument | Default | Description |
|---|---|---|
| v_input_int_1 | 12 | Fast moving average |
| v_input_int_2 | 26 | Slow moving average |
| v_input_int_3 | 9 | signalLength |
| v_input_int_4 | 35 | RSIOverSold |
| v_input_int_5 | 80 | RSIOverBought |
| v_input_int_6 | 14 | Length |
Source (PineScript)
/*backtest
start: 2023-01-16 00:00:00
end: 2024-01-22 00:00:00
period: 1d
basePeriod: 1h
exchanges: [{"eid":"Futures_Binance","currency":"BTC_USDT"}]
*/

//@version=5
// © sabirt
strategy(title='MACD and RSI', overlay=true, shorttitle='MACD&RSI')
//MACD Settings
fastMA = input.int(title='Fast moving average', defval=12, minval=1)
slowMA = input.int(title='Slow moving average', defval=26, minval=1)
signalLength = input.int(9, minval=1)

//RSI settings
RSIOverSold = input.int(35, minval=1)
RSIOverBought = input.int(80, minval=1)
src = close
len = input.int(14, minval=1, title='Length')
up = ta.rma(math.max(ta.change(src), 0), len)
down = ta.rma(-math.min(ta.change(src), 0), len)
rsi = down == 0 ? 100 : up == 0 ? 0 : 100 - 100 / (1 + up / down)
wasOversold = rsi[0] <= RSIOverSold or rsi[1] <= RSIOverSold or rsi[2] <= RSIOverSold or rsi[3] <= RSIOverSold or rsi[4] <= RSIOverSold or rsi[5] <= RSIOverSold
wasOverbought = rsi[0] >= RSIOverBought or rsi[1] >= RSIOverBought or rsi[2] >= RSIOverBought or rsi[3] >= RSIOverBought or rsi[4] >= RSIOverBought or rsi[5] >= RSIOverBought


[currMacd, _, _] = ta.macd(close[0], fastMA, slowMA, signalLength)
[prevMacd, _, _] = ta.macd(close[1], fastMA, slowMA, signalLength)
signal = ta.ema(currMacd, signalLength)

avg_1 = math.avg(currMacd, signal)
crossoverBear = ta.cross(currMacd, signal) and currMacd < signal ? avg_1 : na
avg_2 = math.avg(currMacd, signal)
crossoverBull = ta.cross(currMacd, signal) and currMacd > signal ? avg_2 : na

strategy.entry('buy', strategy.long, when=crossoverBull and wasOversold)
strategy.close('buy', when=crossoverBear and wasOverbought)
Detail
https://www.fmz.com/strategy/439758
Last Modified
2024-01-23 15:26:08
