Name
基于EMA的日内-skillet-商交策略EMA-Intraday-Scalping-Strategy
Author
ChaoZhang
Strategy Description
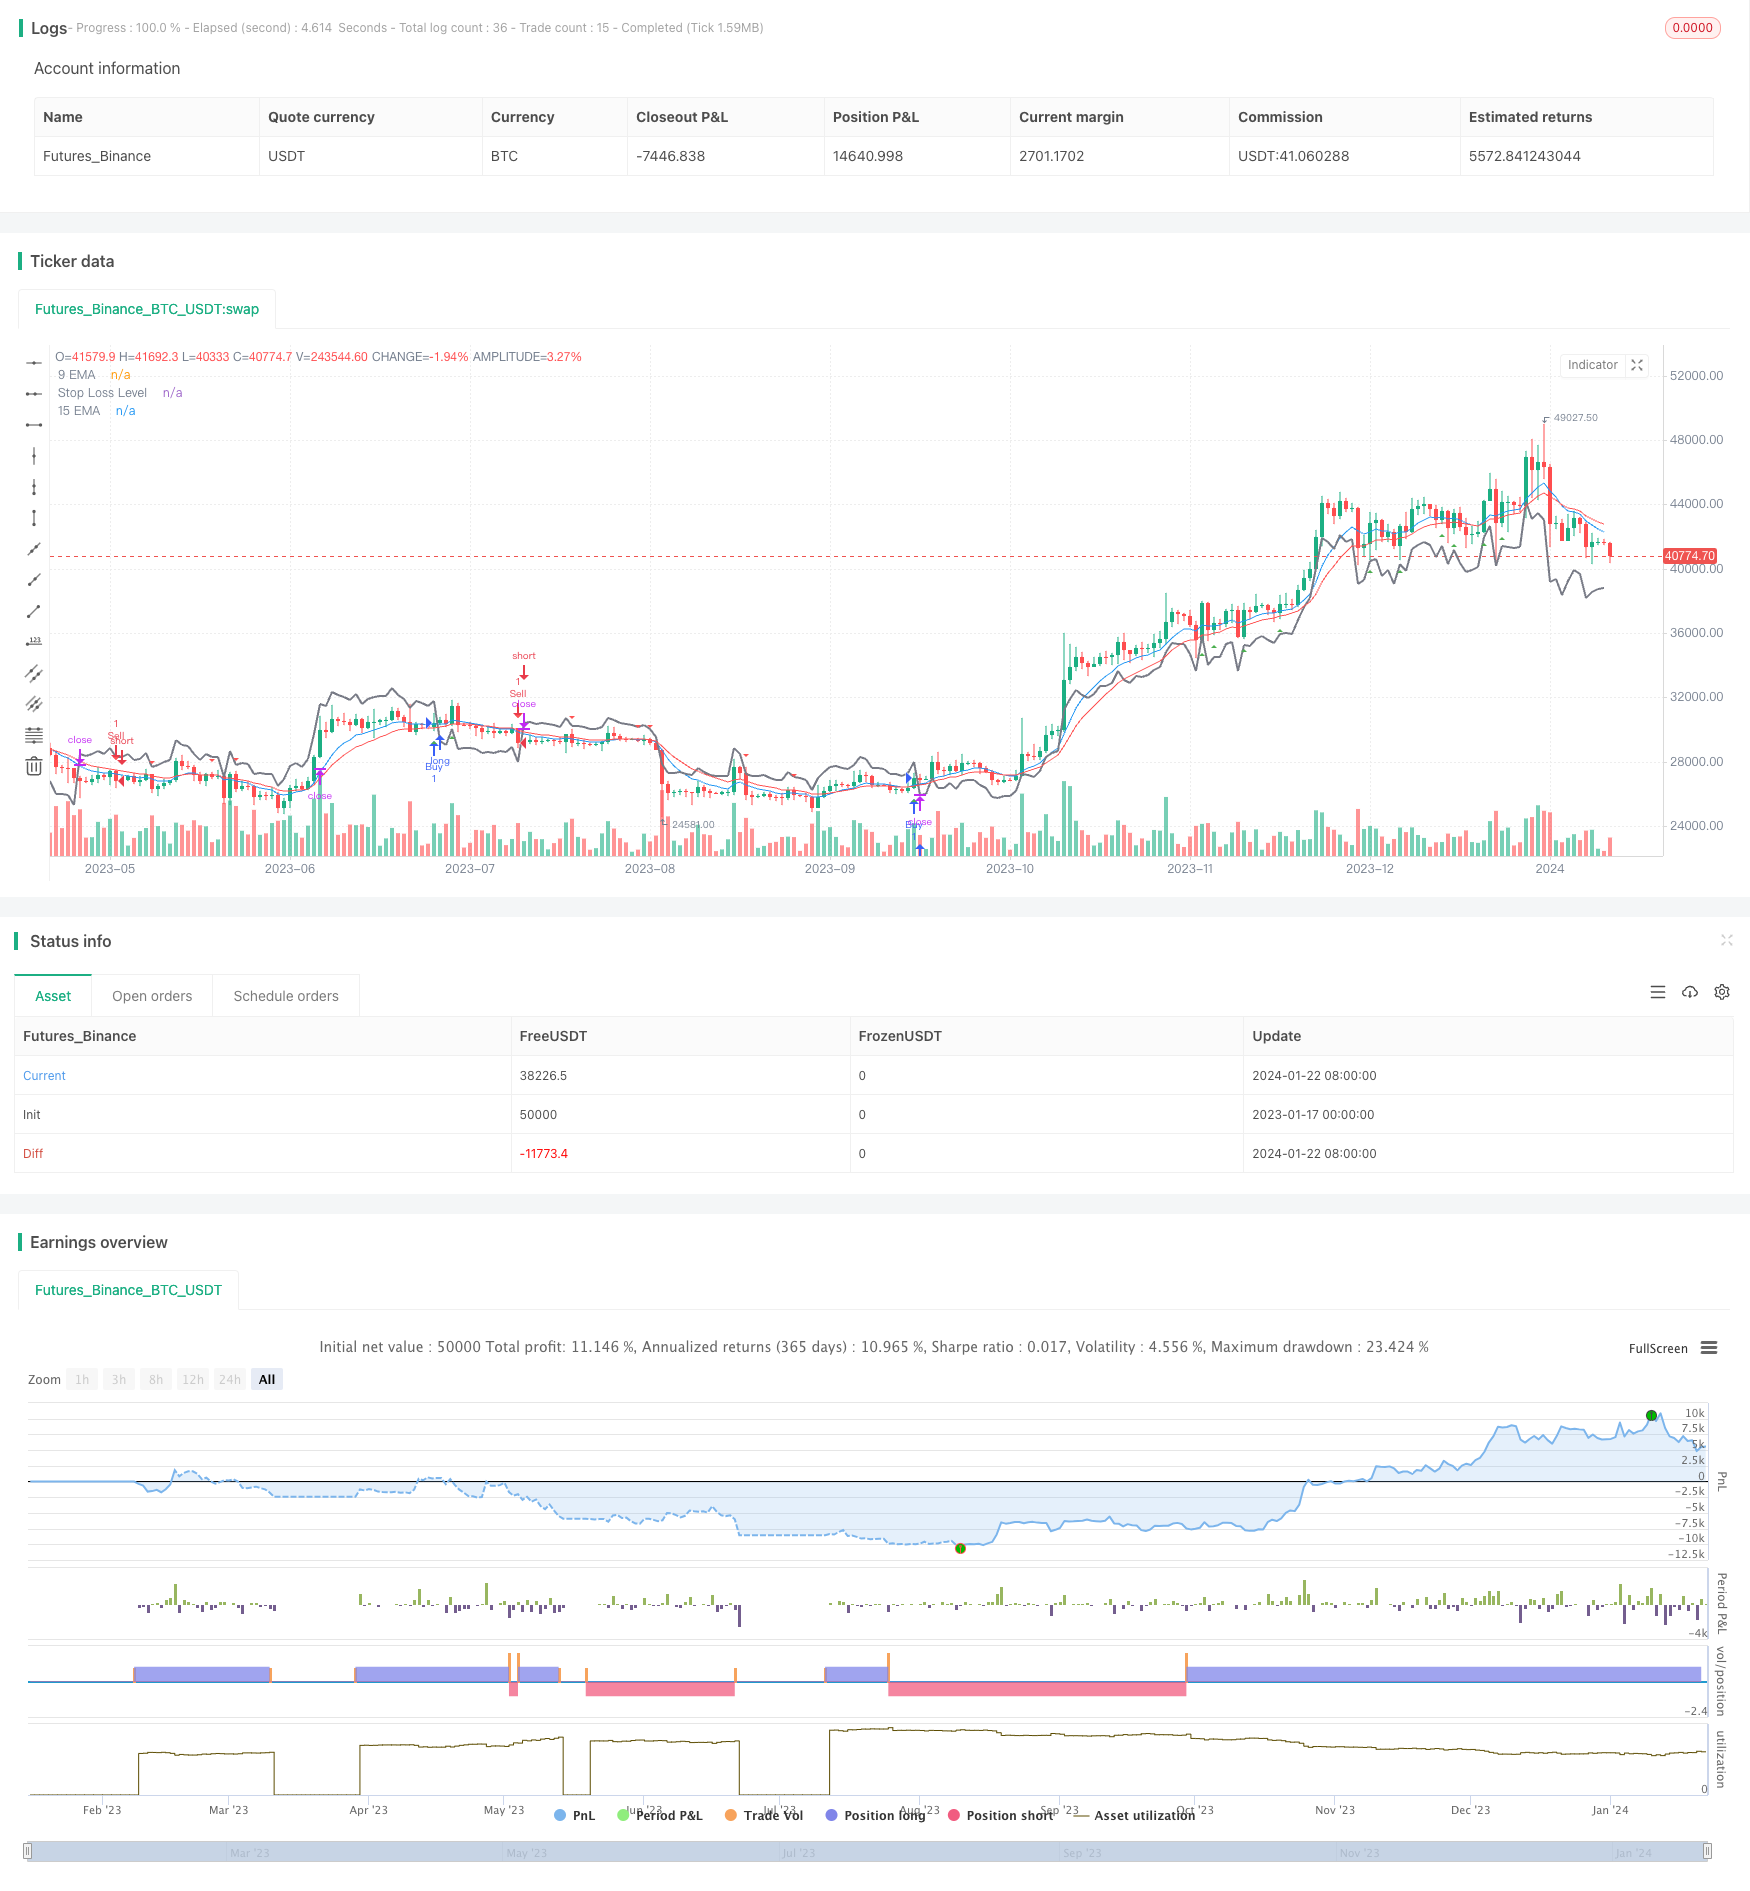
本策略通过计算9日和15日的指数移动平均线,识别EMA金叉和死叉形成的买入和卖出信号,用于日内短线交易。当9EMA上穿15EMA,并且最近一根K线为阳线时产生买入信号;当9EMA下穿15EMA,并且最近一根K线为阴线时产生卖出信号。该策略同时结合ATR指标绘制止损线。
- 计算9日EMA和15日EMA
- 识别最近一根K线的涨跌性质,判断为阳线或阴线
- 当9EMA上穿15EMA,并且最近一根K线为阳线时,产生买入信号
- 当9EMA下穿15EMA,并且最近一根K线为阴线时,产生卖出信号
- 通过ATR指标计算ATR值,在持仓时绘制止损线
该策略具有以下优势:
- 使用了双EMA指标组合,能够捕捉中短期趋势
- 结合K线实体方向过滤假信号
- 采用ATR动态止损,可以在保证盈利的前提下控制风险
- 时间周期短,适合利用短线价格波动进行日内skillet交易
- 操作简单,容易实施
该策略也存在一定的风险:
- EMA指标具有滞后性,可能错过部分价格波动
- 双EMA均值回归可能产生 whipsaws 信号
- 日内短线交易容易受到价格震荡的影响
- 止损距离过小容易被突破,过大则影响盈利空间
对策:
- 适当调整EMA参数,缩短均线周期
- 结合其他指标如MACD等过滤信号
- 动态调整止损距离,优化止损策略
该策略可以从以下几个方面进行优化:
- 测试不同的EMA参数组合,寻找最佳均线周期
- 增加其他指标判断,构建多因子模型
- 采用时间段滤波,只在特定时间段发出信号
- 结合波动率指标,调整止损距离
- 利用机器学习技术动态优化参数
本策略整合了双EMA指标判断趋势方向和K线实体过滤信号,采用ATR动态止损,是一个简单实用的日内skillet交易策略。通过参数优化和多因子组合,可以进一步提高策略的稳定性和盈利能力。
||
This strategy calculates the 9-day and 15-day exponential moving averages (EMA) to identify buy and sell signals based on EMA crosses and candlestick direction for intraday trading. It generates buy signals when the 9EMA crosses above the 15EMA and the last candlestick is bullish, and sell signals when the 9EMA crosses below the 15EMA and the last candlestick is bearish. The strategy also incorporates an ATR-based stop loss.
- Calculate the 9-day EMA and 15-day EMA
- Identify the direction of the last candlestick (bullish or bearish)
- Generate buy signal when 9EMA crosses above 15EMA and last candlestick is bullish
- Generate sell signal when 9EMA crosses below 15EMA and last candlestick is bearish
- Calculate ATR value using ATR indicator to plot stop loss during trade
The advantages of this strategy include:
- Uses EMA combo to capture short-mid term trends
- Filters false signals using candlestick direction
- Employs dynamic ATR stop loss to control risk
- Short timeframe suitable for intraday scalping
- Simple to implement
The risks include:
- EMA has lagging effect, may miss some price moves
- EMA crossovers can cause whipsaws
- Prone to price fluctuations in intraday trading
- Stop loss too tight tends to get hit, too wide impacts profit
Solutions:
- Optimize EMA parameters
- Add other filters like MACD
- Dynamically adjust stop loss
- Optimize stop loss strategy
Areas for optimization:
- Test different EMA combos to find optimal periods
- Add other indicators, build multifactor model
- Add timeframe filter, signal only during certain periods
- Incorporate volatility index to adjust stop loss level
- Employ machine learning to dynamically optimize parameters
This is a simple yet effective intraday scalping strategy integrating dual EMA crossover and candlestick filtering with ATR-based dynamic stop loss. Further enhancements in parameters and multi-factor combinations can improve stability and profitability.
[/trans]
Strategy Arguments
| Argument | Default | Description |
|---|---|---|
| v_input_1 | 9 | 9 EMA Length |
| v_input_2 | 15 | 15 EMA Length |
| v_input_3 | 14 | ATR Length for Stop Loss |
| v_input_4 | 1.5 | ATR Multiplier for Stop Loss |
Source (PineScript)
/*backtest
start: 2023-01-17 00:00:00
end: 2024-01-23 00:00:00
period: 1d
basePeriod: 1h
exchanges: [{"eid":"Futures_Binance","currency":"BTC_USDT"}]
*/

//@version=5
strategy("EMA Scalping Strategy", shorttitle="EMAScalp", overlay=true)

// Input parameters
ema9_length = input(9, title="9 EMA Length")
ema15_length = input(15, title="15 EMA Length")

// Calculate EMAs
ema9 = ta.ema(close, ema9_length)
ema15 = ta.ema(close, ema15_length)

// Plot EMAs on the chart
plot(ema9, color=color.blue, title="9 EMA")
plot(ema15, color=color.red, title="15 EMA")

// Identify Bullish and Bearish candles
bullish_candle = close > open
bearish_candle = close < open

// Bullish conditions for Buy Signal
buy_condition = ta.crossover(close, ema9) and ema15 < ema9 and bullish_candle

// Bearish conditions for Sell Signal
sell_condition = ta.crossunder(close, ema9) and ema15 > ema9 and bearish_candle

// Plot Buy and Sell signals
plotshape(series=buy_condition, title="Buy Signal", color=color.green, style=shape.triangleup, location=location.belowbar)
plotshape(series=sell_condition, title="Sell Signal", color=color.red, style=shape.triangledown, location=location.abovebar)

// Optional: Add stop-loss levels
atr_length = input(14, title="ATR Length for Stop Loss")
atr_multiplier = input(1.5, title="ATR Multiplier for Stop Loss")

atr_value = ta.atr(atr_length)
stop_loss_level = strategy.position_size > 0 ? close - atr_multiplier * atr_value : close + atr_multiplier * atr_value
plot(stop_loss_level, color=color.gray, title="Stop Loss Level", linewidth=2)

// Strategy rules
if (buy_condition)
    strategy.entry("Buy", strategy.long)
    strategy.exit("Exit Buy", from_entry="Buy", loss=stop_loss_level)

if (sell_condition)
    strategy.entry("Sell", strategy.short)
    strategy.exit("Exit Sell", from_entry="Sell", loss=stop_loss_level)
Detail
https://www.fmz.com/strategy/439883
Last Modified
2024-01-24 15:43:31
