Name
基于Bollinger-Bands的短线交易策略Short-term-Trading-Strategy-Based-on-Bollinger-Bands
Author
ChaoZhang
Strategy Description
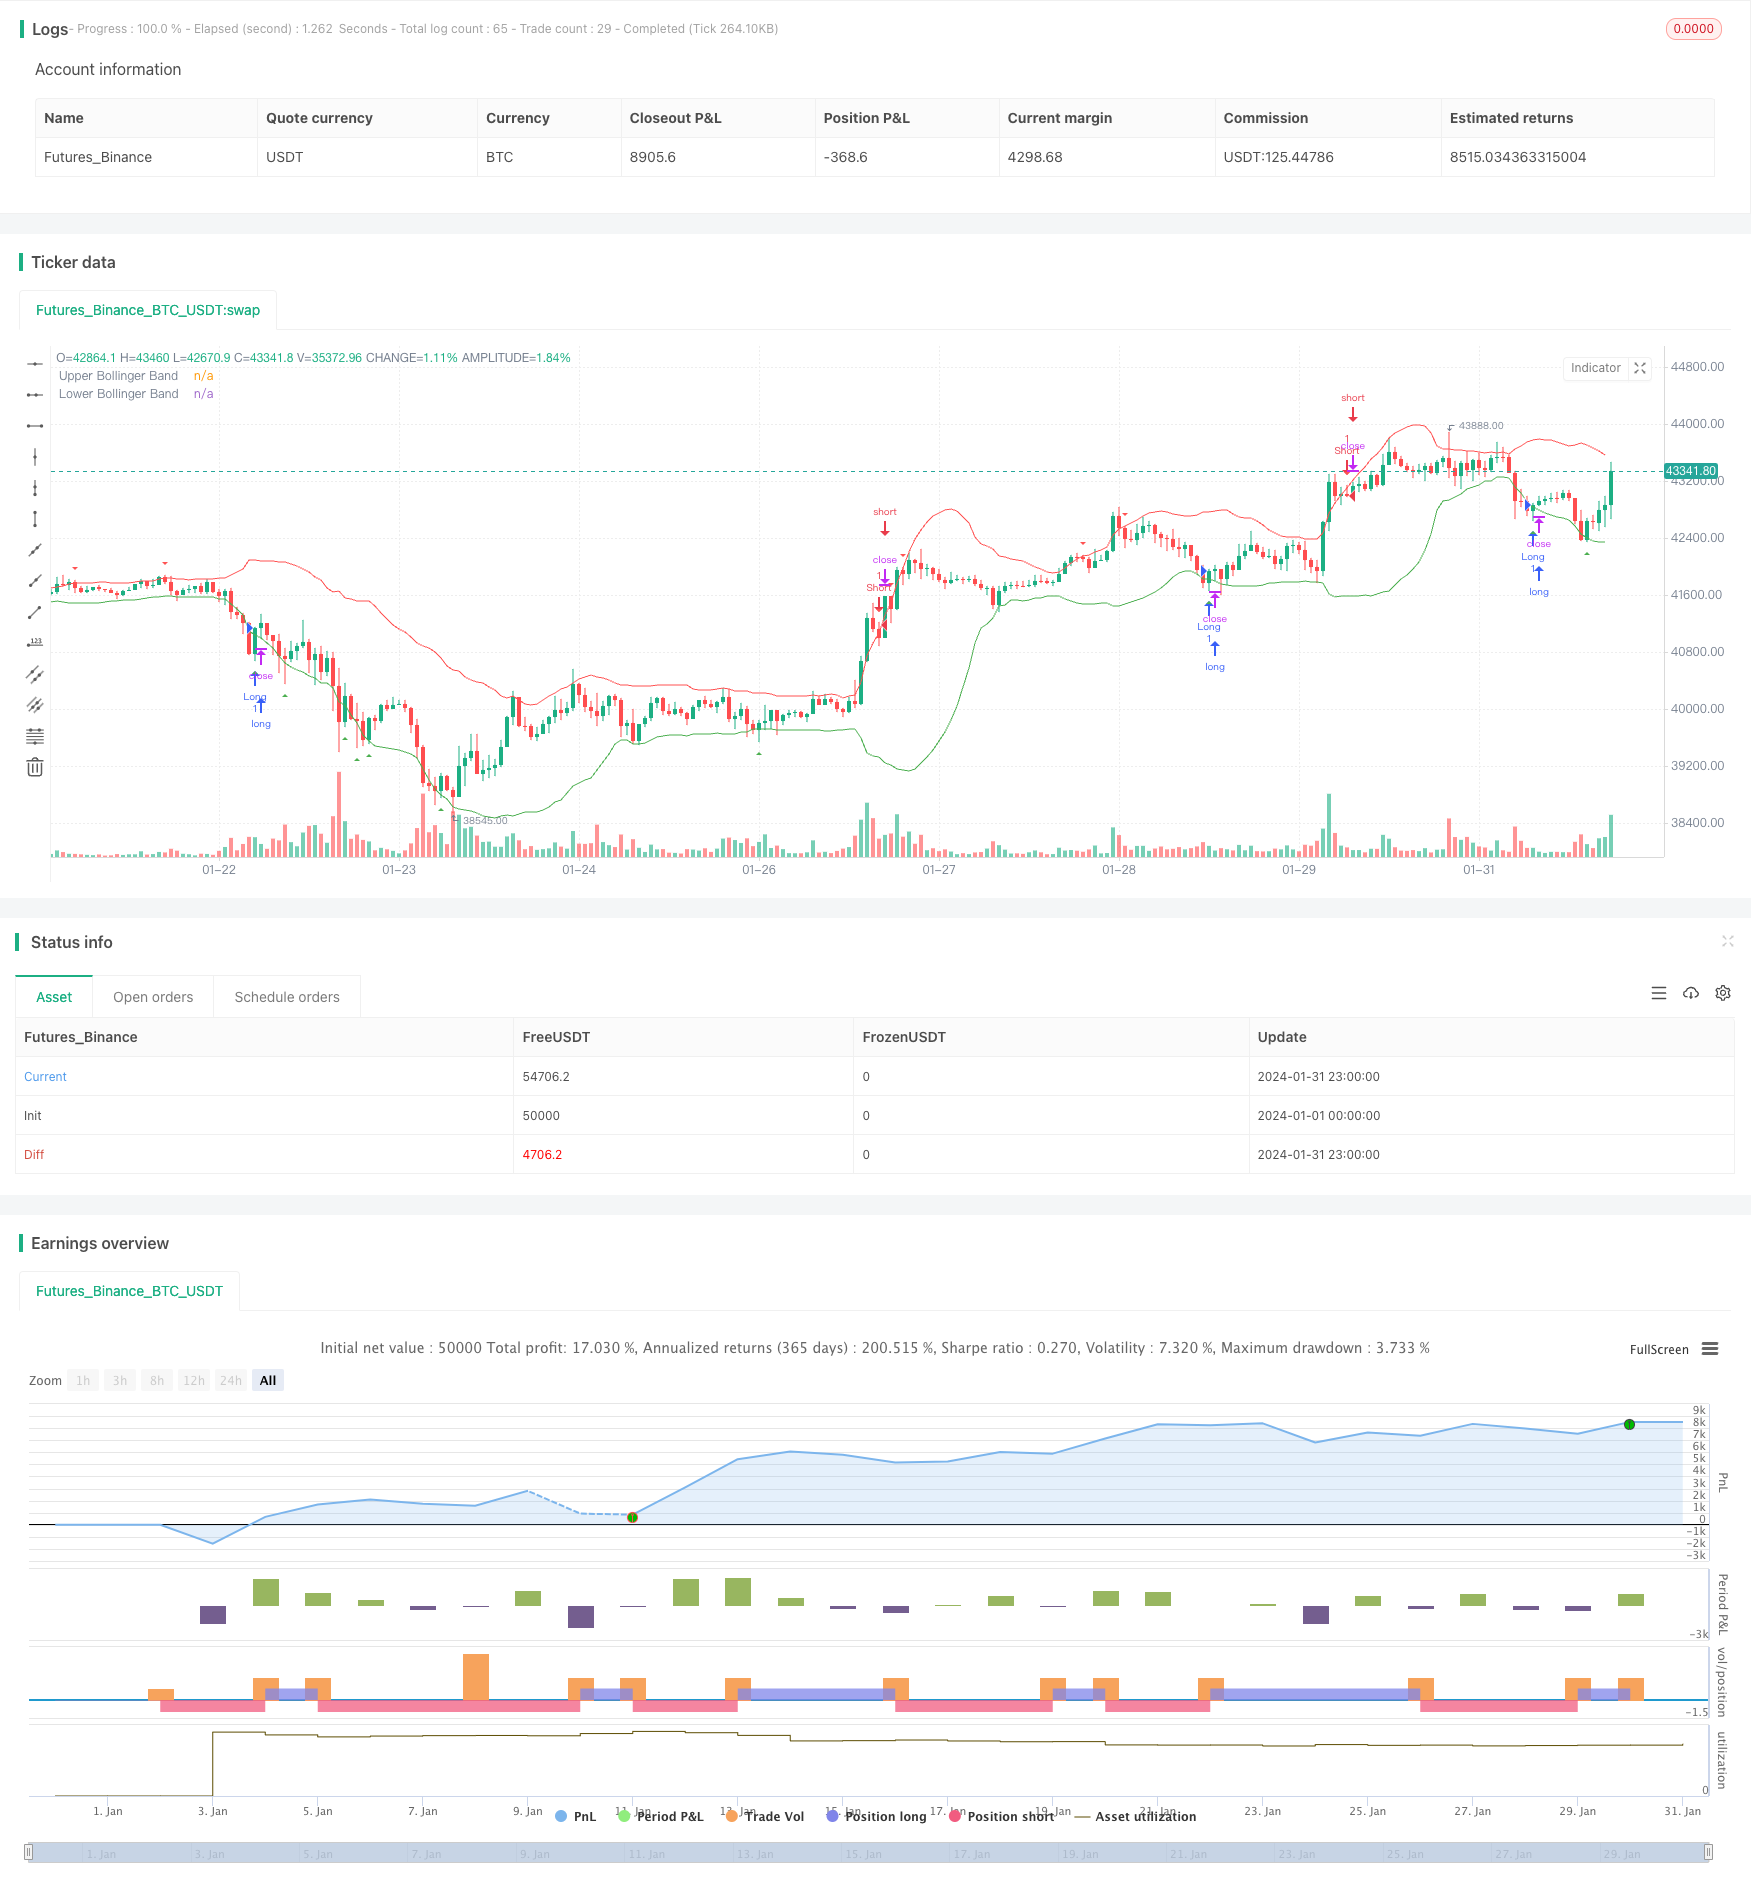
这个策略基于Bollinger Bands指标展开短线交易,利用Bollinger Bands的上下轨提供突破买入和卖出信号,属于简单型动量追踪策略。主要适用于短线追踪,追捧价格趋势的交易策略。
该策略主要依赖Bollinger Bands指标,Bollinger Bands包括中轨、上轨和下轨3条线。中轨线代表收盘价的N日简单移动平均线,上轨线由中轨线加2倍标准差计算,下轨线由中轨线减2倍标准差计算。当价格从下轨向上突破时生成买入信号;当价格从上轨向下突破时生成卖出信号。
该策略的主要交易逻辑是:
-
使用sma()函数计算收盘价的N日(默认20日)简单移动平均线作为Bollinger Bands的中轨线
-
使用stdev()函数基于收盘价计算N日(默认20日)标准差
-
中轨线±2倍标准差构成Bollinger Bands的上下轨
-
收盘价向上突破下轨时,产生买入信号
-
收盘价向下突破上轨时,产生卖出信号
-
使用plotshape等函数在K线图上标记买入卖出信号
-
策略逻辑简单,容易理解运用
-
指标参数少,便于优化调整
-
能够有效跟踪市场趋势,追捧动量
-
回撤风险较小
-
容易产生错过反转的风险
-
参数设置不当可能导致交易频率过高
-
上下轨突破判断对市场波动较为敏感
-
效果与参数设置高度相关,需要谨慎测试优化
-
调整Bollinger Bands的参数,优化移动平均线周期及标准差的倍数
-
结合其他指标过滤交易信号,避免错误交易
-
添加止损机制,控制单笔损失
-
不同品种、周期参数设置不同,需要分别测试
该策略整体来说是一个非常典型且实用的短线动量追踪策略,通过简单的指标框架就能把握市场趋势,适合短线操作。但也存在一些缺点,如对参数敏感,信号过滤不足等问题。通过进一步优化指标参数,或加入其他辅助指标,可以提高策略的稳定性和收益率。
||
This strategy conducts short-term trading based on the Bollinger Bands indicator, utilizing the upper and lower rails of Bollinger Bands to provide breakthrough buying and selling signals. It belongs to a simple momentum tracking strategy. It is mainly suitable for short-term tracking and chasing price trends.
The strategy relies mainly on the Bollinger Bands indicator. Bollinger Bands includes middle rail, upper rail and lower rail. The middle rail represents the N-day simple moving average of the closing price. The upper rail is calculated by the middle rail plus 2 times the standard deviation. The lower rail is calculated by the middle rail minus 2 times the standard deviation. When the price breaks through the lower rail upwards, a buy signal is generated. When the price breaks through the upper rail downwards, a sell signal is generated.
The main trading logic of this strategy is:
-
Use the sma() function to calculate the N-day (default 20-day) simple moving average of the closing price as the middle rail of Bollinger Bands
-
Use the stdev() function to calculate the N-day (default 20-day) standard deviation based on the closing price
-
The upper and lower rails of Bollinger Bands are composed of the middle rail ± 2 times the standard deviation
-
When the closing price breaks through the lower rail upward, a buy signal is generated
-
When the closing price breaks through the upper rail downward, a sell signal is generated
-
Use functions like plotshape to mark buy and sell signals on the candlestick chart
-
The strategy logic is simple and easy to understand and use
-
Less indicator parameters, easy to optimize and adjust
-
Can effectively track market trends and chase momentum
-
Relatively small pullback risk
-
Prone to missing reversal risks
-
Improper parameter settings may lead to excessively high trading frequency
-
Breakthrough judgements of upper and lower rails are quite sensitive to market fluctuations
-
The effect is highly related to parameter settings. Careful testing and optimization is needed.
-
Adjust parameters of Bollinger Bands, optimize moving average period and times of standard deviation
-
Add filters with other indicators to avoid wrong trades
-
Add stop loss mechanisms to control single loss
-
Different products and cycles need different parameter settings. Separate testing is needed.
Overall, this is a very typical and practical short-term momentum tracking strategy. It can grasp market trends through a simple indicator framework and suits short-term operations. But there are also some disadvantages like sensitivity to parameters, insufficient signal filtering, etc. Further optimizing indicator parameters or adding other auxiliary indicators can improve the stability and profitability of the strategy.
[/trans]
Strategy Arguments
| Argument | Default | Description |
|---|---|---|
| v_input_1 | 20 | Bollinger Bands Length |
| v_input_2 | 2 | Multiplier |
Source (PineScript)
/*backtest
start: 2024-01-01 00:00:00
end: 2024-01-31 23:59:59
period: 1h
basePeriod: 15m
exchanges: [{"eid":"Futures_Binance","currency":"BTC_USDT"}]
*/

//@version=4
strategy("arasmuz2.0", overlay=true)

// Bollinger Bands Parametreleri
length = input(20, title="Bollinger Bands Length")
mult = input(2.0, title="Multiplier")

// Bollinger Bands Hesaplamaları
basis = sma(close, length)
upper_band = basis + mult * stdev(close, length)
lower_band = basis - mult * stdev(close, length)

// Long (Alım) Koşulları
longCondition = crossover(close, lower_band)

// Short (Satım) Koşulları
shortCondition = crossunder(close, upper_band)

// Long (Alım) Giriş
strategy.entry("Long", strategy.long, when=longCondition)

// Short (Satım) Giriş
strategy.entry("Short", strategy.short, when=shortCondition)

// Al sinyalini mumun altına koy
plotshape(series=longCondition, title="Buy Signal", color=color.green, style=shape.triangleup, location=location.belowbar, size=size.small)

// Sat sinyalini mumun üstüne koy
plotshape(series=shortCondition, title="Sell Signal", color=color.red, style=shape.triangledown, location=location.abovebar, size=size.small)

// Bollinger Bands'ı Grafik Üzerinde Görüntüle
plot(upper_band, color=color.red, title="Upper Bollinger Band")
plot(lower_band, color=color.green, title="Lower Bollinger Band")
Detail
https://www.fmz.com/strategy/443094
Last Modified
2024-02-29 11:07:35