Name
基于波浪趋势的交易策略The-Wave-Trend-Trading-Strategy-Based-on-LazyBear
Author
ChaoZhang
Strategy Description
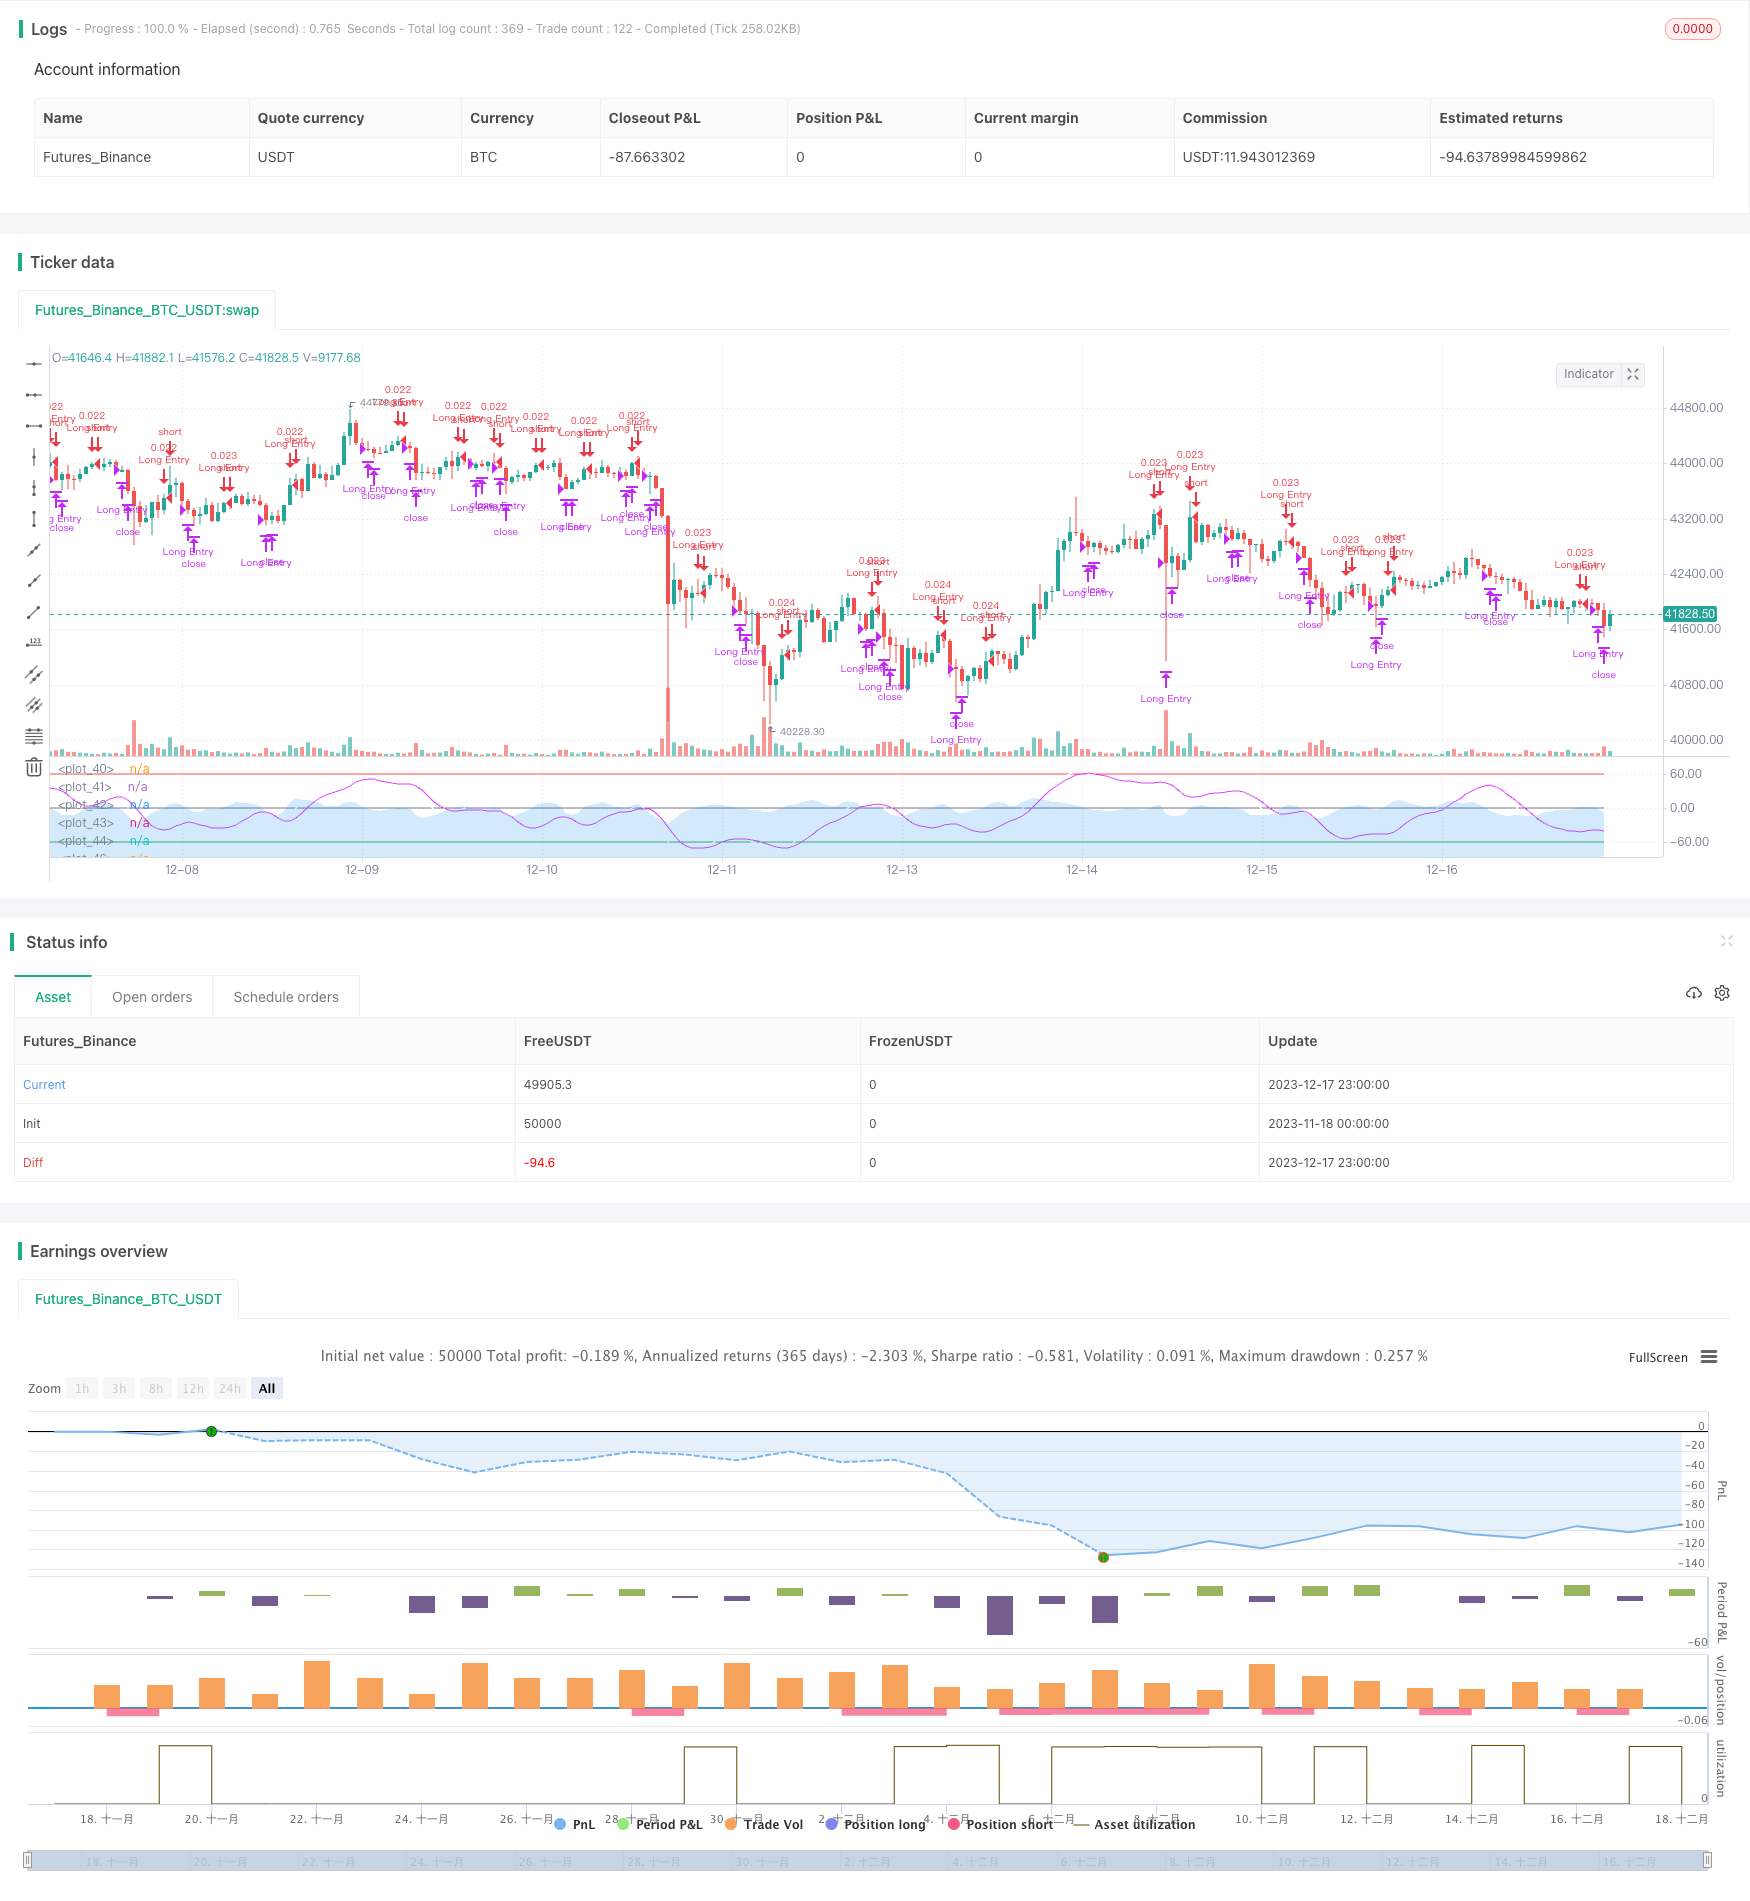
这是一个基于 LazyBear 的波浪趋势指标的交易策略。该策略通过计算价格波动的波浪趋势,判断市场的超买超卖情况,进行 longing 和 shorting。
该策略主要基于 LazyBear 的波浪趋势指标。首先计算价格的平均价(AP),然后计算 AP 的指数移动平均线(ESA)和绝对价格变动的指数移动平均线(D)。基于此计算出波动指数(CI),再计算 CI 的指数移动平均线,得到波浪趋势线(WT)。WT 后续再通过简单移动平均生成 WT1 和 WT2。当 WT1 上穿 WT2 时为黄金交叉,做多;当 WT1 下穿 WT2 时为死亡交叉,做空。
这是一个非常简单但非常实用的趋势跟踪策略。主要有以下优势:
- 基于波浪趋势指标,可以清晰识别价格趋势和市场情绪
- 通过 WT 的黄金交叉和死亡交叉来判断做多和做空点,操作简单
- 可自定义参数调整 WT 线的敏感度,适应不同周期
- 可添加进一步条件筛选信号,例如限制交易时间窗口
该策略也存在一些风险:
- 作为趋势跟踪策略,在盘整市场中容易产生大量错误信号
- WT 线本身滞后性较强,可能错过价格快速转折点
- 默认参数可能并不适合所有的品种和周期,需要优化
- 没有止损机制,单向持仓时间可能过长
主要的解决方法是:
- 优化参数,调整 WT 线的灵敏度
- 添加其他指标进行 확证,避免误信号
- 设置止损和止盈
- 限制每天的交易次数或仓位
该策略还有进一步优化的空间:
- 优化 WT 的参数,使其更加灵敏或更加稳定
- 基于不同周期采用不同的参数组合
- 添加量价指标、波动率指标等作为确认信号
- 添加止损和止盈逻辑
- 丰富化持仓方式,例如金字塔加仓、网格交易等
- 结合机器学习等方法挖掘更好的特征和交易规则
本策略是一个非常简单实用的波浪趋势跟踪策略。它通过计算价格的波动趋势,识别市场的超买超卖状态,利用 WT 线的黄金交叉与死亡交叉发出交易信号。策略操作简单,容易实现。但作为趋势策略,它对股价的敏感程度和稳定性需要进一步优化,同时还需要配合其他指标和逻辑来避免误信号。总体来说,这是一个非常实用的策略模板,有很大的优化空间。
||
This is a trading strategy based on LazyBear's Wave Trend indicator. The strategy identifies market sentiment through computing the wave trend of price fluctuations, and makes long and short decisions accordingly.
The core of this strategy is LazyBear's Wave Trend indicator. It first calculates the average price (AP), then the exponential moving average of AP (ESA) and the absolute price movement (D). Based on ESA and D the strategy calculates the Volatility Index (CI), which then feeds into an exponential moving average to generate the Wave Trend line (WT). WT is further processed into WT1 and WT2 using simple moving averages. When WT1 crosses over WT2, it triggers the golden cross and goes long. When WT1 crosses below WT2, it triggers the death cross and goes short.
This is a very simple but practical trend following strategy. The main advantages are:
- It identifies price trend and market sentiment clearly based on the Wave Trend indicator
- Simple trading logic of going long/short based on golden/death crosses of WT lines
- Customizable parameters to adjust sensitivity of WT for different cycles
- Flexibility to add further filters such as trading time window
There are some risks to this strategy:
- As a trend following strategy, it can generate many false signals during range-bound markets
- The lagging nature of WT may cause missed turns
- Default parameters may not suit all products and cycles
- No stop loss mechanism, holding period can be very long
The main solutions are:
- Optimize parameters to tune sensitivity of WT
- Add other indicators for confirmation to avoid false signals
- Employ stop loss and take profit
- Limit daily trades or positions
There is room for further optimization:
- Optimize WT parameters for better sensitivity or stability
- Use different parameter sets based on cycles
- Add indicators like volume, volatility for confirmation
- Add stop loss and take profit
- Enrich trading logic like pyramiding, grid trading
- Explore better features and rules using machine learning
In summary, this is a very simple and practical wave trend following strategy. By modeling the wave trend of price fluctuations, it identifies overbought and oversold market conditions to generate trade signals using WT's golden crosses and death crosses. The strategy is easy to implement but may require further optimization for sensitivity and stability. As a trend following strategy, it also needs additional filters and logic to avoid false signals. Overall this serves as a useful strategy template with lots of room for improvements.
[/trans]
Strategy Arguments
| Argument | Default | Description |
|---|---|---|
| v_input_1 | true | From Month |
| v_input_2 | true | From Day |
| v_input_3 | 2021 | From Year |
| v_input_4 | true | Thru Month |
| v_input_5 | true | Thru Day |
| v_input_6 | 2112 | Thru Year |
| v_input_7 | true | Show Date Range |
| v_input_8 | 10 | Channel Length |
| v_input_9 | 21 | Average Length |
| v_input_10 | 60 | Over Bought Level 1 |
| v_input_11 | 53 | Over Bought Level 2 |
| v_input_12 | -60 | Over Sold Level 1 |
| v_input_13 | -53 | Over Sold Level 2 |
Source (PineScript)
/*backtest
start: 2023-11-18 00:00:00
end: 2023-12-18 00:00:00
period: 1h
basePeriod: 15m
exchanges: [{"eid":"Futures_Binance","currency":"BTC_USDT"}]
*/

//
// @author LazyBear
//
// If you use this code in its original/modified form, do drop me a note.
//
//@version=4

// === INPUT BACKTEST RANGE ===
fromMonth = input(defval = 1,    title = "From Month",      type = input.integer, minval = 1, maxval = 12)
fromDay   = input(defval = 1,    title = "From Day",        type = input.integer, minval = 1, maxval = 31)
fromYear  = input(defval = 2021, title = "From Year",       type = input.integer, minval = 1970)
thruMonth = input(defval = 1,    title = "Thru Month",      type = input.integer, minval = 1, maxval = 12)
thruDay   = input(defval = 1,    title = "Thru Day",        type = input.integer, minval = 1, maxval = 31)
thruYear  = input(defval = 2112, title = "Thru Year",       type = input.integer, minval = 1970)

// === INPUT SHOW PLOT ===
showDate  = input(defval = true, title = "Show Date Range", type = input.bool)

// === FUNCTION EXAMPLE ===
start     = timestamp(fromYear, fromMonth, fromDay, 00, 00)        // backtest start window
finish    = timestamp(thruYear, thruMonth, thruDay, 23, 59)        // backtest finish window
window()  => true       // create function "within window of time"

n1 = input(10, "Channel Length")
n2 = input(21, "Average Length")
obLevel1 = input(60, "Over Bought Level 1")
obLevel2 = input(53, "Over Bought Level 2")
osLevel1 = input(-60, "Over Sold Level 1")
osLevel2 = input(-53, "Over Sold Level 2")

ap = hlc3
esa = ema(ap, n1)
d = ema(abs(ap - esa), n1)
ci = (ap - esa) / (0.015 * d)
tci = ema(ci, n2)

wt1 = tci
wt2 = sma(wt1,4)

plot(0, color=color.gray)
plot(obLevel1, color=color.red)
plot(osLevel1, color=color.green)
plot(obLevel2, color=color.red, style=3)
plot(osLevel2, color=color.green, style=3)

plot(wt1, color=color.white)
plot(wt2, color=color.fuchsia)
plot(wt1-wt2, color=color.new(color.blue, 80), style=plot.style_area)

//Strategy
strategy(title="T!M - Wave Trend Strategy", overlay = false, precision = 8, max_bars_back = 200, pyramiding = 0, initial_capital = 1000, currency = currency.NONE, default_qty_type = strategy.cash, default_qty_value = 1000, commission_type = "percent", commission_value = 0.1, calc_on_every_tick=false, process_orders_on_close=true)

longCondition  = crossover(wt1, wt2)
shortCondition = crossunder(wt1, wt2)

strategy.entry(id="Long Entry", comment="buy", long=true, when=longCondition and window())
strategy.close("Long Entry", comment="sell", when=shortCondition and window())

//strategy.entry(id="Short Entry", long=false, when=shortCondition)
Detail
https://www.fmz.com/strategy/435853
Last Modified
2023-12-19 12:07:14
