Name
基于布林带指标的简单量化交易策略Bollinger-Bands-Breakout-Strategy
Author
ChaoZhang
Strategy Description
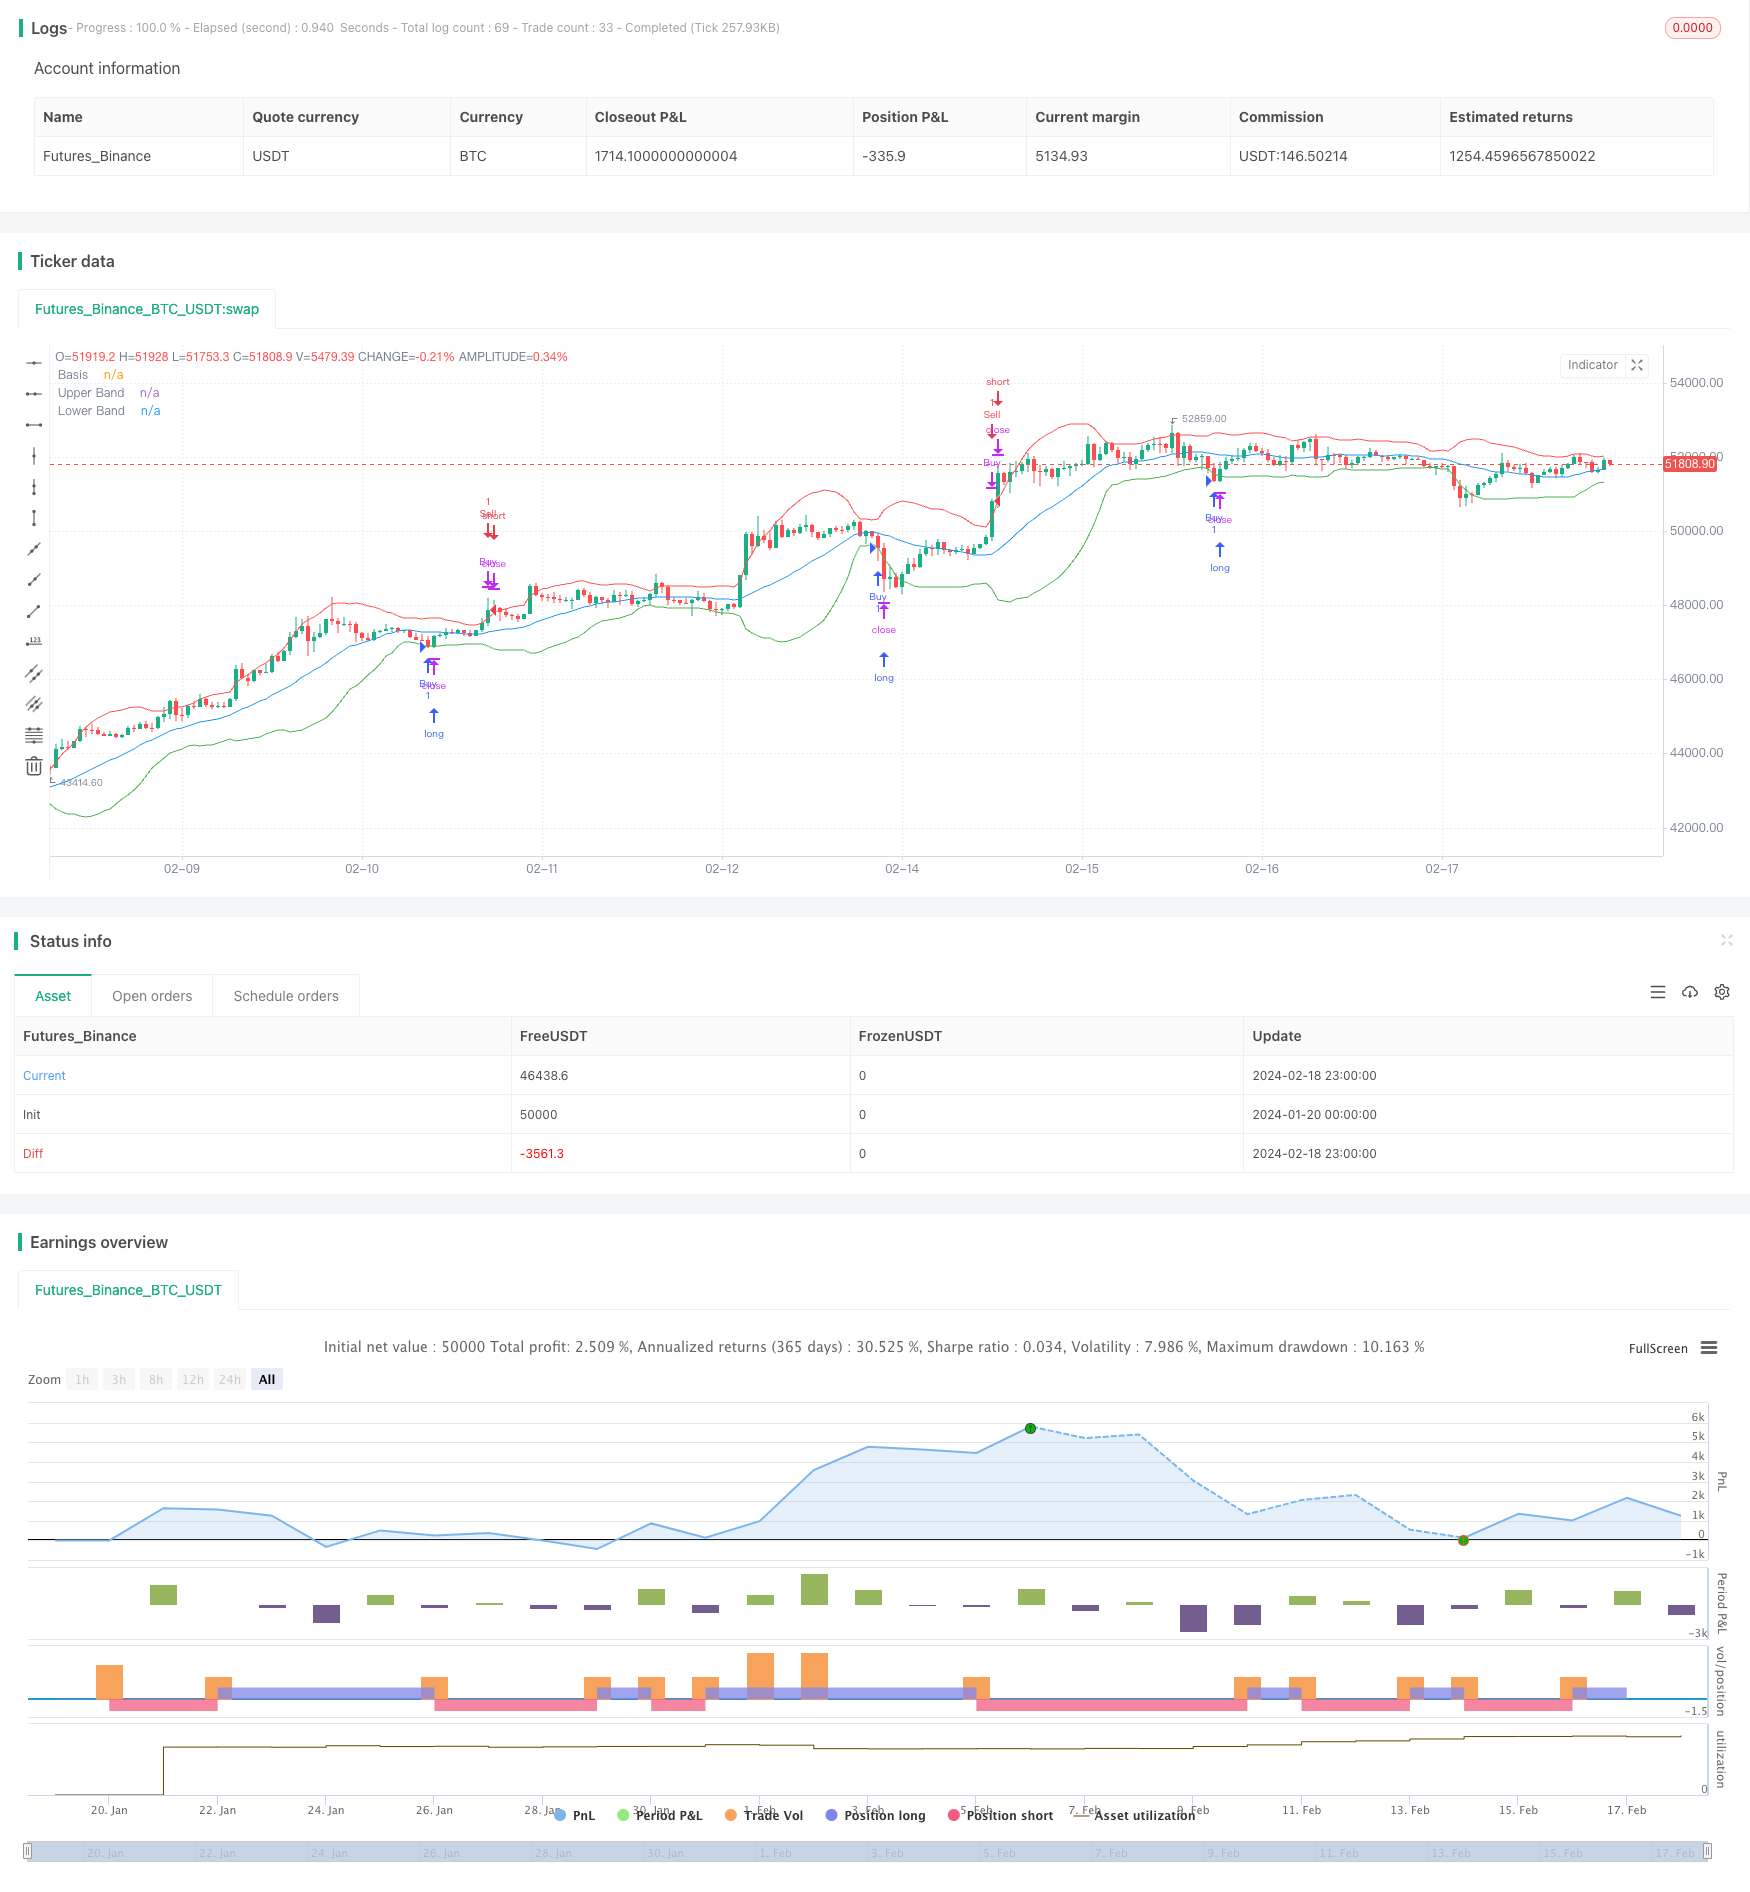
布林带突破策略是一个基于布林带指标的简单量化交易策略。该策略利用布林带上下轨提供的动态支撑阻力位,设定价格突破布林带上下轨时的长仓入场和平仓出场条件,以捕捉股价的突破性行情。
布林带指标由班迪·布林(John Bollinger)在20世纪80年代提出,它由n天移动平均线及其m倍标准差构成。移动平均线可看作是价格的中轴线,而标准差可看作是价格波动的幅度。标准差数值较大时,表示价格波动较为剧烈;标准差数值较小时,表示价格波动温和。
该策略的入场条件是:当收盘价跌破布林带下轨时,做多入场;当收盘价突破布林带上轨时,做空入场。出场条件是:做多头寸存在时,收盘价突破布林带上轨后平仓;做空头寸存在时,收盘价跌破布林带下轨后平仓。
该策略属于趋势跟踪策略,通过捕捉价格突破布林带上下轨的趋势性突破,盈利模式是通过趋势行情扩大头寸盈利。
-
使用布林带指标作为动态的支撑阻力位,避免使用固定的价格水平,从而适应市场的变化
-
策略参考了趋势和波动率, Entscheidungen 不仅基于价格水平,也基于市场波动率,可以减少假信号
-
突破框架简单直接,容易理解和实施
-
可灵活调整布林带参数,适用于不同品种和参数市场
-
布林带指标参数设置不当可能导致交易信号过于频繁,产生过多不必要的交易
-
突破信号可能是短期的价格扰动,不能持续趋势,可能产生错误交易
-
策略没有考虑止损,存在一定的决策风险和损失控制风险
-
仅基于技术指标,没有结合基本面信息,可能错过重要的基本面趋势转折点
-
没有考虑到不同市场品种的特点,盈亏情况可能受特定市场影响
-
优化布林带参数,提高参数鲁棒性
-
加入止损机制,控制单笔损失
-
结合不同时间周期的布林带,构建多周期交易决策
-
结合交易量,避免部分假突破信号
-
添加基本面因素判别,确定入场时机和头寸规模
-
测试不同市场品种的数据,评估策略跨品种适应性
布林带突破策略是一个简单直观的趋势跟踪策略。它利用布林带指标提供的动态支撑阻力判定价格趋势性突破,构建长仓入场和平仓出场条件。策略优势是框架简单,容易实现,能捕捉价格趋势性机会。需要注意控制风险,避免产生过于频繁的交易。通过多方面测试和优化,布林带突破策略可以成为一个有效的量化交易策略选择。
||
The Bollinger Bands breakout strategy is a simple quantitative trading strategy based on the Bollinger Bands indicator. The strategy utilizes the dynamic support and resistance levels provided by the upper and lower bands of Bollinger Bands to set entry rules for long positions when prices break out of the bands and exit rules when prices break back through the bands, aiming to capture trend-following opportunities in the price movements.
The Bollinger Bands indicator was developed by John Bollinger in the 1980s. It consists of an n-period moving average and m times standard deviation above and below it. The moving average acts as the midpoint, while the standard deviation accounts for the volatility. High standard deviation values indicate increased volatility, while low values indicate decreased volatility.
The entry condition for this strategy is: a long position will be taken when the closing price breaks below the lower Bollinger band; a short position will be taken when the closing price breaks above the upper Bollinger band. The exit rules are: for existing long positions, liquidate when closing price breaks back above the upper band; for existing short positions, cover when closing price breaks back below the lower band.
This is a trend-following strategy. By capturing trend continuation signaled by the breaking of Bollinger Bands, it aims to profit from sustained directional price movements.
-
Using Bollinger Bands as dynamic support/resistance levels instead of fixed prices makes the strategy adaptive to evolving market conditions.
-
Decisions are based on both price levels and volatility conditions, avoiding some false signals.
-
The breakout framework is simple and intuitive.
-
Flexible tuning of parameters makes the strategy adaptable across products and markets.
-
Poor parameter tuning of indicators may cause too frequent trading and unnecessary costs.
-
Breakout signals may just be short-term price fluctuations instead of sustainable trends.
-
The lack of stop loss exposes the strategy to uncontrolled loss risks.
-
The purely technical system misses fundamental trend reversals.
-
Performance may vary across different products without adjustments.
-
Optimize parameters to enhance robustness.
-
Incorporate stop loss orders to limit losses.
-
Build multi-timeframe system to improve decisions.
-
Add volume filters to avoid false signals.
-
Complement fundamentals to better time entries and size positions.
-
Evaluate strategy on more products to test adaptiveness.
The Bollinger Bands breakout strategy provides a simple trend-following approach by riding momentum signaled by indicator-based breakouts. Its strength lies in the dynamic identification of trend continuations. Proper risk controls and robustness enhancements can turn improve it into a viable systematic strategy.
[/trans]
Strategy Arguments
| Argument | Default | Description |
|---|---|---|
| v_input_int_1 | 20 | Bollinger Bands Length |
| v_input_string_1 | 0 | Basis MA Type: SMA |
| v_input_1_close | 0 | Source: close |
| v_input_float_1 | 2 | StdDev Multiplier |
| v_input_int_2 | false | Offset |
Source (PineScript)
/*backtest
start: 2024-01-20 00:00:00
end: 2024-02-19 00:00:00
period: 1h
basePeriod: 15m
exchanges: [{"eid":"Futures_Binance","currency":"BTC_USDT"}]
*/

//@version=5
strategy("Bollinger Bands Strategy", overlay=true)

length = input.int(20, title="Bollinger Bands Length", minval=1)
maType = input.string("SMA", title="Basis MA Type", options=["SMA", "EMA", "SMMA (RMA)", "WMA", "VWMA"])
src = input(close, title="Source")
mult = input.float(2.0, title="StdDev Multiplier", minval=0.001, maxval=50)
offset = input.int(0, title="Offset", minval=-500, maxval=500)

ma(source, length, _type) =>
    switch _type
        "SMA" => ta.sma(source, length)
        "EMA" => ta.ema(source, length)
        "SMMA (RMA)" => ta.rma(source, length)
        "WMA" => ta.wma(source, length)
        "VWMA" => ta.vwma(source, length)

basis = ma(src, length, maType)
dev = mult * ta.stdev(src, length)
upper = basis + dev + offset
lower = basis - dev - offset

// Define strategy entry and exit conditions
strategy.entry("Buy", strategy.long, when=close < lower)
strategy.close("Buy", when=close > upper)

strategy.entry("Sell", strategy.short, when=close > upper)
strategy.close("Sell", when=close < lower)

// Plotting the Bollinger Bands
plot(basis, color=color.blue, title="Basis")
plot(upper, color=color.red, title="Upper Band")
plot(lower, color=color.green, title="Lower Band")
Detail
https://www.fmz.com/strategy/442259
Last Modified
2024-02-20 15:53:12
