Name
基于多空双轨的追踪止盈策略Myo_LS_D-Quantitative-Strategy
Author
ChaoZhang
Strategy Description
[trans]
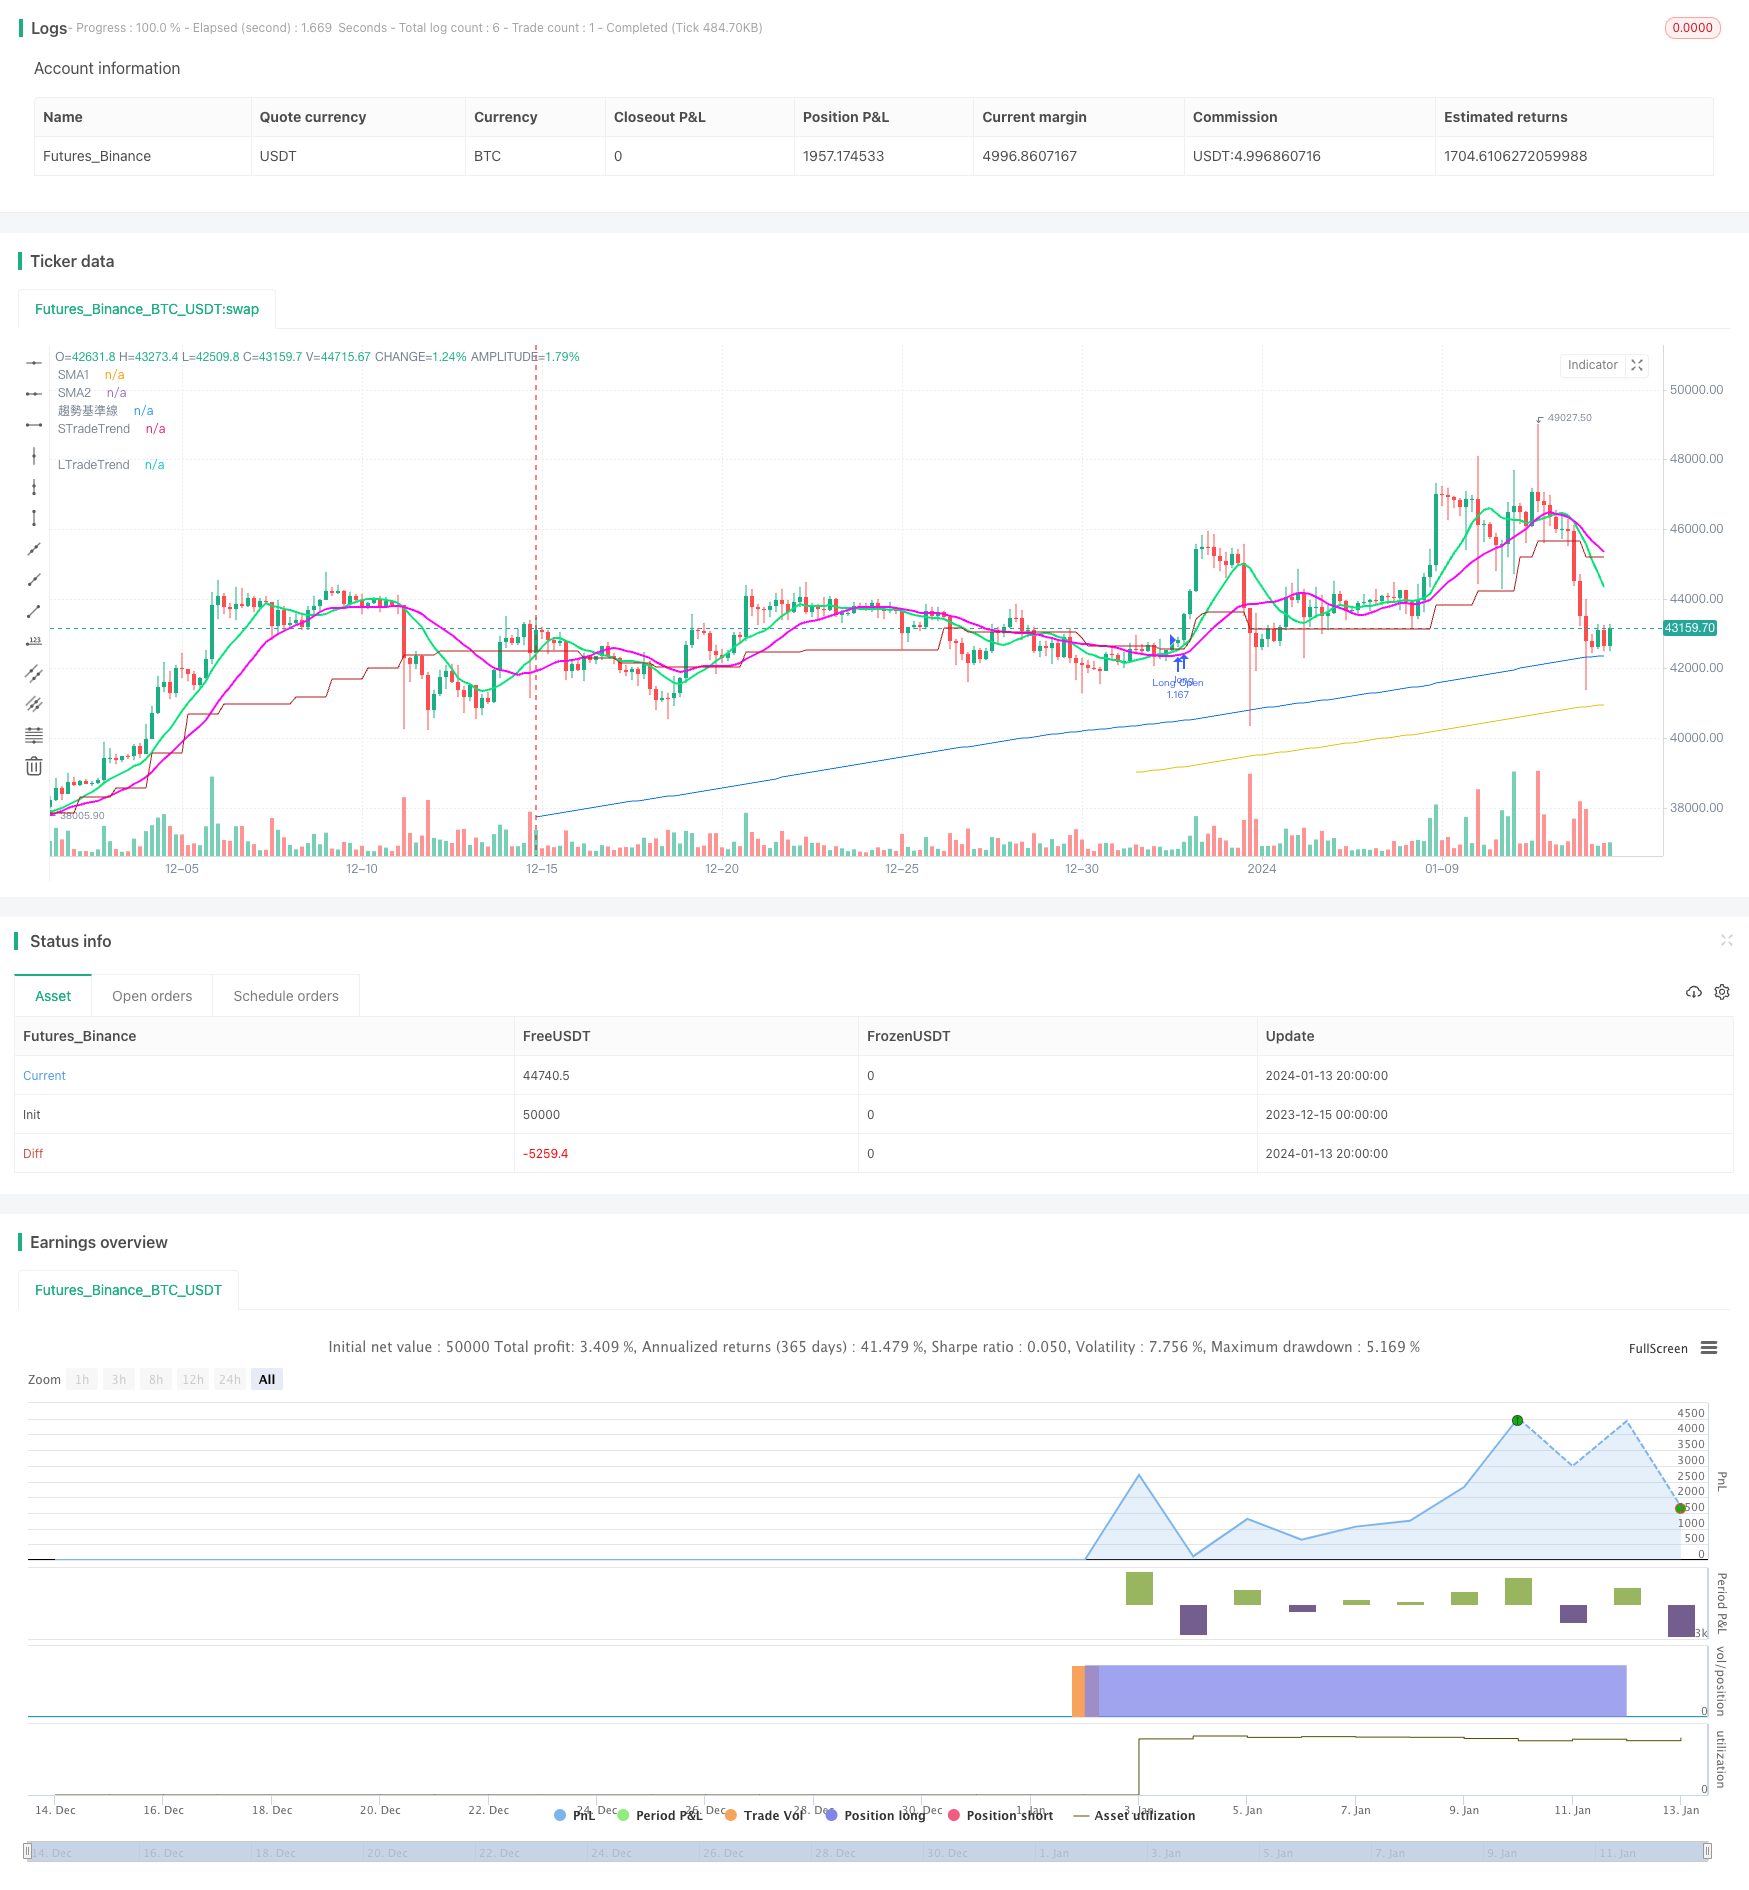
Myo_LS_D量化策略是一个基于多空双轨的追踪止盈策略。该策略综合利用均线、价格突破、风险回报比等多个指标构建交易信号。在趋势判断准确的前提下,实现了较高的胜率和盈利率。
该策略主要由趋势判断模块、做多模块、做空模块、追踪止盈模块等组成。
-
趋势判断模块运用donchain通道判断整体趋势方向。做多进入的前提是处于上升趋势,做空则需要处于下降趋势。
-
做多模块考量了新的高点、低点、长线均线位置等因素。做空模块考量了新的高点、低点、短线均线位置等因素。这确保了在向上或向下突破关键价格点时建仓。
-
追踪止盈模块使用两条不同周期的SMA均线实时追踪价格变动。当价格跌破均线时平仓止盈。这种实时追踪可以最大化获取趋势中的利润。
-
止损设置考虑扩大止损,确保止损点距离支持位较远,避免被震出。
该策略最大的优势在于多空分离建仓,追踪止盈策略。具体来说主要体现在:
-
多空分离可以最大化抓取单边趋势行情的盈利机会。
-
追踪止盈通过实时调整可以获得更高的盈利率。与传统止盈方法相比,收益能获得显著提升。
-
扩大止损可以减少被震出的概率,降低亏损风险。
该策略主要的风险集中在以下几点:
-
趋势判断出现错误,可能造成逆势建仓亏损。可以适当调整donchain参数或添加其他指标判断来优化。
-
追踪止盈过于激进,可能提前止盈无法持续获利。可以适当扩大止盈均线间距来优化。
-
止损范围过小,可能增加被震出概率。可以适当扩大止损幅度以降低风险。
该策略主要可以从以下几个方面继续优化:
-
优化趋势判断模块,提高判断准确性。可考虑结合更多指标如MACD等来实现。
-
调整追踪止盈方式,进一步扩大获利空间。例如可以按比例移动止盈线等。
-
扩大止损范围或考虑缩进止损来进一步降低被震出概率。
-
不同品种参数不一样,可以训练获得最优参数组合。进一步提升策略收益。
Myo_LS_D策略总体来说是一个比较成熟稳定的多空追踪止盈策略。它优势明显,风险可控,是值得长期持有使用的量化方案之一。未来通过进一步优化,可以使其收益性能得到持续提升,成为更加卓越的量化策略。
||
The Myo_LS_D quantitative strategy is a dual-track tracking stop-profit strategy based on long and short positions. The strategy combines multiple indicators such as moving averages, price breakthroughs, and risk-return ratios to build trading signals. It achieves a high win rate and profit rate on the premise of accurate trend judgment.
The strategy consists mainly of a trend judgment module, long position module, short position module, tracking stop profit module, etc.
-
The trend judgment module uses the Donchain channel to determine the overall trend direction. The prerequisite for going long is an upward trend, while going short requires a downward trend.
-
The long position module takes into account factors such as new highs, lows, long moving average positions, etc. The short position module considers new highs, lows, short moving average positions and other factors. This ensures the opening of positions when breaking through critical price points upwards or downwards.
-
The tracking stop profit module uses two SMA moving averages of different cycles to track price changes in real time. When the price breaks through the moving average line, the position is closed for profit. This kind of real-time tracking can maximize profits from the trend.
-
Stop loss setting considers enlarged stop loss to keep the stop loss point far away from the support level to avoid being knocked out.
The biggest advantage of this strategy is the separate long and short position building and tracking stop profit strategy. Specifically, it is mainly embodied in:
-
Separate long and short positions can maximize profit opportunities by capturing one-sided trend trading opportunities.
-
Tracking stop profit can obtain higher profit margin through real-time adjustment. Compared with traditional stop profit methods, income can be significantly improved.
-
Enlarged stops can reduce the probability of being knocked out and reduce the risk of losses.
The main risks of this strategy are concentrated in the following points:
-
Incorrect trend judgment may result in contrarian positions and losses. Optimization can be achieved by appropriately adjusting Donchain parameters or adding other indicators for judgment.
-
Tracking stop profit is too aggressive and may prematurely stop profit without being able to sustain gains. Optimization can be achieved by appropriately increasing the spacing between stop profit moving averages.
-
The stop loss range is too small, which may increase the probability of being knocked out. Appropriately expanding the stop loss magnitude can mitigate risks.
The main optimization directions for this strategy are:
-
Optimize the trend judgment module to improve judgment accuracy. Consider combining more indicators such as MACD.
-
Adjust the tracking stop profit method to further expand profit space. For example, moving stop profit lines in proportion.
-
Expanding the stop loss range or considering shrinkage stops can further reduce the probability of being knocked out.
-
Different varieties have different parameters. Optimal parameter combinations can be obtained through training to further improve strategy returns.
In general, the Myo_LS_D strategy is a relatively mature and stable dual-track tracking stop-profit quantitative strategy. It has obvious advantages and controllable risks. It is one of the quantitative solutions worth holding for the long term. Future optimizations can enable continuous performance improvement to make it an even more superior quantitative strategy.
[/trans]
Strategy Arguments
| Argument | Default | Description |
|---|---|---|
| v_input_int_1 | 100 | 做多的止損長度 |
| v_input_int_2 | 100 | 做空的止損長度 |
| v_input_int_3 | 0 | 做多追蹤止盈SMA長度1: 10 |
| v_input_int_4 | 0 | 做多追蹤止盈SMA長度2: 20 |
| v_input_int_5 | 0 | 做空追蹤止盈SMA長度1: 5 |
| v_input_int_6 | 0 | 做空追蹤止盈SMA長度2: 10 |
| v_input_int_7 | 0 | 做多趨勢線: 400 |
| v_input_int_8 | 0 | 做空趨勢線: 300 |
| v_input_int_9 | 20 | 短期均價K線數量 |
| v_input_int_10 | 60 | 中期均價K線數量 |
| v_input_int_11 | 120 | 長期均價K線數量 |
| v_input_int_12 | 8 | 趨勢基準線 |
| v_input_int_13 | 26 | 做空基準線 |
Source (PineScript)
/*backtest
start: 2023-12-15 00:00:00
end: 2024-01-14 00:00:00
period: 4h
basePeriod: 15m
exchanges: [{"eid":"Futures_Binance","currency":"BTC_USDT"}]
*/

// This source code is subject to the terms of the Mozilla Public License 2.0 at https://mozilla.org/MPL/2.0/
// © agresiynin

//@version=5
// ©Myo_Pionex
strategy(
 title                  =   "Myo_simple strategy_LS_D",
 shorttitle             =   "Myo_LS_D",
 overlay                =   true )


// var
lowest_price = ta.lowest(low, 200)
highest_price = ta.highest(high, 200)
min_800 = ta.lowest(low, 800)
max_800 = ta.highest(high, 800)
tp_target_L = min_800 + (max_800 - min_800) * math.rphi
tp_target_S = max_800 - (max_800 - min_800) * math.rphi
sl_length_L = input.int(100, "做多的止損長度", minval = 50, maxval = 300, step = 50)
sl_length_S = input.int(100, "做空的止損長度", minval = 50, maxval = 300, step = 50)
sl_L = lowest_price * (1 - 0.005)
sl_S = highest_price * (1 + 0.005)
rrr_L = tp_target_L - sl_L / sl_L
rrr_S = ta.lowest(low, 800) + ta.highest(high, 800) - ta.lowest(low, 800) * math.rphi / ta.highest(high, 200) + 0.005 * ta.highest(high, 200) - ta.lowest(low, 200) - 0.005 * ta.lowest(low, 200)
smalen1 = input.int(10, "做多追蹤止盈SMA長度1", options = [5, 10, 20, 40, 60, 80])
smalen2 = input.int(20, "做多追蹤止盈SMA長度2", options = [5, 10, 20, 40, 60, 80])
smalen1_S = input.int(5, "做空追蹤止盈SMA長度1", options = [5, 10, 20, 40, 60, 80])
smalen2_S = input.int(10, "做空追蹤止盈SMA長度2", options = [5, 10, 20, 40, 60, 80])
TrendLength_L = input.int(400, "做多趨勢線", options = [100, 200, 300, 400, 500])
TrendLength_S = input.int(300, "做空趨勢線", options = [100, 200, 300, 400, 500])
SMA1 = ta.sma(close, smalen1)
SMA2 = ta.sma(close, smalen2)
SMA1_S = ta.sma(close, smalen1_S)
SMA2_S = ta.sma(close, smalen2_S)
shortlength = input.int(20, "短期均價K線數量")
midlength = input.int(60, "中期均價K線數量")
longlength = input.int(120, "長期均價K線數量")
ShortAvg = math.sum(close, shortlength)/shortlength
MidAvg = math.sum(close, midlength)/midlength
LongAvg = math.sum(close, longlength)/longlength

// Trend
basePeriods = input.int(8, minval=1, title="趨勢基準線")
basePeriods_Short = input.int(26, "做空基準線")
donchian(len) => math.avg(ta.lowest(len), ta.highest(len))
baseLine = donchian(basePeriods)
baseLine_Short = donchian(basePeriods_Short)
trend = request.security(syminfo.tickerid, "D", baseLine)
isUptrend = false
isDowntrend = false
baseLine_D = request.security(syminfo.tickerid, "D", baseLine)
plot(baseLine_D, color=#B71C1C, title="趨勢基準線")
if close[0] > baseLine_D
    isUptrend := true
if close[0] < baseLine_Short
    isDowntrend := true
// Long
// Condition
// entry
con_a = low > lowest_price ? 1 : 0
con_b = high > highest_price ? 1 : 0
con_c = close[0] > ta.sma(close, TrendLength_L) ? 1 : 0
con_d = isUptrend ? 1 : 0
con_e = rrr_L > 3 ? 1 : 0
con_a1 = close[0] > ShortAvg[shortlength] ? 1 : 0
con_b1 = close[0] > MidAvg[midlength] ? 1 : 0

// close
con_f = ta.crossunder(close, SMA1) and ta.crossunder(close, SMA2) ? 1 : 0
con_g = close < ta.lowest(low, sl_length_L)[1] * (1 - 0.005) ? 1 : 0

// exit
con_h = tp_target_L

// Main calculation
LongOpen = false
AddPosition_L = false

if con_a + con_b + con_c + con_e + con_a1 + con_b1 >= 4 and con_d >= 1
    LongOpen := true
// Short
// Condition
// entry
con_1 = high < highest_price ? 1 : 0
con_2 = low < lowest_price ? 1 : 0
con_3 = close[0] < ta.sma(close, TrendLength_S) ? 1 : 0
con_4 = isDowntrend ? 1 : 0
con_5 = rrr_S > 3 ? 1 : 0
con_11 = close[0] < ShortAvg[shortlength] ? 1 : 0
con_12 = close[0] < MidAvg[midlength] ? 1 : 0

// close
con_6 = ta.crossover(close, SMA1_S) and ta.crossover(close, SMA2_S) ? 1 : 0
con_7 = close > ta.highest(high, sl_length_S)[1] * (1 + 0.005) ? 1 : 0

// exit
con_8 = tp_target_S

// Main calculation
ShortOpen = false
AddPosition_S = false

if con_1 + con_2 + con_3 + con_4 + con_5 + con_11 + con_12 >= 5
    ShortOpen := true

//
// execute
//
strategy.initial_capital = 50000
if strategy.position_size == 0
    if LongOpen
        strategy.entry("Long Open" , strategy.long , comment= "Long Open " + str.tostring(close[0]), qty=strategy.initial_capital/close[0])

if strategy.position_size > 0
    if (con_f > 0 or con_g > 0 or ShortOpen) and close <= baseLine_D
        strategy.close_all(comment="Close Long " + str.tostring(close[0]))

if strategy.position_size == 0
    if ShortOpen
        strategy.entry("Short Open" , strategy.short , comment= "Short Open " + str.tostring(close[0]), qty=strategy.initial_capital/close[0])

if strategy.position_size < 0
    if (con_6 > 0 or con_7 > 0 or LongOpen) and close >= baseLine_D
        strategy.close_all(comment="Close Short " + str.tostring(close[0]))


plot(ta.sma(close, TrendLength_L), color=#e5c212, title="LTradeTrend")
plot(ta.sma(close, TrendLength_S), color=#1275e5, title="STradeTrend")
plot(SMA1, "SMA1", color = color.lime, linewidth = 2)
plot(SMA2, "SMA2", color = color.rgb(255, 0, 255), linewidth = 2)
Detail
https://www.fmz.com/strategy/438820
Last Modified
2024-01-15 14:56:03