Name
基于均线的震荡突破策略Oscillation-Breakthrough-Strategy-Based-on-Moving-Average
Author
ChaoZhang
Strategy Description
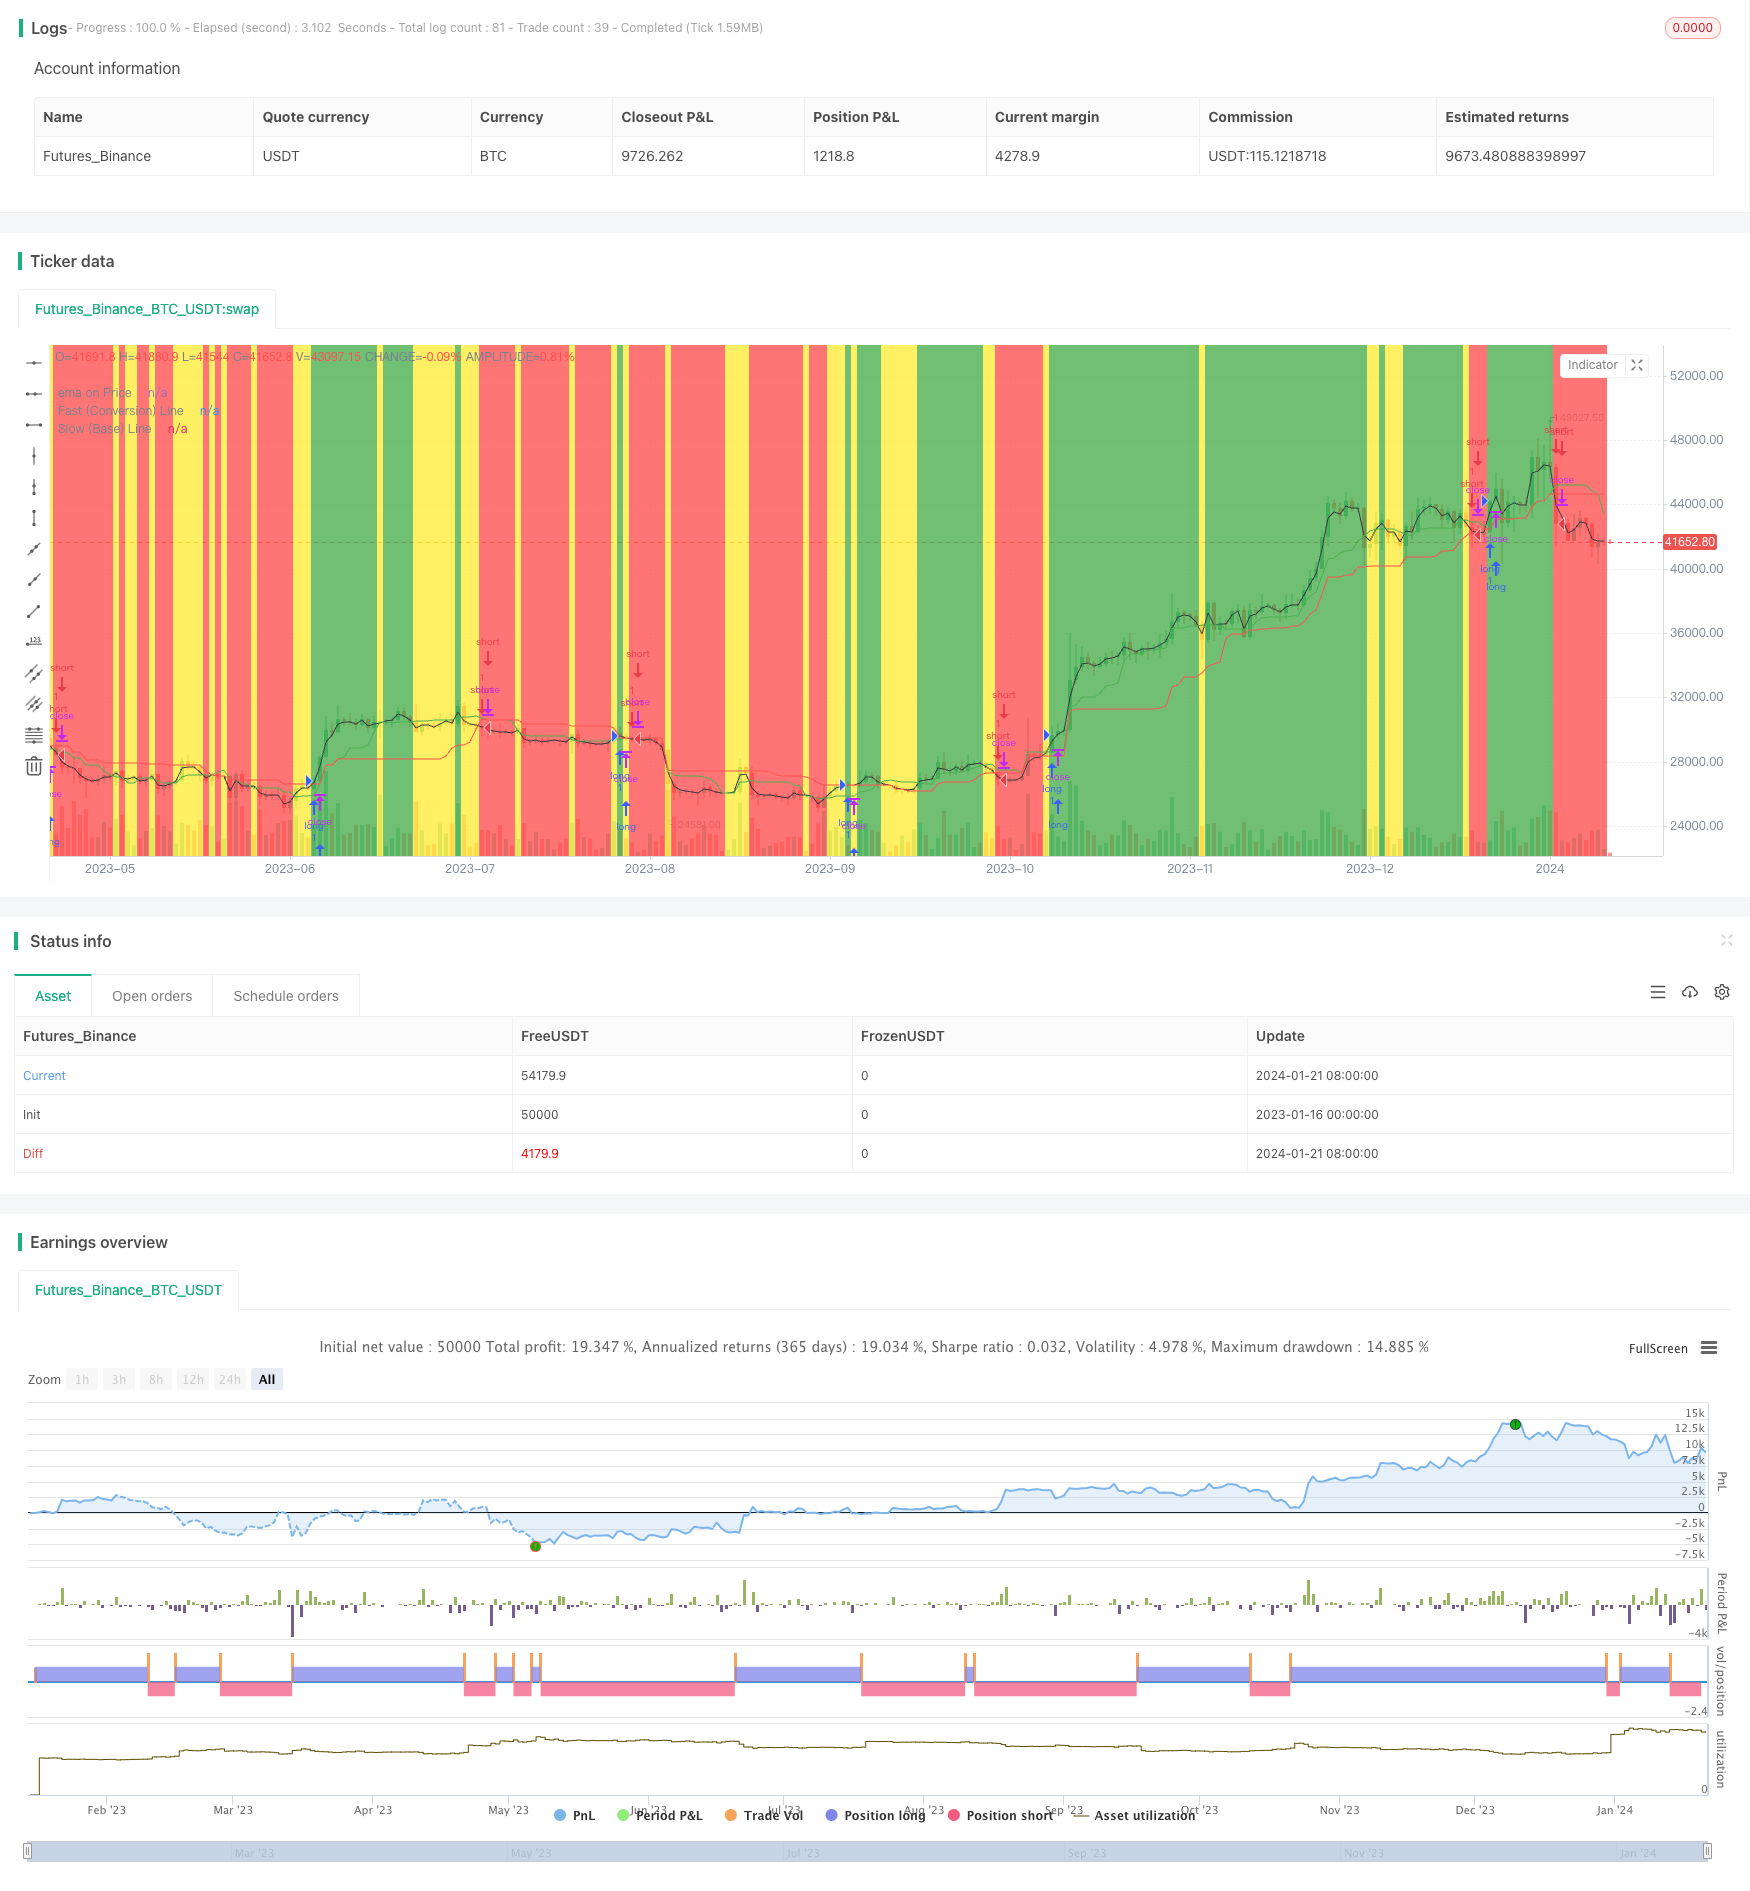
本策略名称为“基于均线的震荡突破策略”。该策略通过计算价格的不同周期的移动平均线,判断价格是否突破关键均线进行长短做单。当短周期均线突破长周期均线时做多头,当短周期均线跌破长周期均线时做空头。
本策略主要基于均线理论。移动平均线是技术分析中常用的分析工具,它平滑了价格数据过滤了短期价格波动的“噪音”,反映了价格的主要趋势方向。 快速移动平均线反映价格的短期趋势,慢速移动平均线反映价格的长期趋势。当快速移动平均线上穿或下穿慢速移动平均线时,意味着短期趋势与长期趋势发生反转,这通常意味着价格反转的信号。
本策略就是利用这一原理,设置两个不同参数的EMA均线,一个短周期的作为快线,一个长周期的作为慢线。策略中分别设置了长度为9和26的EMA均线计算作为转换线和基准线。当短周期EMA上穿长周期EMA时做多,说明短期价格高于长期价格,属于多头信号;当短期EMA下穿长周期EMA时做空,说明短期价格低于长期价格,属于空头信号。
这样,本策略就通过快慢EMA的突破来判断价格可能的反转点,以捕捉价格的短期趋势机会。
- 利用均线理论指标判断价格反转点,相对可靠
- 基于简单指标,容易理解实现
- Parameters可调整灵活,可针对不同品种参数优化
- 可配置只在特定交易时段开仓,避免隔夜风险
- 可寻找比较明确的突破点位入场,增加胜率
-
容易产生多次小额盈亏来回交易的风险
可适当放宽止损幅度,确定明确的反转信号后再入场
-
针对低流通股票,容易出现跳空或差异化价格的问题
可通过参数优化,调整均线周期参数,使用优化后的参数riz进行交易
-
大盘震荡行情中容易出现虚假信号
可结合其他指标进行组合,确定明确信号
-
仅基于简单均线指标,对复杂行情判断能力较弱
可引入其他构造型指标,在关键点进行策略决策
本策略还可从以下几个方向进行进一步优化:
-
增加仓位管理机制,通过加减仓控制单子规模风险
-
增加止损机制,有效控制单笔损失
-
引入交易量,成交量指标进行组合,避免价格上的假突破
-
增加模型预测,利用机器学习等手段预测价格可能的反转概率,提升决策效果
-
利用深度学习等方法模拟专业交易员的决策思路,在反转概率大的点选取交易信号
本策略属于基于均线指标判断的短期反转策略。可定制的参数设置为其提供了良好的灵活性。虽然仅利用简单指标,但通过参数调整可很好适应市场环境。本策略旨在抓取短期价格反转提供的套利机会。通过进一步引入仓位管理、止损机制等手段,可以有效控制风险,提高策略稳定性。同时也可引入更多进阶技术指标和机器学习方法进行优化,探索策略效果提升空间。
||
The strategy is named "Oscillation Breakthrough Strategy Based on Moving Average". It calculates moving average lines of different cycles of prices to determine whether prices break through key moving averages for long and short trading. When the short-term moving average breaks through the long-term moving average, go long. When the short-term moving average falls through the long-term moving average, go short.
The strategy is mainly based on the theory of moving averages. The moving average is a commonly used analytical tool in technical analysis. It smooths price data by filtering out short-term price fluctuations "noise" and reflects the main trend direction of prices. The fast moving average reflects short-term price trends, while the slow moving average reflects long-term price trends. When the fast moving average crosses above or falls below the slow moving average, it means that the short-term trend reverses the long-term trend, which often signals a price reversal.
This strategy utilizes this principle by setting two EMA averages with different parameters, a short-term one as the fast line and a long-term one as the slow line. The strategy sets EMAs with lengths of 9 and 26 to calculate the conversion line and baseline. When the short-term EMA crosses above the long-term EMA, go long, indicating the short-term price is higher than the long-term price, a bullish signal. When the short-term EMA crosses below the long-term EMA, go short, indicating the short-term price is lower than the long-term price, a bearish signal.
Thus, this strategy judges possible reversal points of prices through breakthroughs of fast and slow EMAs in order to capture short-term trend opportunities of prices.
- Use reliable indicators based on moving average theory to determine price reversal points
- Simple to understand and implement based on basic indicators
- Flexible parameters for tuning and optimization for different products
- Option to only open positions during specific trading hours to avoid overnight risks
- Look for clearer breakthrough points to increase win rate
-
Prone to multiple small losses from back and forth trading
Can appropriately loosen stop loss range, wait for clear reversal signal before entering positions -
For low liquidity stocks, price gaps or inconsistent prices can occur Parameters can be optimized, adjust moving average cycle parameters, trade with optimized parameters
-
Easy to get false signals in sideways choppy markets Can combine with other indicators for confirmation before entering positions
-
Limited ability to handle complex market situations with just simple moving average indicators Can introduce other technical indicators for improved decision making at key points
This strategy can also be further optimized in the following aspects:
-
Add position sizing mechanism to control position risk with adding/reducing
-
Add stop loss mechanism to effectively control per trade loss
-
Incorporate trading volume, volume indicators to avoid false price breakouts
-
Add model prediction, use machine learning etc to predict probability of price reversal, improve decisions
-
Utilize deep learning to simulate professional trader decision making logic and select signals at high reversal probability points
This is a short-term mean reversion strategy based on moving average indicators. The customizable parameters provide good flexibility. Although using simple indicators, it can be adapted well to market environments through parameter tuning. The strategy aims to capture arbitrage opportunities from short-term price reversals. By introducing mechanisms like position sizing, stop loss etc, risks can be effectively managed to improve stability. More advanced technical indicators and machine learning methods can also be used to explore performance improvement. [/trans]
Strategy Arguments
| Argument | Default | Description |
|---|---|---|
| v_input_1 | true | Use Trading Session? |
| v_input_2 | 0800-1600 | Trade Session: |
| v_input_3 | 9 | Fast (Conversion) Line |
| v_input_4 | 26 | Slow (Base) Line |
| v_input_5 | 2 | Ema on price frequency |
Source (PineScript)
/*backtest
start: 2023-01-16 00:00:00
end: 2024-01-22 00:00:00
period: 1d
basePeriod: 1h
exchanges: [{"eid":"Futures_Binance","currency":"BTC_USDT"}]
*/

//@version=3
strategy("Juiced Ichimoku Strat", overlay=true)

USE_TRADESESSION = input(title='Use Trading Session?', type=bool, defval=true)
trade_session = input(title='Trade Session:', defval='0800-1600', confirm=false)
istradingsession = not USE_TRADESESSION ? false : not na(time('1', trade_session))
bgcolor(istradingsession?gray:na)

varLo = input(title="Fast (Conversion) Line",  defval=9, minval=1, maxval=99999)
varHi = input(title="Slow (Base) Line",  defval=26, minval=1, maxval=99999)
emafreq = input(title="Ema on price frequency",  defval=2, minval=1, maxval=99999)

a = lowest(varLo)
b = highest(varLo)
c = (a + b ) / 2

d = lowest(varHi)
e = highest(varHi)
f = (d + e) / 2

//g = ((c + f) / 2)[varHi]
//h = ((highest(varHi * 2) + lowest(varHi * 2)) / 2)[varHi]

z = ema(close, emafreq)

bgcolor(z > c and z > f ? green : z < c and z < f ? red : yellow, transp=70)
plot(z, title="ema on Price", color=black)
plot(c, title="Fast (Conversion) Line", color=green)
plot(f, title="Slow (Base) Line", color=red)

long = z > c and z > f and (USE_TRADESESSION ? istradingsession : true)
short = z < c and z < f and (USE_TRADESESSION ? istradingsession : true)
//exit = z < c and z > f or z > c and z < f

closelong = z < c and z > f or z > c and z < f and (USE_TRADESESSION ? istradingsession : true)
if (closelong)
    strategy.close("Long")
closeshort = z < c and z > f or z > c and z < f and (USE_TRADESESSION ? istradingsession : true)
if (closeshort)
    strategy.close("Short")
strategy.entry("long", strategy.long, when=long)
strategy.entry("short", strategy.short, when=short)
Detail
https://www.fmz.com/strategy/439752
Last Modified
2024-01-23 15:13:31
