Name
基于双重反转动量策略Reversal-Momentum-Strategy-with-Double-Confirmation
Author
ChaoZhang
Strategy Description
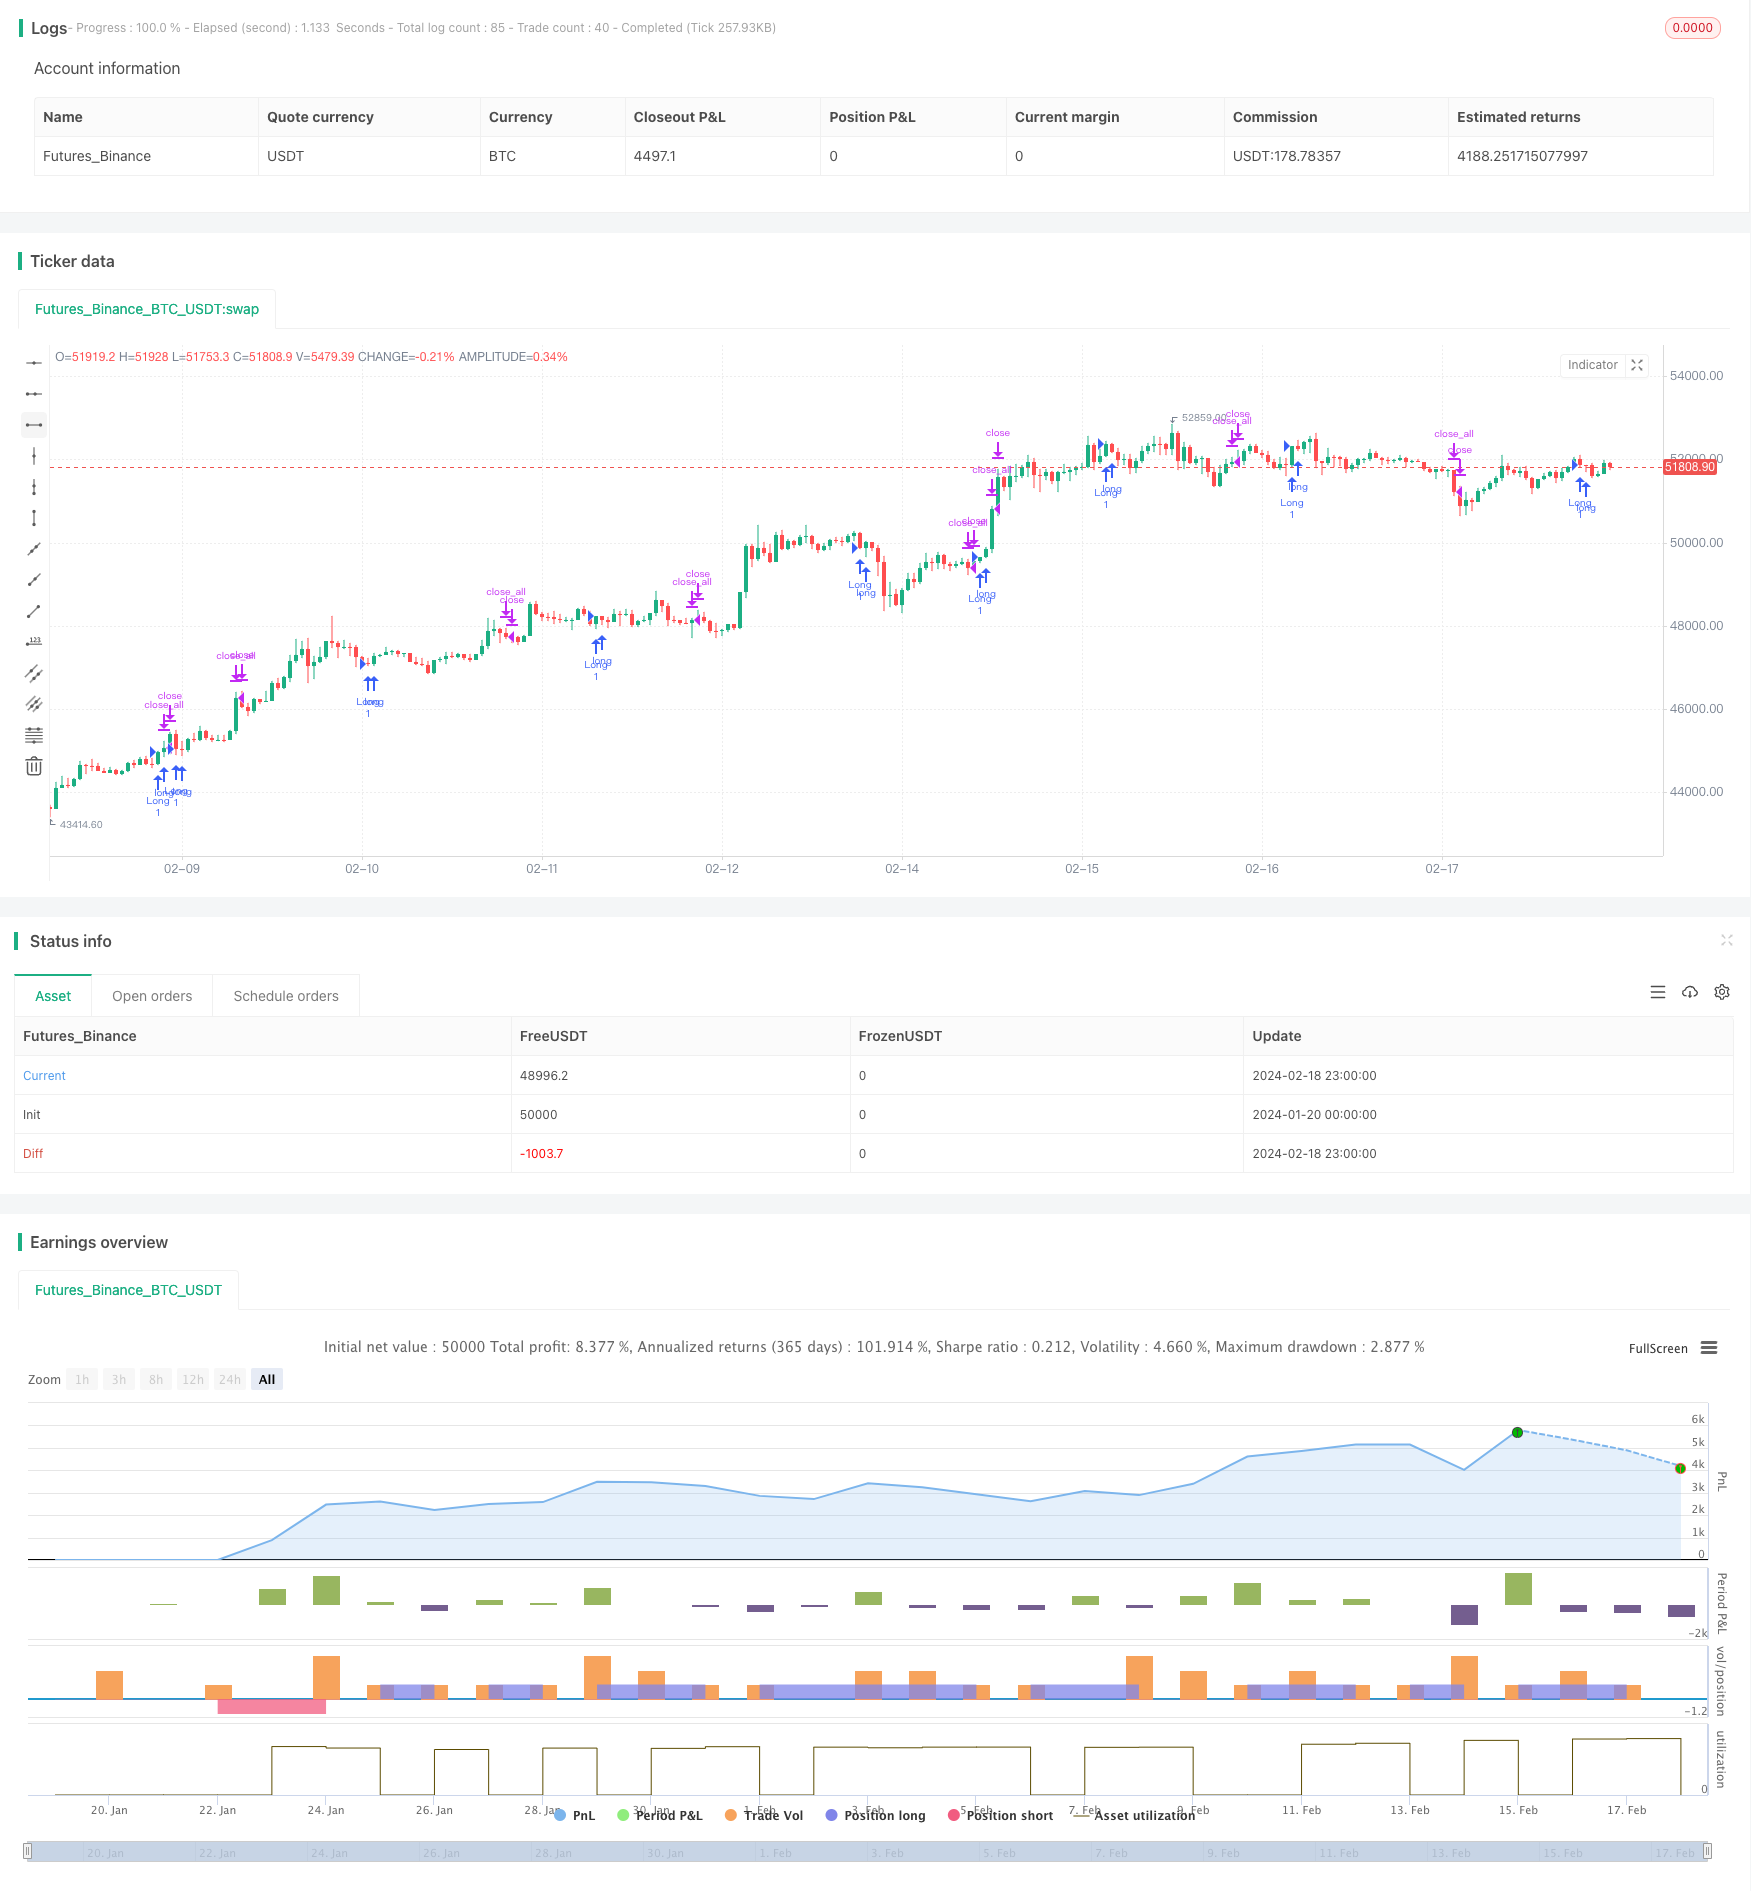
双重反转动量策略通过结合价格反转信号和波动率反转信号,实现趋势交易。它主要基于123形态判断价格反转点,同时辅助采用Donchian通道波动率来过滤虚假信号。该策略适用于中长线持仓,通过双重反转过滤,可以有效抓住市场转折点,实现超额收益。
价格反转部分采用123形态判断。该形态含义是前两根K线价格出现反向(上涨或下跌),第三根K线再次反转(下跌或上涨),因此称为123形态。当价格出现三根K线反转现象时,通常预示着短期趋势即将出现转折。为了进一步验证价格反转的可靠性,该策略还采用了随机指标判断,只有当随机指标也出现反转时(快线回落或快速上升),才会触发交易信号。
波动率反转部分采用Donchian通道波动率。Donchian通道主要反映价格的波动范围。当价格波动加大时,Donchian通道宽度也会扩大;当价格波动减小时,Donchian通道宽度也会收窄。Donchian通道波动率(宽度)可以有效衡量市场的波动程度和风险水平。该策略采用Donchian通道波动率的反转来过滤虚假信号,只有当波动率和价格同时反转时,才会发出交易信号,避免被迂回操作套住。
综上,该策略通过双重反转验证,既确保了交易信号的可靠性,也控制了风险,是一种相对稳健的趋势策略。
- 双重过滤机制,确保交易信号可靠性,避免假断裂
- 控制风险,降低亏损概率
- 适合中长线持仓,避开市场Noise,抓住超额收益
- 参数优化空间大,可调整至最优状态
- 风格独特,与常见技术指标组合使用效果好
- 依赖参数优化,参数不当会影响策略表现
- 止损策略还需进一步提升,最大回撤控制有待改进
- 交易频率可能偏低,无法适应高频算法交易
- 需选择合适品种和时间周期,适用范围有限
- 可采用机器学习等方式寻找最优参数
- 增加自适应止损模块,可以大幅减少最大回撤
- 加入交易量指标,确保在高量突破时入场
- 优化参数以取得最佳稳定性
- 尝试不同品种和时间周期,寻找最佳适配环境
- 尝试与其它指标或策略组合,取得1+1>2的协同效应
双重反转动量策略通过价格反转和波动率反转的双重验证,实现了较好的风险控制。相比单一指标,它过滤了大量噪声,稳定性更优。通过参数优化、止损模块增强、量能引入等手段,该策略可以进一步提升信号质量和收益稳定性。它适合作为股票、数字货币等中长线策略的组成部分,与其他模块合理搭配,可以获得良好超额收益。
||
The Reversal Momentum strategy combines price reversal signals and volatility reversal signals to implement trend trading. It mainly uses the 123 pattern to determine price reversal points, while using the Donchian Channel volatility as a filter for false signals. This strategy is suitable for medium-to-long term holding. By double confirmation of reversals, it can effectively capture market turning points and achieve excess returns.
The price reversal part uses the 123 pattern to judge. This pattern means that the prices of the first two K-lines move in opposite directions (up or down), and the third K-line reverses again (down or up). Therefore, it is called the 123 pattern. When a price appears with three K-lines reversing, it usually signals that a short-term trend is about to turn. To further verify the reliability of price reversals, this strategy also uses a stochastic indicator to trigger trades only when the stochastic indicator also reverses (the fast line falls back or rises rapidly).
The volatility reversal part uses Donchian Channel volatility. The Donchian Channel mainly reflects the price fluctuation range. When price volatility increases, the width of the Donchian Channel also expands; when price volatility decreases, the width of the Donchian Channel also narrows. Donchian Channel volatility (width) can effectively measure the degree of market fluctuation and risk level. This strategy uses the reversal of Donchian Channel volatility to filter out false signals, only issuing trading signals when volatility and prices reverse at the same time, avoiding being caught in callback operations.
In summary, this strategy ensures the reliability of trading signals and controls risks through dual reversal validation, making it a relatively robust trend strategy.
- Dual filtering mechanism ensures reliability of trading signals and avoids false breakouts
- Controls risks and reduces probability of losses
- Suitable for medium-to-long term holding, avoids market noise and captures excess returns
- Large optimization space for parameters that can be adjusted for optimum state
- Unique style works well in combination with common technical indicators
- Relies on parameter optimization, improper parameters affect strategy performance
- Stop loss strategy needs further enhancement, maximum drawdown control needs improving
- Trading frequency may be low, cannot adapt to high frequency algorithmic trading
- Requires selection of suitable products and time frames, limited application scope
- Machine learning can be used to find optimal parameters
- Increase adaptive stop loss module to greatly reduce maximum drawdown
- Introduce trading volume indicator to ensure entering on high volume breakouts
- Optimize parameters for best stability
- Try different products and time frames to find best fit
- Try combining with other indicators or strategies for 1+1>2 synergy
The Reversal Momentum strategy achieves good risk control through dual confirmation of price reversal and volatility reversal. Compared to single indicators, it filters out a lot of noise and has better stability. By enhancing parameters optimization, stop loss modules, introducing volume, etc., this strategy can further improve signal quality and profit stability. It is suitable as a component of medium-to-long term strategies for stocks, cryptocurrencies, etc., and can obtain good excess returns when properly combined with other modules.
[/trans]
Strategy Arguments
| Argument | Default | Description |
|---|---|---|
| v_input_1 | 14 | Length |
| v_input_2 | true | KSmoothing |
| v_input_3 | 3 | DLength |
| v_input_4 | 50 | Level |
| v_input_5 | 20 | LengthDCW |
| v_input_6 | 22 | SmootheSCW |
| v_input_7 | false | Trade reverse |
Source (PineScript)
/*backtest
start: 2024-01-20 00:00:00
end: 2024-02-19 00:00:00
period: 1h
basePeriod: 15m
exchanges: [{"eid":"Futures_Binance","currency":"BTC_USDT"}]
*/

//@version=4
////////////////////////////////////////////////////////////
//  Copyright by HPotter v1.0 06/03/2020
// This is combo strategies for get a cumulative signal.
//
// First strategy
// This System was created from the Book "How I Tripled My Money In The
// Futures Market" by Ulf Jensen, Page 183. This is reverse type of strategies.
// The strategy buys at market, if close price is higher than the previous close
// during 2 days and the meaning of 9-days Stochastic Slow Oscillator is lower than 50.
// The strategy sells at market, if close price is lower than the previous close price
// during 2 days and the meaning of 9-days Stochastic Fast Oscillator is higher than 50.
//
// Second strategy
// The Donchian Channel was developed by Richard Donchian and it could be compared
// to the Bollinger Bands. When it comes to volatility analysis, the Donchian Channel
// Width was created in the same way as the Bollinger Bandwidth technical indicator was.
//
// As was mentioned above the Donchian Channel Width is used in technical analysis to measure
// volatility. Volatility is one of the most important parameters in technical analysis.
// A price trend is not just about a price change. It is also about volume traded during this
// price change and volatility of a this price change. When a technical analyst focuses his/her
// attention solely on price analysis by ignoring volume and volatility, he/she only sees a part
// of a complete picture only. This could lead to a situation when a trader may miss something and
// lose money. Lets take a look at a simple example how volatility may help a trader:
//
//    Most of the price based technical indicators are lagging indicators.
//    When price moves on low volatility, it takes time for a price trend to change its direction and
// it could be ok to have some lag in an indicator.
//    When price moves on high volatility, a price trend changes its direction faster and stronger.
// An indicator's lag acceptable under low volatility could be financially suicidal now - Buy/Sell signals could be generated when it is already too late.
//
// Another use of volatility - very popular one - it is to adapt a stop loss strategy to it:
//    Smaller stop-loss recommended in low volatility periods. If it is not done, a stop-loss could
// be generated when it is too late.
//    Bigger stop-loss recommended in high volatility periods. If it is not done, a stop-loss could
// be triggered too often and you may miss good trades.
//
// WARNING:
// - For purpose educate only
// - This script to change bars colors.
////////////////////////////////////////////////////////////
Reversal123(Length, KSmoothing, DLength, Level) =>
    vFast = sma(stoch(close, high, low, Length), KSmoothing)
    vSlow = sma(vFast, DLength)
    pos = 0.0
    pos := iff(close[2] < close[1] and close > close[1] and vFast < vSlow and vFast > Level, 1,
	         iff(close[2] > close[1] and close < close[1] and vFast > vSlow and vFast < Level, -1, nz(pos[1], 0)))
	pos

DCW(length, smoothe) =>
    pos = 0.0
    xUpper = highest(high, length)
    xLower = lowest(low, length)
    xDonchianWidth = xUpper - xLower
    xSmoothed = sma(xDonchianWidth, smoothe)
    pos := iff(xDonchianWidth > xSmoothed, -1,
              iff(xDonchianWidth < xSmoothed, 1, nz(pos[1], 0)))
    pos

strategy(title="Combo Backtest 123 Reversal & Donchian Channel Width", shorttitle="Combo", overlay = true)
Length = input(14, minval=1)
KSmoothing = input(1, minval=1)
DLength = input(3, minval=1)
Level = input(50, minval=1)
//-------------------------
LengthDCW = input(20, minval=1)
SmootheSCW = input(22, minval=1)
reverse = input(false, title="Trade reverse")
posReversal123 = Reversal123(Length, KSmoothing, DLength, Level)
posDCW = DCW(LengthDCW, SmootheSCW)
pos = iff(posReversal123 == 1 and posDCW == 1 , 1,
	   iff(posReversal123 == -1 and posDCW == -1, -1, 0))
possig = iff(reverse and pos == 1, -1,
          iff(reverse and pos == -1 , 1, pos))
if (possig == 1)
    strategy.entry("Long", strategy.long)
if (possig == -1)
    strategy.entry("Short", strategy.short)
if (possig == 0)
    strategy.close_all()
barcolor(possig == -1 ? #b50404: possig == 1 ? #079605 : #0536b3 )
Detail
https://www.fmz.com/strategy/442250
Last Modified
2024-02-20 15:27:02