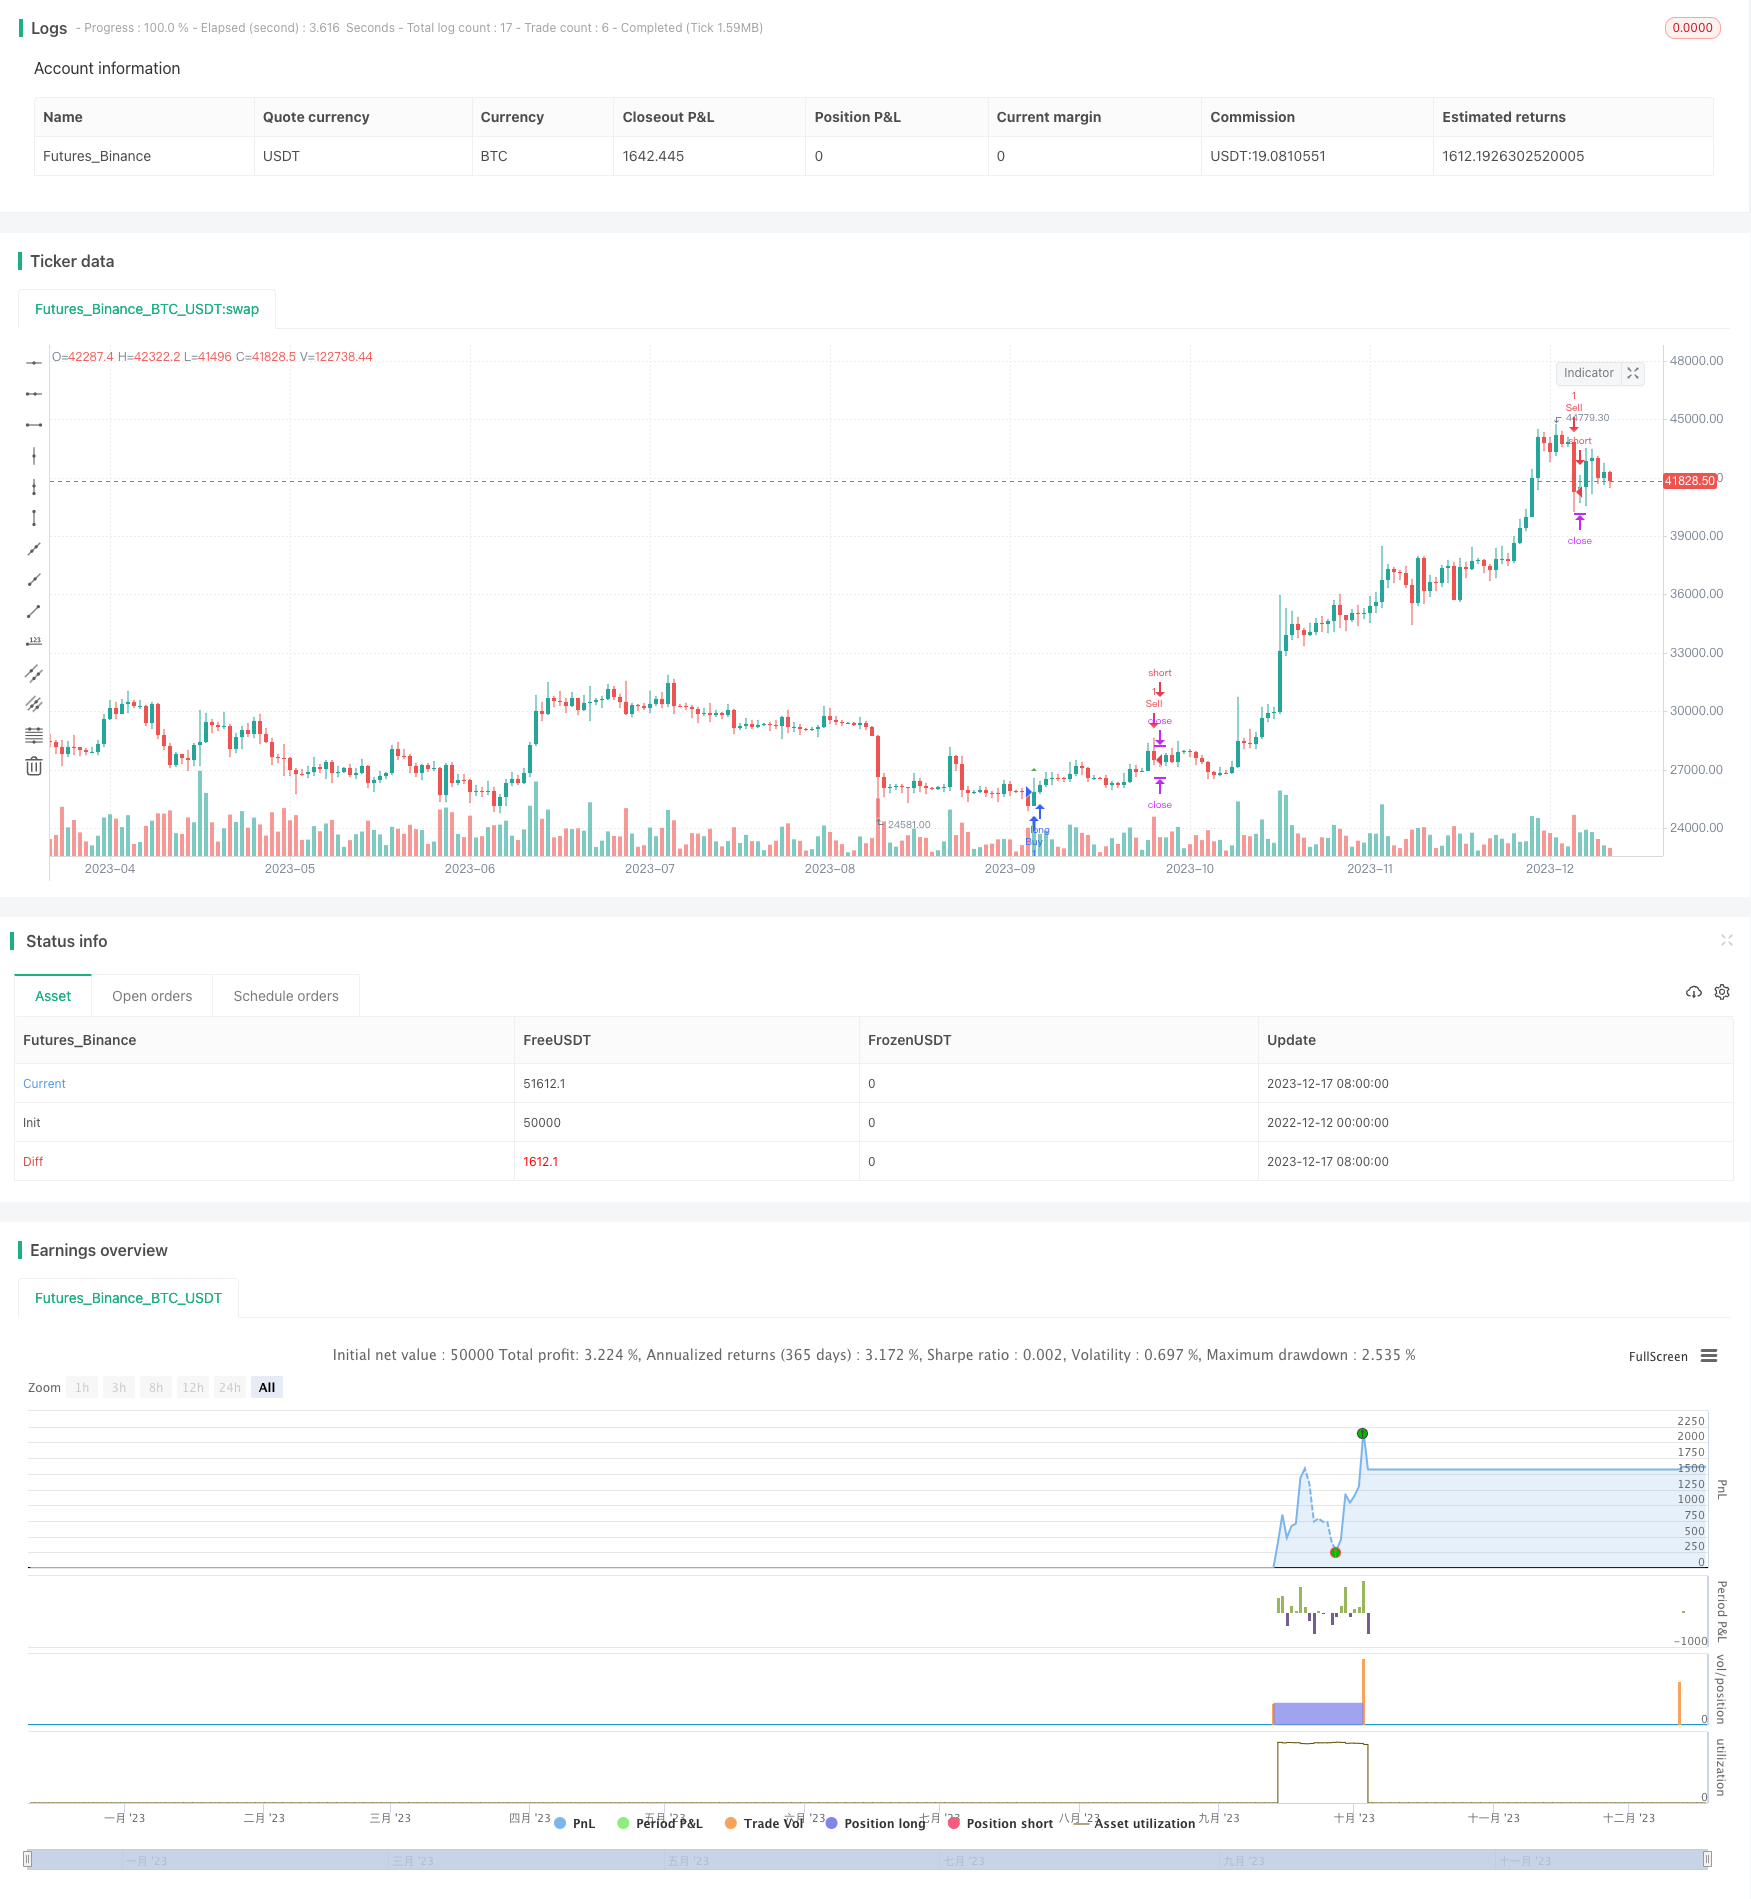
Name
基于动量交易策略Momentum-and-Volume-Trading-Strategy
Author
ChaoZhang
Strategy Description
本策略基于股票的动量指标和交易量指标进行买入和卖出决策。当股票价格上涨动能加速且交易量突增时,进行买入;当股票价格下跌动能加速且交易量突增时,进行卖出。该策略捕捉市场群众性行为带来的短期价格动量。
股票价格变化趋势的强弱和持续时间决定了动量。该策略通过计算股票价格较前一天的变化量来判断价格动量。当价格连续上涨时,动量为正;当价格连续下跌时,动量为负。该策略同时结合交易量指标。只有在交易量明显高于最近 20 天平均水平(超过阈值)时,才会发出买入和卖出信号。
具体来说,买入条件为动量指标上穿 0 且交易量超过 20日平均交易量的2倍;卖出条件为动量指标下穿 0 且交易量超过 20日平均交易量的2倍。买入后设置止盈位为买入价格的0.8倍,止损位为买入价格的0.5倍;卖出后设置的止盈和止损与之相反。
该策略最大的优势是捕捉了市场的短期趋势和群众性行为。当股票价格出现持续上涨或下跌时,大量散户和机构会追随较强的股价动能进行交易。这会形成自我增强的短期价格趋势。该策略正是抓住这一市场心理而产生额外的投资收益。与简单的追踪大盘指数的被动型投资策略相比,该策略的预期超额收益率会更高。
首先,股票价格的短期波动无法完全预测和控制。存在因突发事件导致价格出现剧烈反转的风险,此时止损机制无法完全规避损失。其次,交易量数据的质量参差不齐。部分股票的交易量被人为操纵的可能性无法完全排除,这会导致交易信号被扭曲。再次,仅凭借价格和交易量的简单判断无法精确把控市场的短期趋势。当市场出现较大的结构性转折时,策略的效果会受到影响。
可以考虑结合更多的数据源提高策略效果。比如引入社交媒体等互联网平台中的相关股票讨论量。当一个股票的相关讨论量出现明显增长时,很可能预示着未来股价的变动。这可以作为策略的辅助买入和卖出信号。另外,也可以考虑结合股票的基本面指标,如市盈率、市净率等。这有助于进一步验证价格变动的可持续性,减少错误交易的可能性。
本策略通过捕捉股票价格动量指标和交易量指标的综合变化,实现对市场短期趋势和群众性行为的判断。这种基于大数据和行为金融学原理的量化投资策略,相比传统投资策略而言具有更高的预期收益。但同时也需要充分认识和防范风险,并不断优化策略的输入参数,提升交易效果。
||
This strategy makes buy and sell decisions based on the momentum indicator and trading volume indicator of stocks. It buys when the upward momentum of stock prices accelerates and trading volume surges, and sells when the downward momentum accelerates and trading volume surges. The strategy captures short-term price momentum brought by market herd behavior.
The strength and duration of stock price change trends determine momentum. This strategy calculates the change from the previous day's close to judge price momentum. Momentum is positive when prices rise consecutively and negative when prices fall consecutively. The strategy also combines the trading volume indicator. Buy and sell signals are only triggered when trading volume is significantly higher than the 20-day moving average (above threshold).
Specifically, the buy condition is a crossover of the momentum indicator above 0 with trading volume more than 2 times the 20-day average. The sell condition is the opposite. After buying, the profit target is set at 0.8 times the entry price, and the stop loss is 0.5 times. The profit target and stop loss after selling are reversed accordingly.
The biggest advantage is capturing short-term market trends and herd behavior. When stock prices show sustained rises or falls, lots of retail and institutional investors will follow the stronger price momentum to trade. This creates a self-reinforcing short-term price trend. The strategy generates excess returns by leveraging such market psychology. Compared with passive index tracking strategies, the expected excess return of this strategy is higher.
Firstly, short-term price fluctuations are unpredictable. There are risks of sharp reversals due to sudden events, which cannot be fully avoided despite stop losses. Secondly, the data quality of trading volumes varies. The possibility of manipulation cannot be fully ruled out, which distorts trade signals. Thirdly, simple price and volume analysis cannot precisely control short-term trends. Major structural market shifts can affect strategy performance.
More data sources could be incorporated to improve strategy efficacy. For example, the volume of related stock discussions on social media platforms can indicate future price movements. This data could provide supplementary entry and exit signals. Fundamental indicators like P/E ratio and P/B ratio could also help verify price change sustainability and reduce erroneous trades.
By capturing integrated changes in price momentum and trading volume, this strategy judges short-term trends and herd behavior. Such big data and behavioral finance-based quantitative strategies can yield higher expected returns than traditional strategies. But risks need acknowledgment and prevention. Input parameters require constant optimization to keep improving trading outcomes.
[/trans]
Strategy Arguments
| Argument | Default | Description |
|---|---|---|
| v_input_1 | 0.8 | Profit Target (%) |
| v_input_2 | 0.5 | Stop Loss (%) |
| v_input_3 | 2 | Volume Threshold |
Source (PineScript)
/*backtest
start: 2022-12-12 00:00:00
end: 2023-12-18 00:00:00
period: 1d
basePeriod: 1h
exchanges: [{"eid":"Futures_Binance","currency":"BTC_USDT"}]
*/

//@version=5
strategy('Momentum and Volume Bot', overlay=true)

// Define strategy parameters
profit_target_percent = input(0.8, title='Profit Target (%)')
stop_loss_percent = input(0.5, title='Stop Loss (%)')
volume_threshold = input(2, title='Volume Threshold')

// Calculate momentum
momentum = close - close[1]

// Calculate average volume
avg_volume = ta.sma(volume, 20)

// Buy condition
buy_condition = ta.crossover(momentum, 0) and volume > avg_volume * volume_threshold

// Sell condition
sell_condition = ta.crossunder(momentum, 0) and volume > avg_volume * volume_threshold

// Strategy logic
strategy.entry('Buy', strategy.long, when=buy_condition)
strategy.entry('Sell', strategy.short, when=sell_condition)

// Set profit target and stop loss
strategy.exit('Take Profit/Stop Loss', from_entry='Buy', profit=close * profit_target_percent / 100, loss=close * stop_loss_percent / 100)
strategy.exit('Take Profit/Stop Loss', from_entry='Sell', profit=close * profit_target_percent / 100, loss=close * stop_loss_percent / 100)

// Plotting
plotshape(series=buy_condition, title='Buy Signal', color=color.new(color.green, 0), style=shape.triangleup, size=size.small)
plotshape(series=sell_condition, title='Sell Signal', color=color.new(color.red, 0), style=shape.triangledown, size=size.small)
Detail
https://www.fmz.com/strategy/435894
Last Modified
2023-12-19 15:37:16
