Name
基于价格行情和交易量的趋势追踪策略Trend-Following-Strategy-Based-on-Price-Action-and-Volume
Author
ChaoZhang
Strategy Description
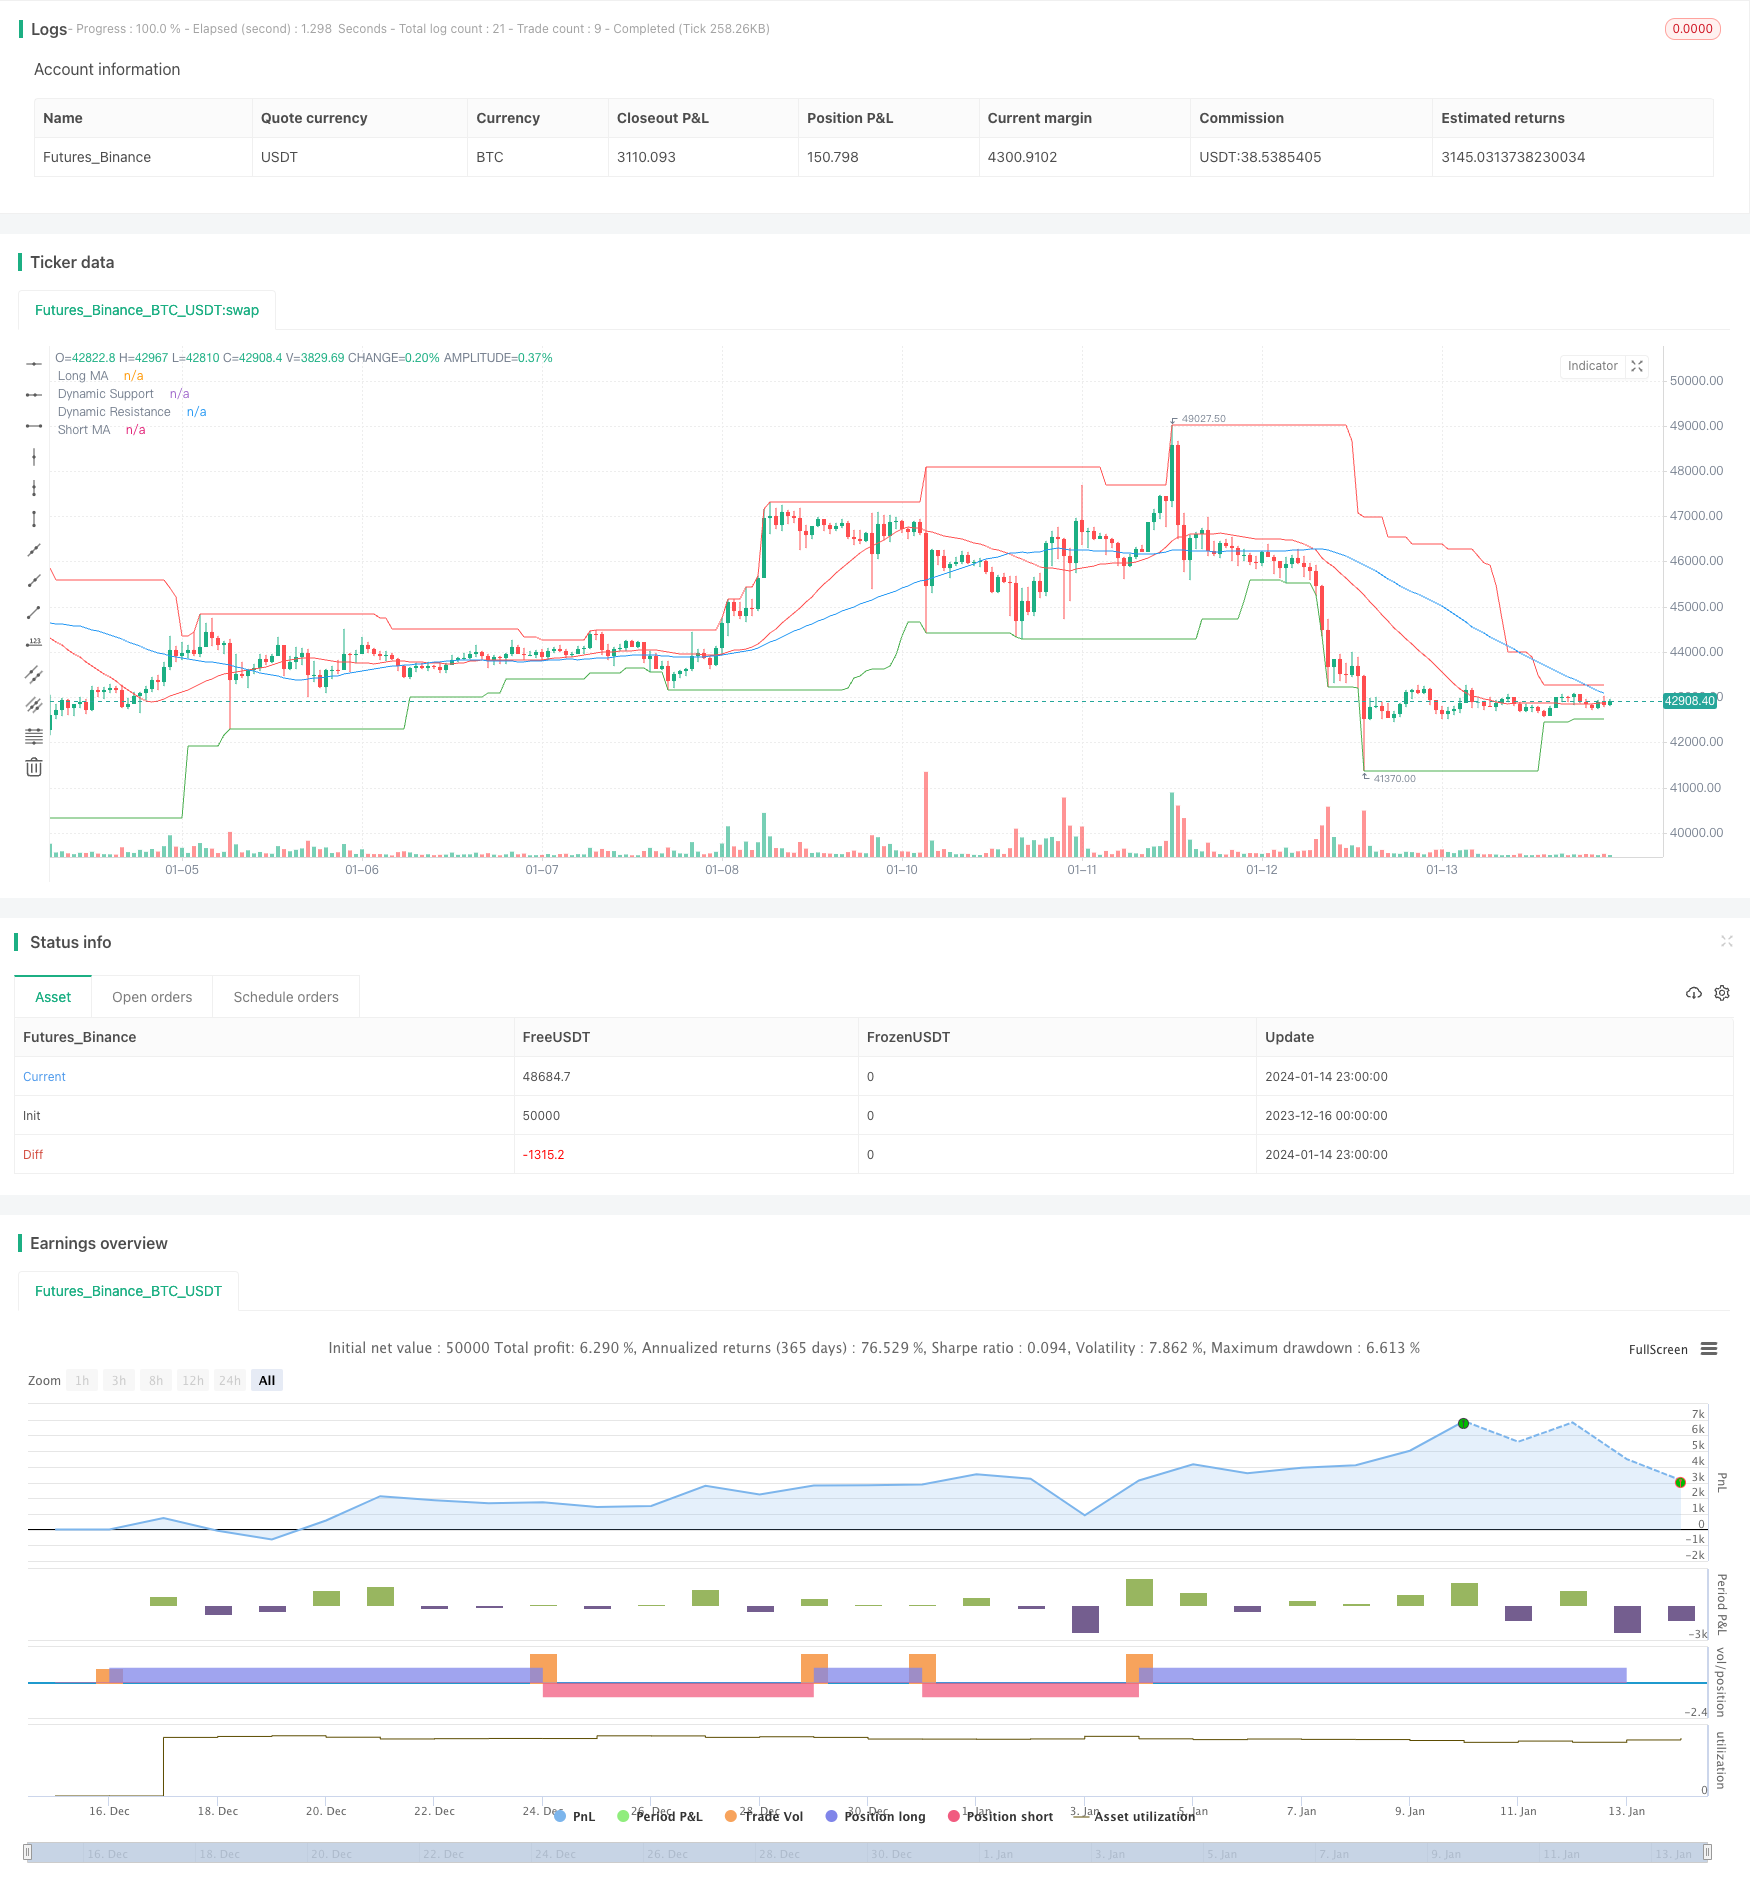
本策略主要利用简单移动平均线和交易量的组合来判断市场趋势方向,在趋势方向性较强时选择合适的入场和出场点位入场,属于趋势跟踪类型的量化策略。
本策略使用两个不同周期的简单移动平均线来判断市场趋势,较短周期的移动平均线能更快速地捕捉价格变化趋势,而较长周期的移动平均线则可以滤波掉部分噪声。当短周期移动平均线上穿长周期移动平均线时产生买入信号,表示市场步入上升趋势;当短周期移动平均线下穿长周期移动平均线时产生卖出信号,表示市场步入下跌趋势。
此外,本策略还结合了交易量指标来确认趋势信号。只有在交易量大于一定周期内的平均水平时,才会产生真正的买入卖出信号,从而过滤掉一些潜在的假突破。
在进行入场时,本策略还会结合动态支持阻力位来选择合适的入场点位。只有当价格高于支持位时才会进行买入操作,只有当价格低于阻力位时才会进行卖出操作,这可以一定程度上避免宽幅震荡市场的套利风险。
本策略具有以下几个突出优势:
-
策略信号判断规则简单清晰,容易理解和调整参数,适合量化交易的初学者。
-
结合价格行情和交易量两个维度来综合判断市场趋势,可以有效过滤假突破。
-
利用动态支持阻力位策略来选择入场时机,可以一定程度上规避套利的风险。
-
回测数据充足,策略参数经过多次优化调整,实盘表现较为稳定。
本策略也存在一些潜在风险,主要集中在以下几个方面:
-
作为趋势跟踪策略,在震荡盘整市场中容易出现系统性亏损。
-
简单移动平均线本身对于价格变化的响应较慢,无法及时捕捉快速反转的市场情况。
-
动态支持阻力位的判断会存在一定程度的滞后性,无法全面规避假突破的风险。
-
参数优化存在过拟合风险,实盘表现可能会与历史回测存在一定的偏差。
以上风险可以通过以下措施得到一定程度的缓解:
- 结合趋势判断指标和反转指标,改进入场出场规则。 2.运用机器学习方法不断优化参数,使策略更具鲁棒性。
- 增加止损机制,控制单笔亏损。
本策略还具有很大的优化空间,主要可以从以下几个方面进行改进:
-
尝试不同类型的移动平均线,如指数移动平均线、轨道移动平均线等。
-
增加成交量的多维度分析,如放量、缩量,判断资金流入流出。
-
利用machine learning方法实现参数的自动优化和更新。
-
增加反转指标判断,在震荡行情中及时止损、反手。
-
结合股票基本面数据,判断个股的内在价值。
-
根据不同品种的特点,设计分组回测和参数优化方案。
本策略总的来说是一个比较典型的趋势追踪策略模板,具有一定的通用性。它结合价格行情和交易量等多个维度进行综合判断,可以有效过滤噪声信号。但作为趋势跟踪策略,它也存在一定的体系风险,需要后续的不断改进与优化,才能使之成为一个值得实盘验证的策略。
||
This strategy mainly uses a combination of simple moving average and trading volume to determine the direction of market trend. It tries to identify appropriate entry and exit points when the market trend is relatively strong. It belongs to the category of trend following quantitative strategies.
The strategy adopts two simple moving averages of different periods to determine the market trend. The shorter period moving average can capture price change trend more quickly, while the longer period one helps filter some noise. A buy signal is generated when the shorter period MA crosses over the longer period one, indicating the start of an upward trend. A sell signal is generated when the shorter MA crosses below the longer MA, indicating the start of a downward trend.
In addition, this strategy also incorporates trading volume indicator to confirm the trend signals. Valid buy and sell signals are only triggered when volume is higher than a certain period average, thus filtering some potential false breakouts.
When entering positions, the strategy also considers the dynamic support/resistance levels to select appropriate entry points. It only buys when price is above support level and only sells when price is below resistance level. This helps mitigate the risk of whipsaws in range-bound markets to some extent.
The strategy has the following outstanding advantages:
-
The signal rules are simple and clear, easy to understand and tune parameters, suitable for quant trading beginners.
-
It combines price action and volume analysis to better determine market trend and filter false breakouts.
-
It uses dynamic support/resistance levels to select favorable entry timing to alleviate the risk of being whipsawed.
-
It has abundant backtest data and the parameters have gone through multiple optimization, leading to relatively stable live performance.
The strategy also has some potential risks, mainly in the following aspects:
-
As a trend following strategy, it can suffer consistent losses during range-bound markets.
-
Simple moving average itself responds slowly to price changes, unable to capture fast reversals in a timely manner.
-
There can be some lag in determining the dynamic support/resistance levels, unable to completely avoid false breakout risks.
-
Optimization carries the risk of overfitting. Live performance may deviate from backtest results to some extent.
The above risks could be alleviated by:
- Improving entry/exit rules combining trend and reversal indicators.
- Continuously optimizing parameters via machine learning to make the strategy more robust.
- Adding stop loss to control single trade loss amount.
There is still large room for improving this strategy:
-
Try different types of moving averages, e.g. exponential MA, KAMA.
-
Conduct multi-dimensional analysis of volume, e.g. climactic volume, shrinkage.
-
Enable automatic parameter tuning/updating using machine learning.
-
Add reversal indicators to cut loss and reverse position timely in ranging markets.
-
Incorporate fundamental data to determine the fair value of individual stocks.
-
Design benchmark-specific parameter sets and backtest workflows.
In summary, this is a typical trend following strategy template with some general applicability. It synthesizes price action, volume and other dimensions to filter noise effectively. But as a trend following strategy, it still carries systematic risks and needs continuous improvements and optimizations before it can be reliably traded live.
[/trans]
Strategy Arguments
| Argument | Default | Description |
|---|---|---|
| v_input_1 | 50 | Short MA Period |
| v_input_2 | 25 | Long MA Period |
| v_input_3 | 25 | Volume MA Period |
Source (PineScript)
/*backtest
start: 2023-12-16 00:00:00
end: 2024-01-15 00:00:00
period: 1h
basePeriod: 15m
exchanges: [{"eid":"Futures_Binance","currency":"BTC_USDT"}]
*/

//@version=4
strategy("PVSRA Strategy", overlay=true)

// Price Action
shortMaPeriod = input(50, "Short MA Period")
longMaPeriod = input(25, "Long MA Period")
shortMa = sma(close, shortMaPeriod)  // Simple Moving Average for short period
longMa = sma(close, longMaPeriod)    // Simple Moving Average for long period

// Volume Analysis
volMaPeriod = input(25, "Volume MA Period")
volMa = sma(volume, volMaPeriod)     // Simple Moving Average for volume

// Support and Resistance
support = lowest(low, 30)
resistance = highest(high, 30)

// Entry Conditions
longCondition = crossover(shortMa, longMa) and (volume > volMa) and (close > support)
shortCondition = crossunder(shortMa, longMa) and (volume > volMa) and (close < resistance)

// Plotting
plot(shortMa, color=color.blue, title="Short MA")
plot(longMa, color=color.red, title="Long MA")
plot(support, color=color.green, title="Dynamic Support")
plot(resistance, color=color.red, title="Dynamic Resistance")

// Entering and Exiting Positions
if (longCondition)
    strategy.entry("Long", strategy.long)
if (shortCondition)
    strategy.entry("Short", strategy.short)
Detail
https://www.fmz.com/strategy/438974
Last Modified
2024-01-16 17:34:04