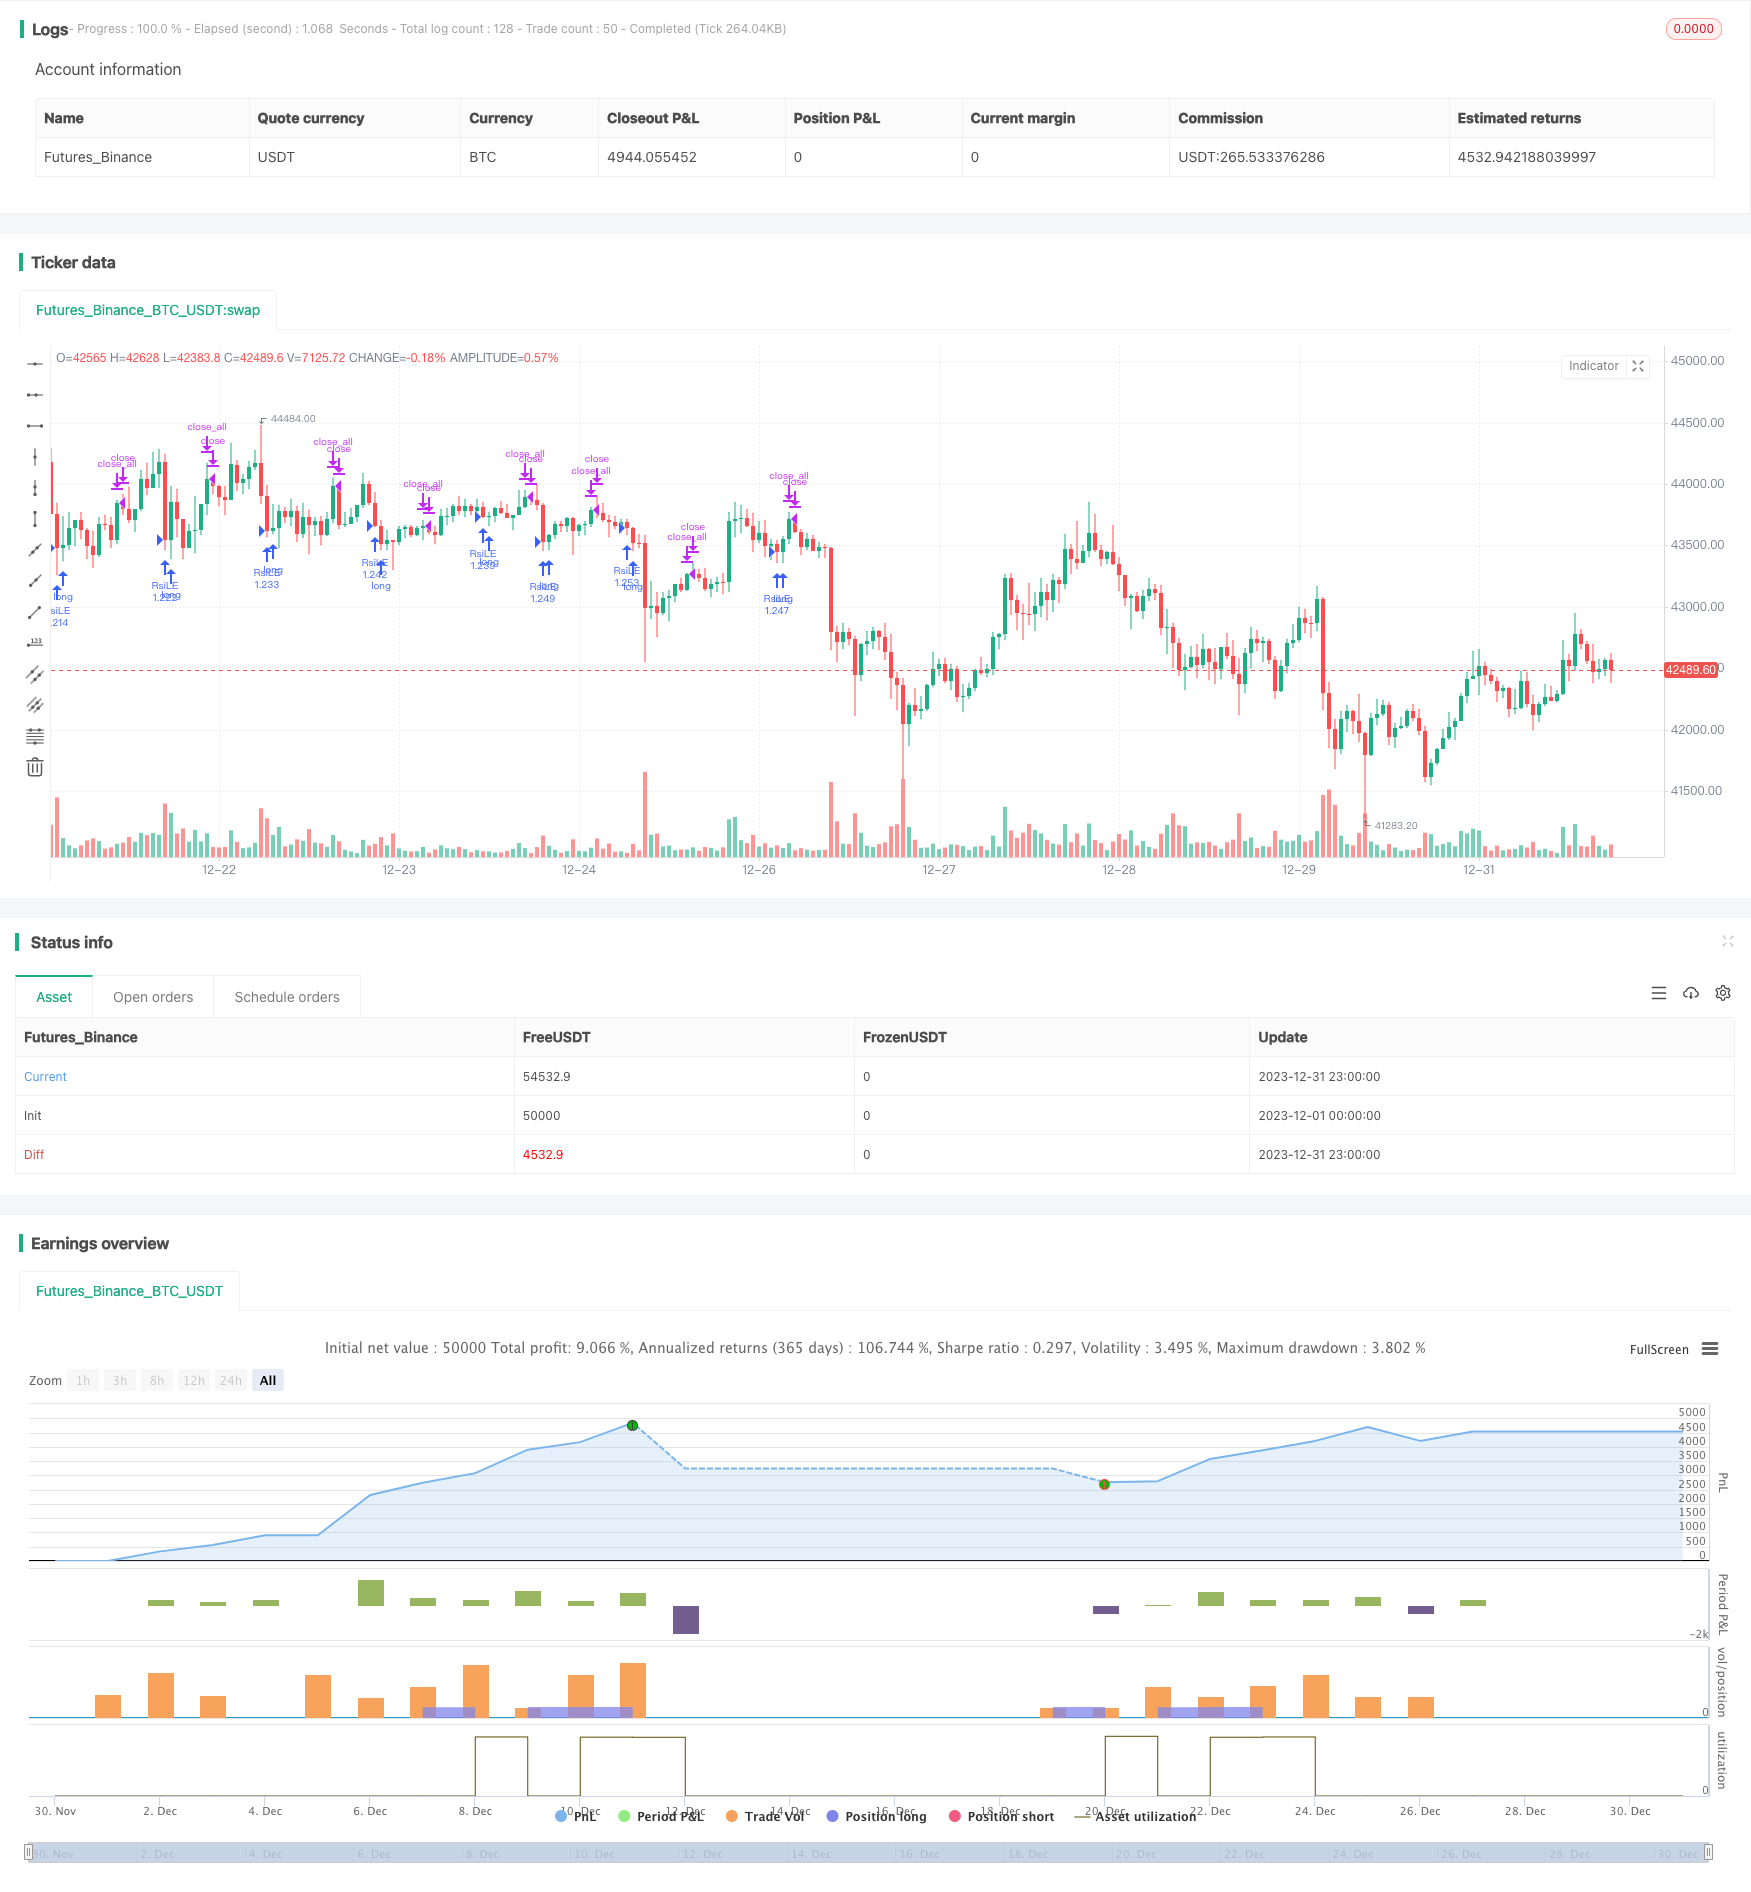
Name
双7日突破策略Double-7-Days-Breakout-Strategy
Author
ChaoZhang
Strategy Description
双7日突破策略是一个非常简单的短线交易策略。它只有3个交易规则:
- 价格必须高于200日简单移动均线
- 当价格收盘低于过去7天的最低价时做多
- 当价格收盘高于过去7天的最高价时平仓
虽然规则非常简单,但该策略在一些股票和时间段中表现非常出色,甚至超过许多RSI策略。
双7日突破策略利用价格的支撑和阻力进行交易。当价格跌破过去7天的最低价时,说明价格可能进入调整期,这时做多;当价格涨破过去7天的最高价时,说明行情可能转强,应平仓了结利润。
该策略是典型的短线交易策略。它通过7天时间窗口判断最近几天价格行情,利用超短线的突破信号进行入场。同时,它要求价格高于200日均线,避免在长期下跌行情中交易。
双7日突破策略最大的优势就是简单易行。它只有3条规则,非常容易实施。且由于信号判断时间窗口很短,交易频率较高,适合短线操作。
另外,该策略充分利用了价格的支撑和阻力进行交易。这类突破信号往往比较可靠,胜率较高。这也是该策略表现出色的原因。
双7日突破策略作为一个短线策略,其交易风险主要来自两方面:
- 错误信号风险。当价格出现错误突破时,该策略会产生损失。
- 大盘系统性风险。当大盘出现剧烈调整时,个股之间相关性增大,该策略可能同时持有多个股票仓位,面临较大的市场风险。
为降低这些风险,可以适当调整参数,缩短持仓时间,或结合其他指标进行过滤。当大盘波动剧烈时,应减少仓位规模。
双7日突破策略还有进一步优化的空间:
- 可以测试不同的均线参数,寻找更合适的长期指标。
- 可以测试不同的突破周期参数,优化短期指标。
- 可以加入止损机制,进一步控制单笔损失。
- 可以结合其他指标进行过滤,提高信号准确率。
通过参数和策略结构的优化,有望进一步提升策略的稳定性和效率。
双7日突破策略是一个简单高效的短线交易策略。它利用支撑阻力进行突破交易,信号生成频率高,适合短线操作。同时它要求价格高于长期均线,能有效规避长期调整的系统性风险。通过参数和模块的优化,该策略有望获取更出色的表现。
||
The Double 7 Days Breakout Strategy is a very simple short-term trading strategy. It has only 3 trading rules:
- Price must be above the 200-day Simple Moving Average
- Go long when price closes below the lowest price of the past 7 days
- Close position when price closes above the highest price of the past 7 days
Although the rules are very simple, this strategy performs very well in some stocks and time periods, even outperforming many RSI strategies.
The Double 7 Days Breakout Strategy trades based on price supports and resistances. When price breaks below the lowest price of the past 7 days, it indicates the price may enter an adjustment period and it is time to go long. When price breaks above the highest price of the past 7 days, it indicates the momentum may strengthen and it is time to close position and take profit.
This is a typical short-term trading strategy. It judges the price action over the past 7 days and utilizes ultra short-term breakout signals to enter positions. Meanwhile, it also requires the price to be above the 200-day Moving Average to avoid trading in long-term downtrends.
The biggest advantage of the Double 7 Days Breakout Strategy is that it is simple and easy to implement. There are only 3 trading rules which makes it very straightforward to follow. Also due to the very short lookback period, trading frequency is high making it suitable for short-term trading.
In addition, the strategy effectively utilizes price supports and resistances to trade. Such breakout signals tend to be more reliable with higher winning rates. This is also why this strategy has good performance.
As a short-term trading strategy, the main risks come from two aspects:
-
Wrong signal risk. Wrong breakouts will produce losses.
-
Systemic market risk. When market has sharp corrections, correlations between stocks increase. Since this strategy may hold positions in multiple stocks, it faces larger market risk.
To mitigate these risks, parameters can be adjusted to shorten holding period or add filters with other indicators. Also reduce position sizes when market fluctuation increases.
There is room for further optimization of the Double 7 Days Breakout Strategy:
-
Test different parameters for long-term moving average to find more suitable ones.
-
Test different periods for the breakout to optimize the short-term indicator.
-
Add stop loss mechanism to further control single trade loss.
-
Combine with other indicators to filter signals and improve accuracy.
Through optimizing parameters and strategy structure, there is potential to further improve stability and efficiency of the strategy.
The Double 7 Days Breakout Strategy is a simple yet efficient short-term trading strategy. It trades based on support/resistance breakouts generating high frequency signals suitable for short-term trading. Also by requiring price to be above long-term moving average, it effectively avoids systemic risks in long-term corrections. With further optimization on parameters and modules, there is potential for even better performance.
[/trans]
Strategy Arguments
| Argument | Default | Description |
|---|---|---|
| v_input_1 | 7 | Quantity of day low |
| v_input_2 | 7 | Quantity of day high |
| v_input_3 | 2009 | Backtest Start Year |
| v_input_4 | true | Backtest Start Month |
| v_input_5 | 2 | Backtest Start Day |
| v_input_6 | 2020 | Backtest Stop Year |
| v_input_7 | 12 | Backtest Stop Month |
| v_input_8 | 30 | Backtest Stop Day |
Source (PineScript)
/*backtest
start: 2023-12-01 00:00:00
end: 2023-12-31 23:59:59
period: 1h
basePeriod: 15m
exchanges: [{"eid":"Futures_Binance","currency":"BTC_USDT"}]
*/

//@version=4
strategy("Double 7's Strategy", overlay=true, default_qty_type = strategy.percent_of_equity, default_qty_value = 100)

value1=input(7, title="Quantity of day low")
value2=input(7, title="Quantity of day high")
entry=lowest(close[1],value1)
exit=highest(close[1],value2)


mma200=sma(close,200)

// Test Period
testStartYear = input(2009, "Backtest Start Year")
testStartMonth = input(1, "Backtest Start Month")
testStartDay = input(2, "Backtest Start Day")
testPeriodStart = timestamp(testStartYear,testStartMonth,testStartDay,0,0)

testStopYear = input(2020, "Backtest Stop Year")
testStopMonth = input(12, "Backtest Stop Month")
testStopDay = input(30, "Backtest Stop Day")
testPeriodStop = timestamp(testStopYear,testStopMonth,testStopDay,0,0)

testPeriod() => true

if testPeriod()
    if (close>mma200) and (close<entry)
        strategy.entry("RsiLE", strategy.long , comment="Open")

    if (close>exit)
        strategy.close_all()
Detail
https://www.fmz.com/strategy/440451
Last Modified
2024-01-30 16:49:01
