Name
双轨斜率追踪波动带策略Dual-Rail-Parabolic-SAR-Bollinger-Bands-Strategy
Author
ChaoZhang
Strategy Description
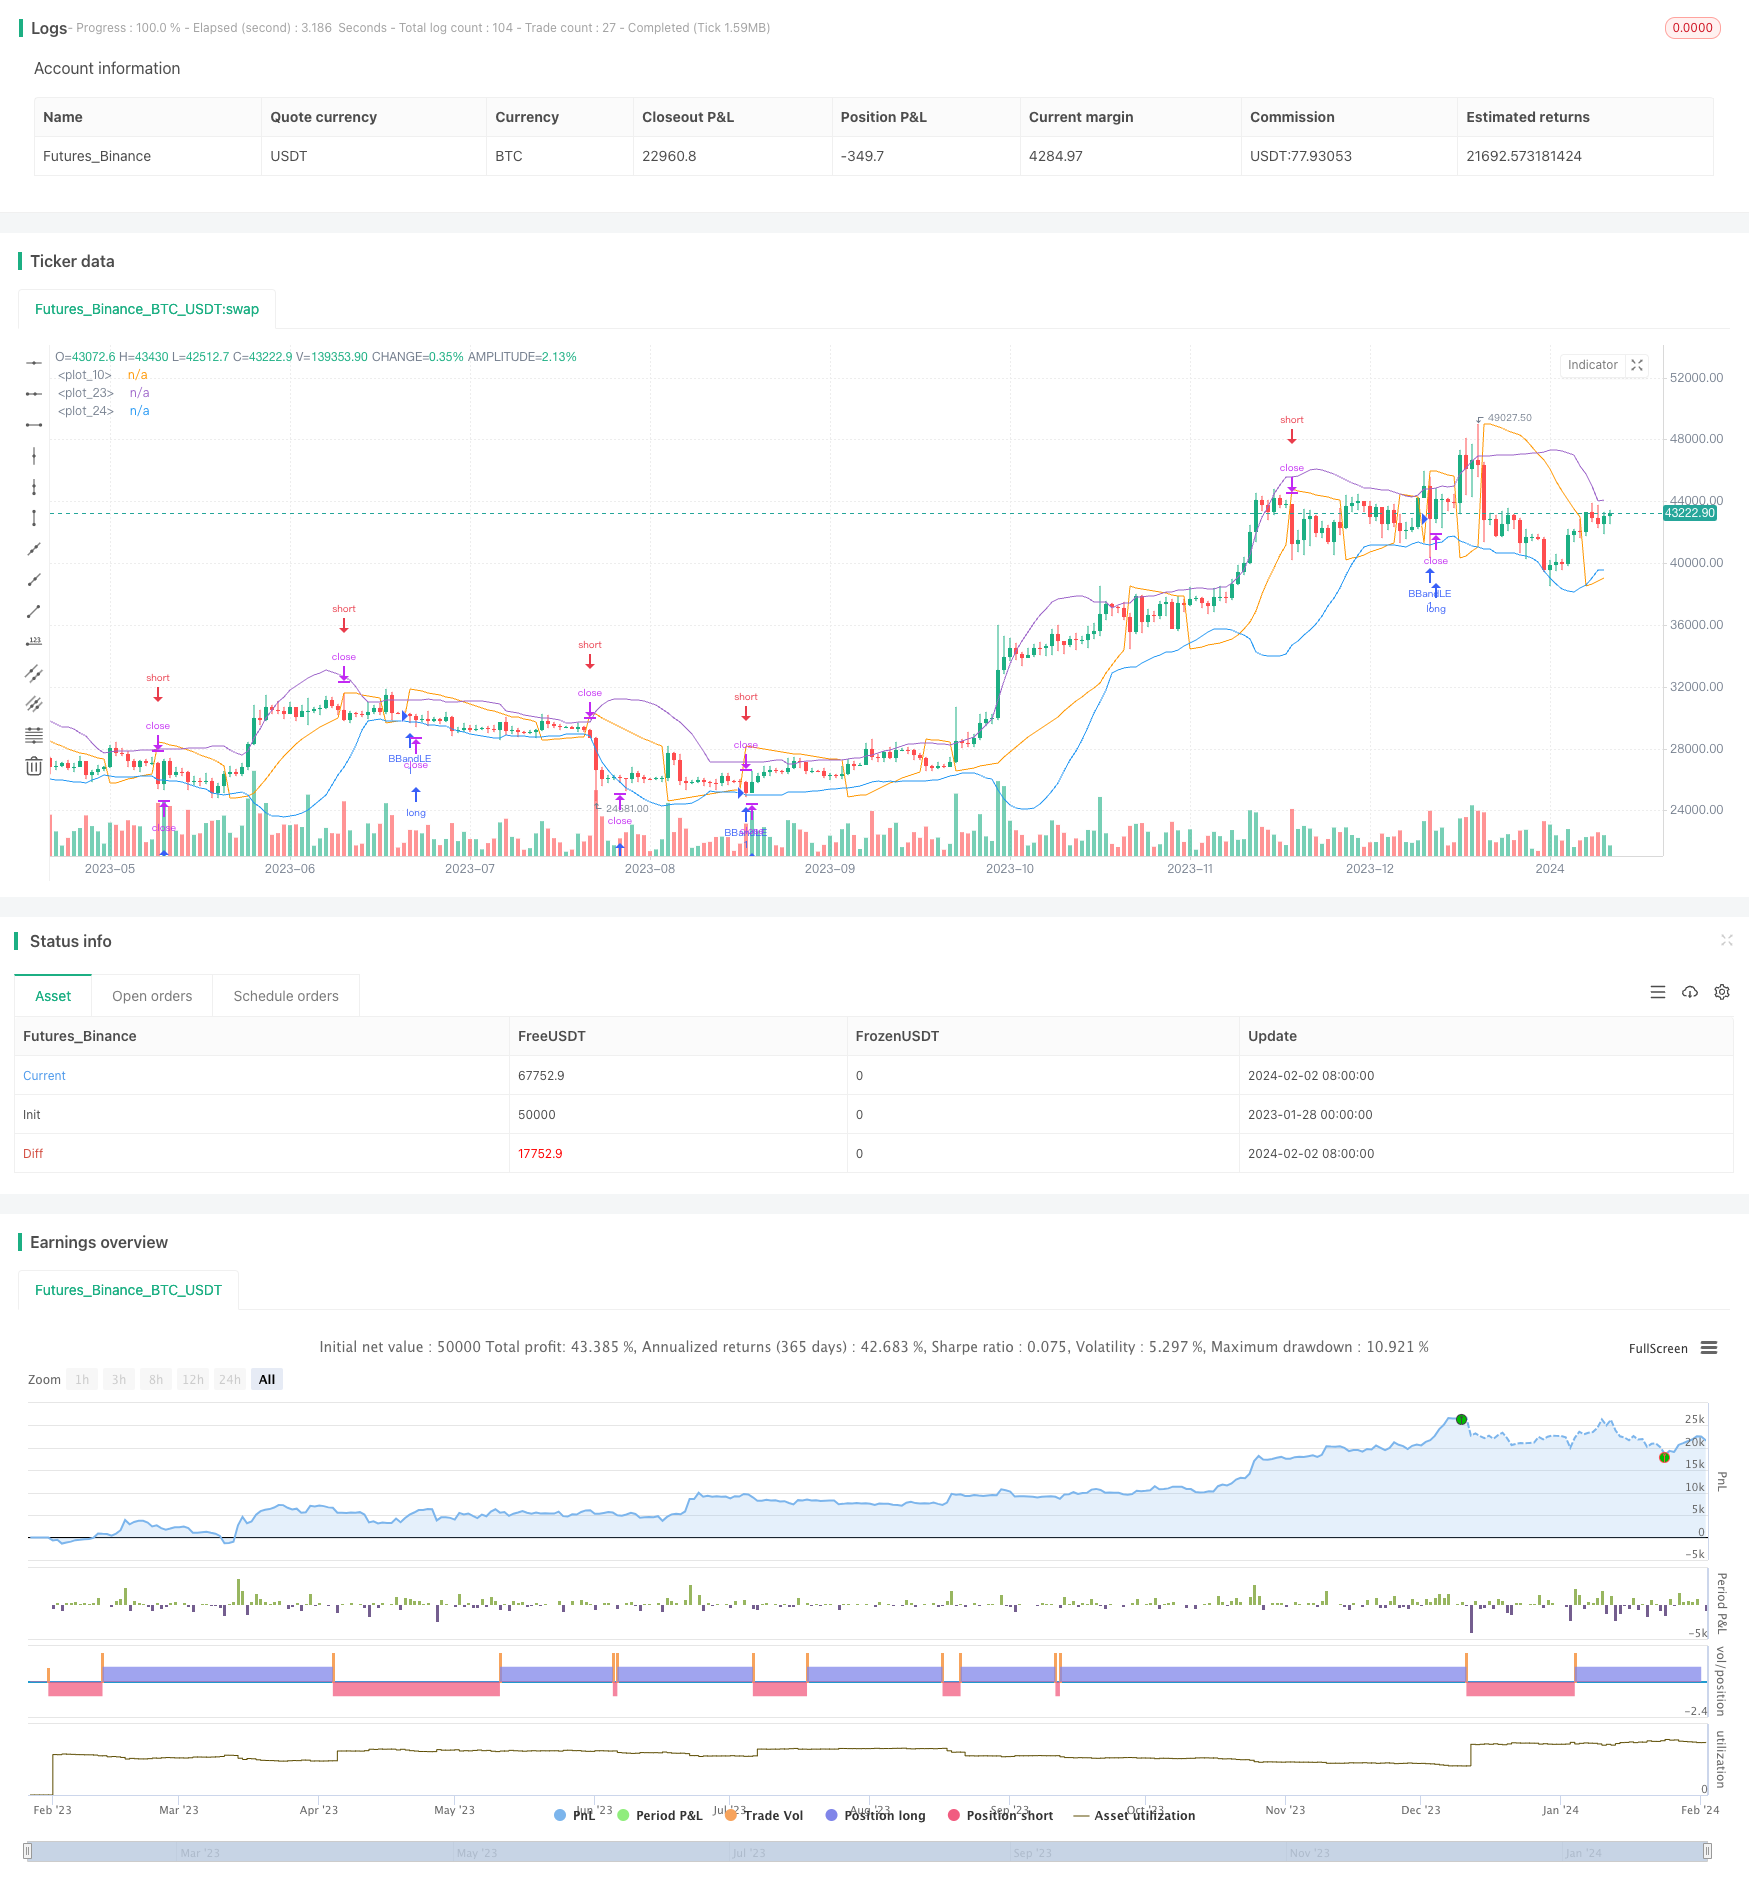
双轨斜率追踪波动带策略将布林带指标和PSAR指标结合使用,在突破布林带下轨做多的同时,当PSAR指标转头向下时做空,实现更准确地捕捉趋势的转折点。该策略旨在在股价处于上升通道时捕捉多头机会,同时在股价开始下跌时及时切换做空,以实现双向交易。
该策略首先计算布林带的上轨、中轨和下轨。中轨线为N天收盘价的简单移动平均线,上轨线和下轨线分别为中轨线正负k倍标准差。然后计算抛物转向指标PSAR,当其由上向下穿过最低价时,视为卖信号。
在进入多头方向时,如果收盘价低于布林带下轨则做多,同时设置止损于下轨。当PSAR转向下降并低于最低价时,做空头仓位,即信号发生反转的时刻。
该策略综合了布林带的趋势跟踪性和PSAR的趋势反转特征,既可以跟踪趋势又可以及时捕捉反转机会,做到双轨操作。
-
综合多个指标,提高决策的准确性。布林带判断大趋势,PSAR判断局部调整,两者互补。
-
顺势而为,逆势而动,捕捉反转。布林带捕捉大趋势,PSAR提示反转机会,实现顺势做多逆势做空。
-
双向交易机会更多。无论行情上涨还是下跌,该策略都可以获利。
-
自动止损,严格控制风险。布林带下轨和PSAR作为自适应的止损位,可以减少大额亏损的概率。
-
布林带扩张可能增加亏损。当市场波动加大时,布林带上下轨间距离会放大,造成止损点过远,从而增加亏损风险。
-
PSAR参数设置不当可能错过反转。PSAR的看涨看跌参数需要谨慎设置,否则可能漏掉价格反转时机。
-
交易次数可能过于频繁。PSAR对小范围波动过于敏感,可能造成增加不必要的交易,增大交易成本。
-
优化布林带参数,适应市场变化。可以通过测试不同的布林带参数组合,选择最优参数,使布林带更符合不同市场环境。
-
结合其他指标滤波假信号。可以增加类似KDJ等指标判断多空,避免因PSAR参数不当造成的错误信号。
-
优化交易策略,减少不必要交易。可以通过设置最小止盈止损幅度,避免小幅震荡引发反复小额交易。
双轨斜率追踪波动带策略充分结合布林带的趋势跟踪特征和PSAR的反转识别能力,实现了多空双向交易,顺势而为,逆势而动。相比单一使用某个指标,该策略可以大幅提高决策的准确性,在降低错误信号的基础上,增加正确的交易机会。通过参数优化和组合其他指标,可以进一步增强策略的稳定性和profit因子。
||
The Dual-Rail Parabolic SAR Bollinger Bands strategy combines the Bollinger Bands indicator and the PSAR indicator, going long when the Bollinger Lower Band is broken while going short when the PSAR indicator turns down, to more accurately capture trend reversal points. The strategy aims to capture upside opportunities when prices are in an uptrend channel while quickly switching to short when prices start to fall, allowing two-way trading.
The strategy first calculates the upper, middle and lower Bollinger Bands. The middle band is the N-day simple moving average of the closing price, while the upper and lower bands are k standard deviations above and below the middle band. The Parabolic SAR indicator is then calculated, with a sell signal triggered when it turns from up to down across the low.
On the long side, if the closing price falls below the Bollinger Lower Band, a long position is entered with a stop loss set at the lower band. When the PSAR reverses direction and goes below the low, a short position is entered, capturing the moment when the signal reverses.
Combining the trend-following nature of Bollinger Bands and the trend reversal characteristic of PSAR, the strategy can track trends and also timely capture reversal opportunities for two-way trading.
-
Improved accuracy from combining indicators. Bollinger Bands judge overall trends while PSAR catches local corrections, complementing each other.
-
Trading with and against the trend. Bollinger Bands catch large trends while PSAR provides reversal signals to trade both ways.
-
More two-way trading opportunities. The strategy profits from both upside and downside moves.
-
Automatic stops limit risk. The adaptive stops based on the Lower Band and PSAR reduce the probability of large losses.
-
Expanding bands could increase losses. Wider Bollinger Bands during volatile markets can place stops too far away, increasing risk.
-
Ill-set PSAR parameters may cause missed reversals. Care is needed when setting the upside and downside parameters.
-
Potentially excessive trades. PSAR is sensitive to minor moves which may trigger unnecessary trades, increasing costs.
-
Optimize Bollinger parameters for changing markets. Different combinations can be tested to find optimal settings across varying environments.
-
Additional filters to remove false signals. Indicators like KDJ can supplement to avoid wrong signals from bad PSAR parameters.
-
Reduce unnecessary trades. Minimum profit stops can prevent excessive minor reversals.
The Dual-Rail Parabolic SAR Bollinger Bands strategy fully utilizes Bollinger's trend-following features and PSAR's reversal identification to enable two-way trading, with and against trends. Compared to single indicators, combining signals significantly improves accuracy and increases correct trade opportunities on reduced false signals. Further enhancements through optimization and supplemental indicators can raise stability and profit factors.
[/trans]
Strategy Arguments
| Argument | Default | Description |
|---|---|---|
| v_input_1 | 0.02 | start |
| v_input_2 | 0.02 | increment |
| v_input_3 | 0.2 | maximum |
| v_input_4 | 20 | length |
| v_input_5 | 2 | mult |
Source (PineScript)
//@version=3
strategy(title="Bollinger + sar", shorttitle="Bollinger + sar",
     overlay=true)

start = input(0.02)
increment = input(0.02)
maximum = input(0.2)

psar = sar(start, increment, maximum)
plot(psar)


source = close
length = input(20, minval=1)
mult = input(2, minval=0.001, maxval=50)

basis = sma(source, length)
dev = mult * stdev(source, length)

upper = basis + dev
lower = basis - dev

plot(upper)
plot(lower)

if (lower >= low)
    strategy.entry("BBandLE", strategy.long, stop=lower, oca_name="BollingerBands",  comment="BBandLE")
else
    strategy.cancel(id="BBandLE")

if (psar <= low)
    strategy.entry("BBandSE", strategy.short, stop=psar, oca_name="BollingerBands", comment="BBandSE")
else
    strategy.cancel(id="BBandSE")
Detail
https://www.fmz.com/strategy/440959
Last Modified
2024-02-04 10:44:45
