Name
双均线SuperTrend量化交易策略Dual-Moving-Average-Supertrend-Quantitative-Trading-Strategy
Author
ChaoZhang
Strategy Description
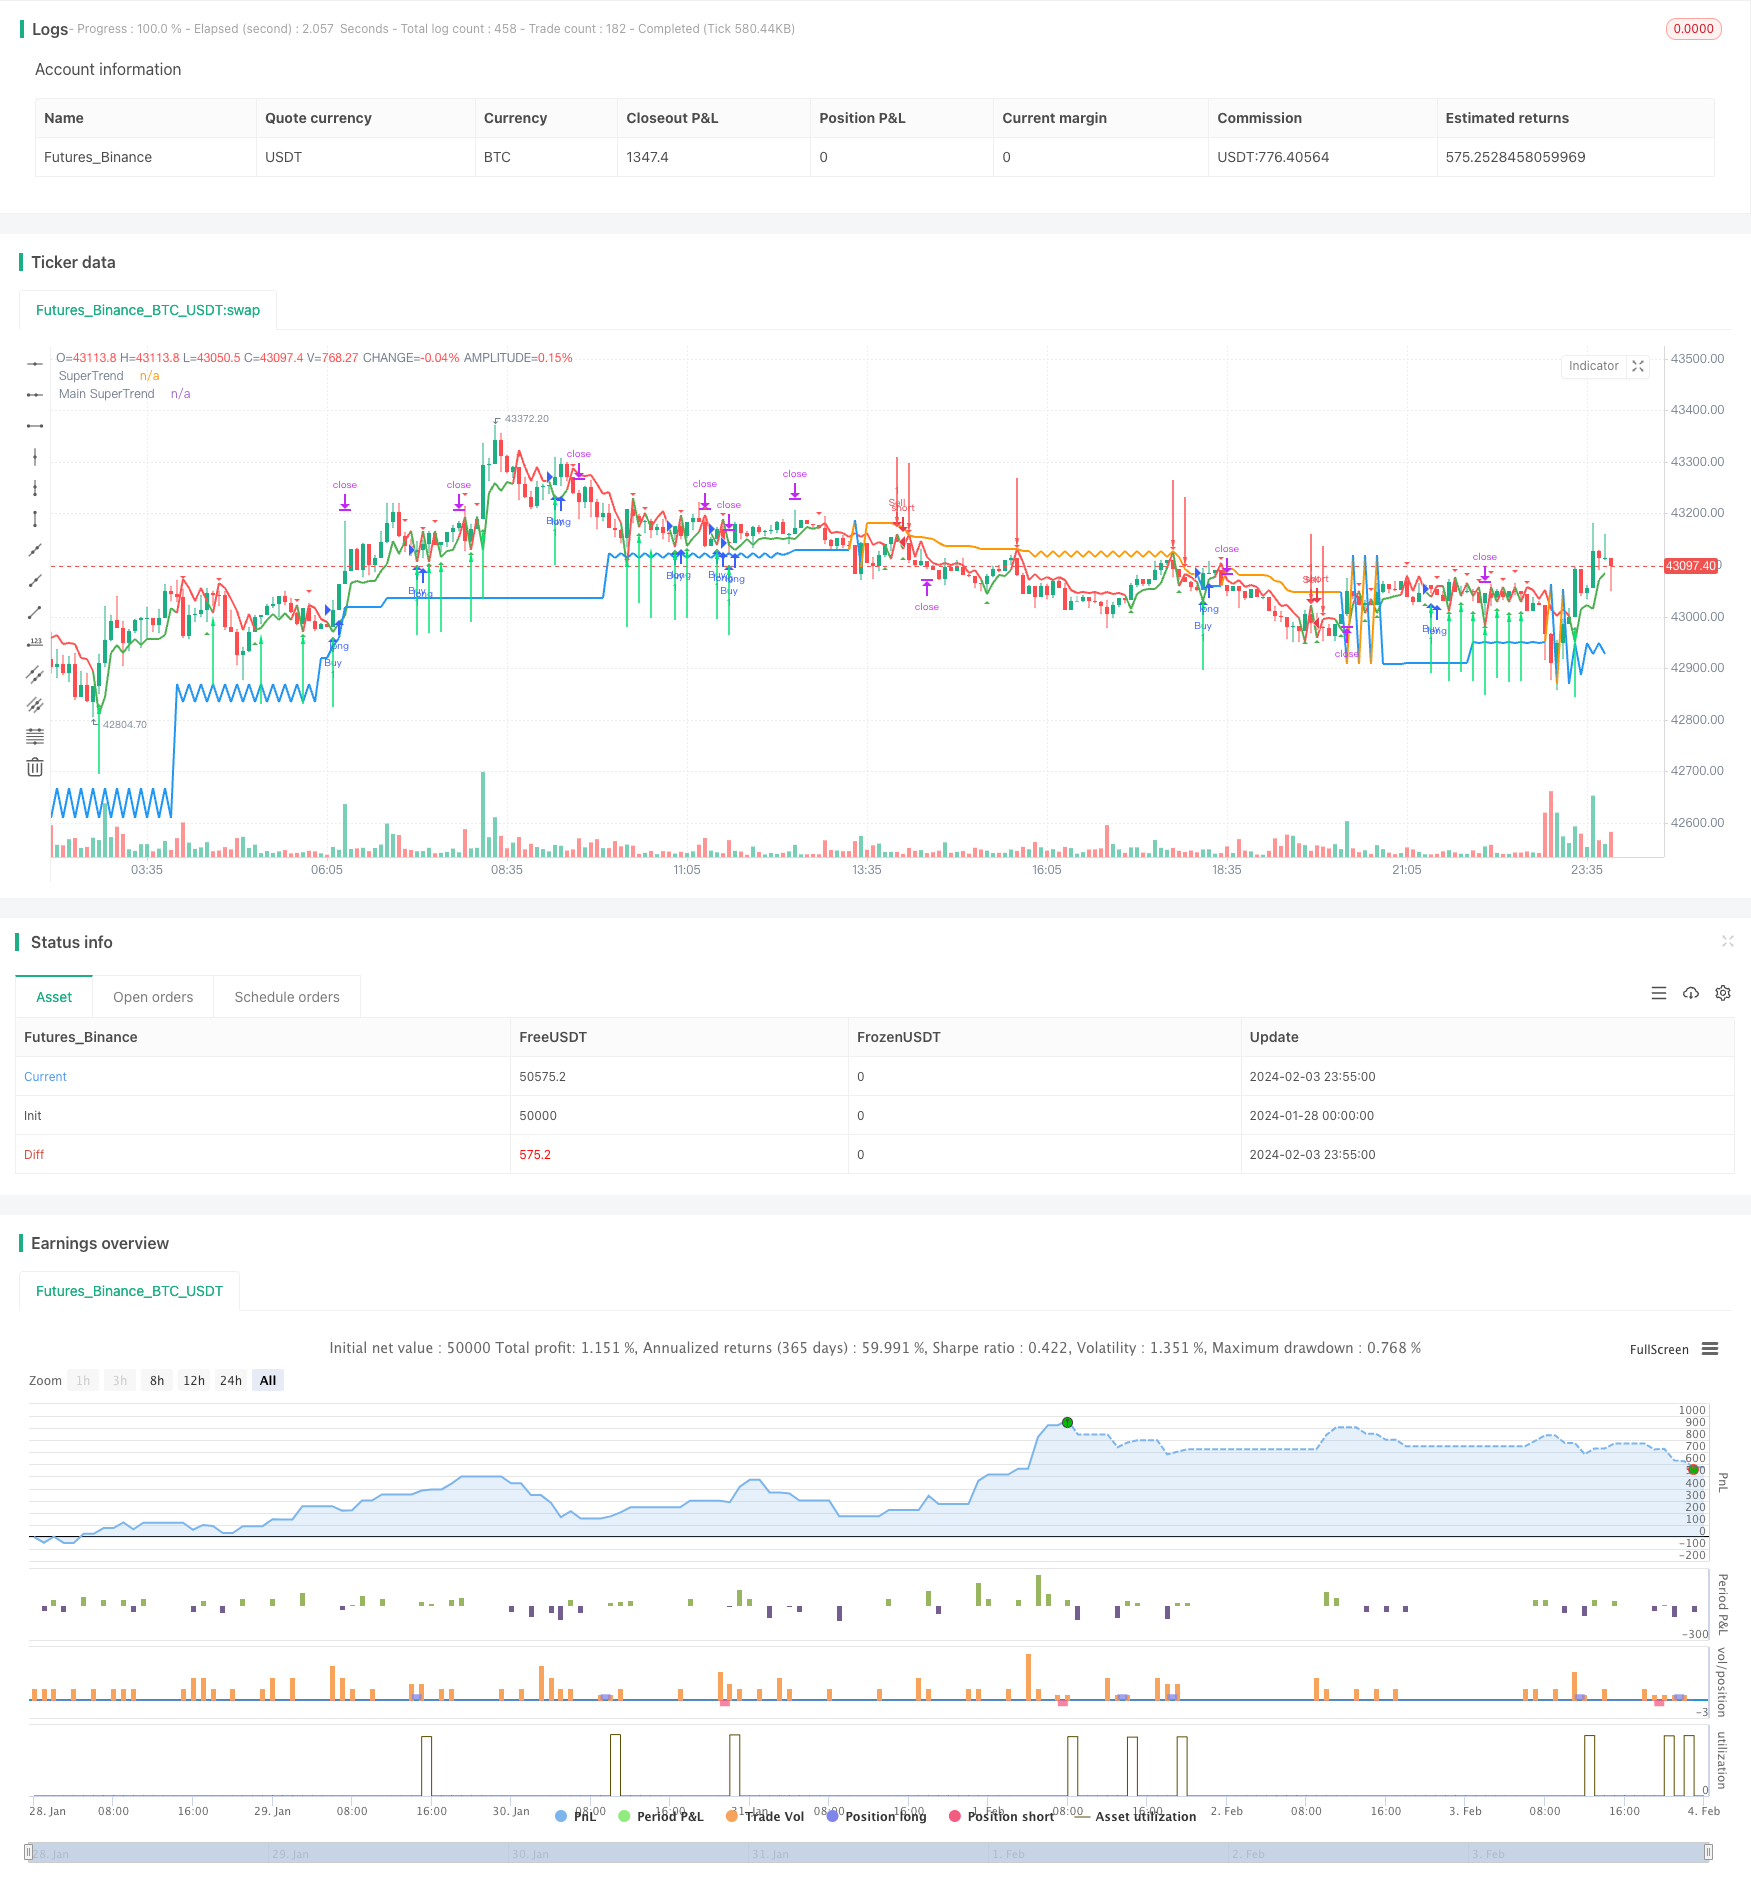
本策略综合运用双均线和SuperTrend两个指标构建交易信号,同时结合不同周期判断趋势方向,实现高效盈利。
本策略使用MACD和SuperTrend两个指标判断入市时机。其中,MACD双均线判断短期趋势方向,Supertrend判断中长期趋势方向。
当快线从下向上突破慢线时为买入信号,此时如果中长期Supertrend同为上升趋势,则产生最终买入信号,做多;反之,当快线从上向下突破慢线时为卖出信号,此时如果中长期Supertrend同为下跌趋势,则产生最终卖出信号,做空。
止损和止盈设置为固定值。
本策略最大优势在于同时运用双均线和SuperTrend判断市场走向,中短期和中长期结合,大幅提高决策效率,避免出现假突破。此外,Supertrend可根据市场波动性调节参数,适应更广泛的市场环境。
本策略主要风险在于固定止损止盈设置可能错失更大盈利空间。此外,如果中短期和中长期判断出现分歧,则策略无法正常工作。我们可以通过止损止盈浮动设置来减少此风险。
本策略可以从以下几个方面进行优化:
-
增加止损止盈动态调整机制,根据市场波动性和趋势设置止损止盈。
-
优化MACD参数,找到更适合目标品种的均线参数。
-
优化Supertrend参数,调整其对市场的敏感度。
-
增加其它指标判断,提供更多维度的信号,提高策略效果。
本策略成功结合了双均线和SuperTrend两个指标的优势,通过不同周期的组合判断,过滤掉错误信号,从而在趋势市中获得较好收益。我们可以通过参数优化和机制调整进一步增强该策略的稳定性和盈利能力。
||
This strategy combines the dual moving average and Supertrend indicators to construct trading signals and judges the trend direction through different cycle combinations to achieve high profitability.
This strategy uses the MACD and Supertrend indicators to determine market entry timing. MACD dual moving averages determine short-term trend direction, while Supertrend determines medium-to-long-term trend direction.
When the fast line breaks through the slow line upward, it is a buy signal. At this time, if the medium-to-long-term Supertrend is also an upward trend, the final buy signal is generated to go long. On the contrary, when the fast line breaks through the slow line downward, it is a sell signal. At this time, if the medium-to-long term Supertrend is also a downward trend, the final sell signal is generated to go short.
The stop loss and take profit are set to fixed values.
The biggest advantage of this strategy is that it uses both double moving averages and Supertrend to determine market direction, combining medium-short-term and medium-long-term analyses to significantly improve decision efficiency and avoid false breakouts. In addition, Supertrend can adjust parameters according to market volatility to adapt to a wider range of market environments.
The main risk of this strategy is that fixed stop loss and take profit settings may miss greater profit opportunities. In addition, if there is divergence between medium-short-term and medium-long-term judgments, the strategy will not work properly. We can reduce this risk through floating stop loss and take profit settings.
This strategy can be optimized in the following aspects:
-
Increase the dynamic adjustment mechanism for stop loss and take profit, and set stop loss and take profit according to market volatility and trends.
-
Optimize MACD parameters to find moving average parameters more suitable for the target variety.
-
Optimize Supertrend parameters to adjust its sensitivity to the market.
-
Increase other indicators for judgment to provide more dimensional signals and improve strategy performance.
This strategy successfully combines the advantages of dual moving averages and Supertrend indicators. By combining different cycle judgments, it filters out wrong signals and obtains better returns in trending markets. We can further enhance the stability and profitability of this strategy through parameter optimization and mechanism adjustments.
[/trans]
Strategy Arguments
| Argument | Default | Description |
|---|---|---|
| v_input_1_close | 0 | source: close |
| v_input_2 | 12 | MACD fast moving average |
| v_input_3 | 26 | MACD slow moving average |
| v_input_4 | 9 | MACD signal line moving average |
| v_input_5 | 120 | Main SuperTrend Time Frame |
| v_input_6 | true | Factor |
| v_input_7 | true | Pd |
| v_input_8 | 500 | Take Profit |
| v_input_9 | 400 | Stop Loss |
Source (PineScript)
/*backtest
start: 2024-01-28 00:00:00
end: 2024-02-04 00:00:00
period: 5m
basePeriod: 1m
exchanges: [{"eid":"Futures_Binance","currency":"BTC_USDT"}]
*/

//@version=2
//Supertrend Strategy by breizh29 using *rajandran.r* Supertrend Indicator

strategy("Super Trend 2 MACD", overlay=true)
// MACD input
source = input(close)
fastLength = input(12, minval=1, title="MACD fast moving average")
slowLength=input(26,minval=1, title="MACD slow moving average")
signalLength=input(9,minval=1, title="MACD signal line moving average")

// Calculation
fastMA = sma(source, fastLength)
slowMA = sma(source, slowLength)

Macd = fastMA - slowMA
Signal = sma(Macd, signalLength)


res = input(title="Main SuperTrend Time Frame",  defval="120")
Factor=input(1, minval=1,maxval = 100)
Pd=input(1, minval=1,maxval = 100)

tp = input(500,title="Take Profit")
sl = input(400,title="Stop Loss")


Up=hl2-(Factor*atr(Pd))
Dn=hl2+(Factor*atr(Pd))
MUp=request.security(syminfo.tickerid,res,hl2-(Factor*atr(Pd)))
MDn=request.security(syminfo.tickerid,res,hl2+(Factor*atr(Pd)))

Mclose=request.security(syminfo.tickerid,res,close)

TrendUp=close[1]>TrendUp[1]? max(Up,TrendUp[1]) : Up
TrendDown=close[1]<TrendDown[1]? min(Dn,TrendDown[1]) : Dn

MTrendUp=Mclose[1]>MTrendUp[1]? max(MUp,MTrendUp[1]) : MUp
MTrendDown=Mclose[1]<MTrendDown[1]? min(MDn,MTrendDown[1]) : MDn

Trend = close > TrendDown[1] ? 1: close< TrendUp[1]? -1: nz(Trend[1],1)
Tsl = Trend==1? TrendUp: TrendDown

MTrend = Mclose > MTrendDown[1] ? 1: Mclose< MTrendUp[1]? -1: nz(MTrend[1],1)
MTsl = MTrend==1? MTrendUp: MTrendDown

linecolor = Trend == 1 ? green : red
plot(Tsl, color = linecolor , style = line , linewidth = 2,title = "SuperTrend")

Mlinecolor = MTrend == 1 ? blue : orange
plot(MTsl, color = Mlinecolor , style = line , linewidth = 2,title = "Main SuperTrend")

plotshape(cross(close,Tsl) and close>Tsl , "Up Arrow", shape.triangleup,location.belowbar,green,0,0)
plotshape(cross(Tsl,close) and close<Tsl , "Down Arrow", shape.triangledown , location.abovebar, red,0,0)

up = Trend == 1 and Trend[1] == -1 and MTrend == 1
down = Trend == -1 and Trend[1] == 1 and MTrend == -1
plotarrow(up ? Trend : na, title="Up Entry Arrow", colorup=lime, maxheight=60, minheight=50, transp=0)
plotarrow(down ? Trend : na, title="Down Entry Arrow", colordown=red, maxheight=60, minheight=50, transp=0)


golong = Trend == 1 and Trend[1] == -1 and MTrend == 1 and Macd > Signal
goshort = Trend == -1 and Trend[1] == 1 and MTrend == -1 and Macd < Signal

strategy.entry("Buy", strategy.long,when=golong)
strategy.exit("Close Buy","Buy",profit=tp,loss=sl)


strategy.entry("Sell", strategy.short,when=goshort)
strategy.exit("Close Sell","Sell",profit=tp,loss=sl)
Detail
https://www.fmz.com/strategy/441065
Last Modified
2024-02-05 12:05:10
