Name
动量趋势优化组合策略Momentum-Trend-Optimization-Combination-Strategy
Author
ChaoZhang
Strategy Description
动量趋势优化组合策略是一种中长线量化交易策略,它结合了动量因子和趋势因子,通过指数移动平均线、移动平均线、成交量和斜率指标的组合生成买入和卖出信号。该策略对T+1交易进行了优化,只适用于做多方向。优化同样适用于国际股市。
该策略使用6日简单移动平均线和35日简单移动平均线定义两个移动平均线。买入信号线定义为2日指数移动平均线,卖出信号线根据过去8日的收盘价计算斜率再平移。此外,还定义了20日成交量的指数移动平均线作为成交量指标。为了过滤掉部分Noise,策略还引入每周斜率多空判断。
当股票收盘价高于35日移动平均线,成交量高于20日成交量平均线,且按周检查为多头市场时,从下方黄金交叉触发买入信号;相反,从上方死亡交叉触发卖出信号。
风险管理方面,策略引入了动态仓位调整机制。根据账户权益、最大仓位比例、ATR和风险因子计算出实际仓位。这有助于控制策略的最大回撤。
该策略结合动量因子和趋势过滤,能够有效识别中长线方向。同时,对 Noise 的过滤也较为到位,有利于在震荡行情中避免错信号。此外,风险管理机制的引入也使得最大回撤控制得当,从而保证了策略的稳健性。
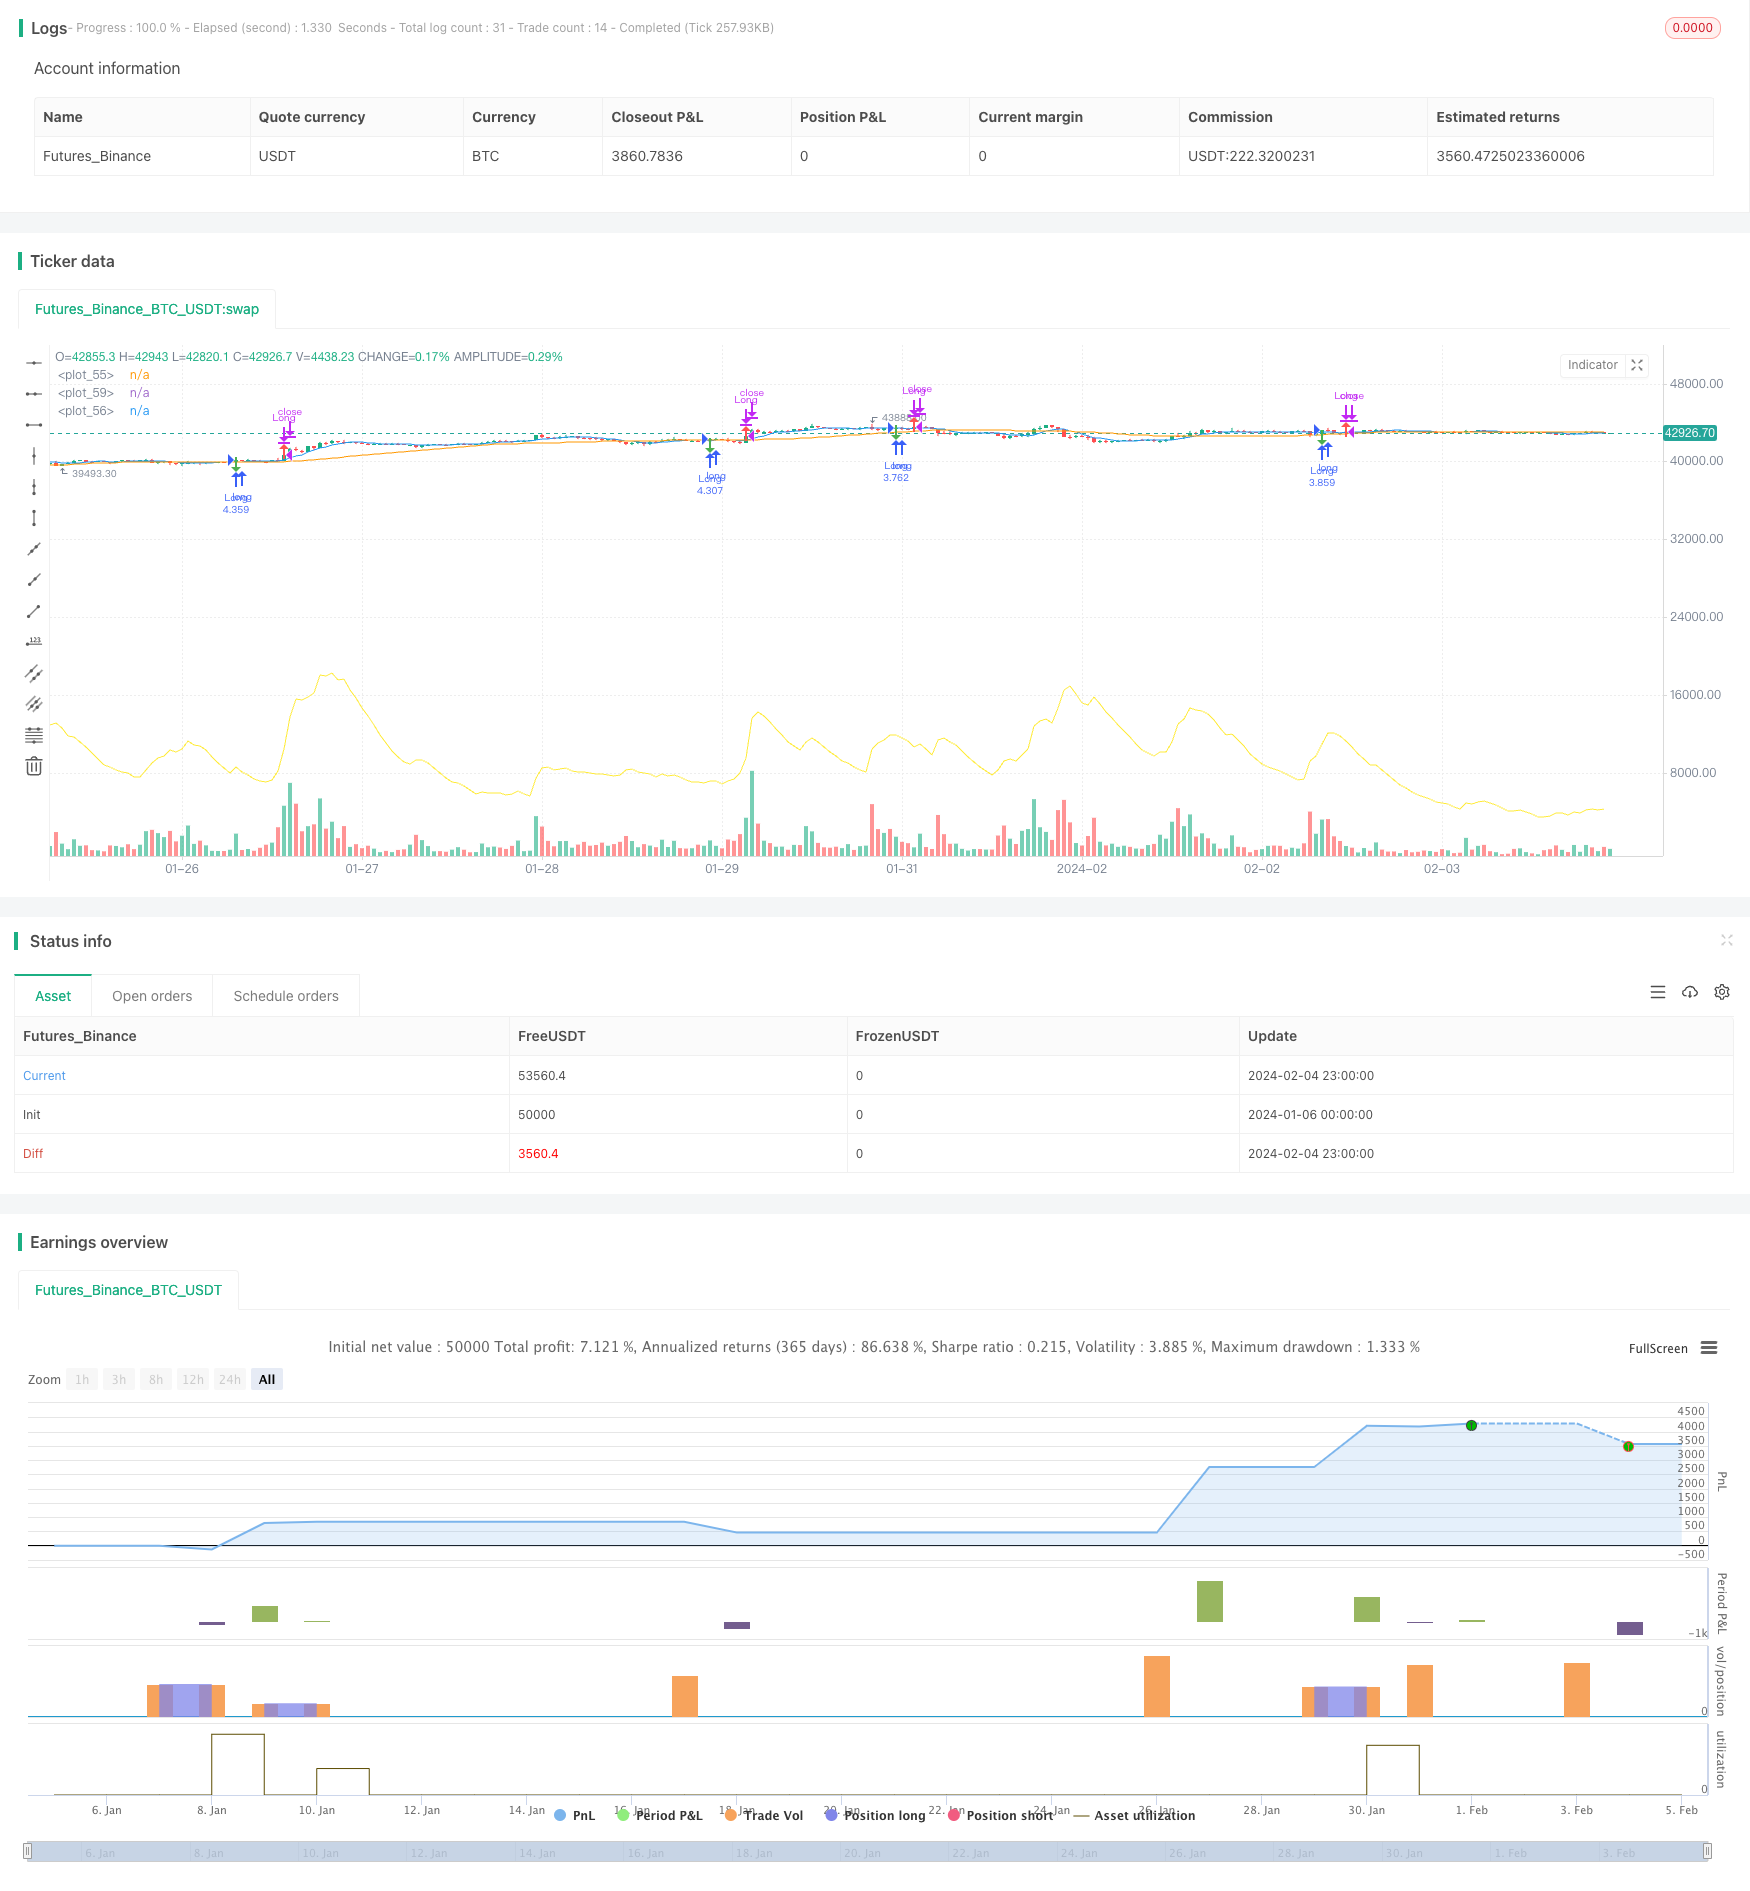
从回测结果看,策略整体收益率高达128.86%,具有非常显著的 Alpha。同时,策略的胜率也达到了60.66%,体现了策略效果的稳定性。
尽管策略本身已经对风险管理机制进行了优化,但仍然存在一定的风险需要关注。具体来说,主要风险包括:
-
回撤风险。从单笔最大亏损222,021.46元可见,策略回撤幅度较大。这与仓位管理机制不完善有关。
-
信号稳定性风险。策略信号可能受到个股特殊因素的影响,从而出现误信号的情况。这会对策略收益造成一定冲击。
-
市场环境变化风险。如果宏观市场环境发生重大变化,策略参数可能需要进行调整才能继续保持效果。
根据以上风险分析,该策略仍有优化的 necessity 和 possibility。
-
从最大亏损情况看,可以进一步优化仓位管理机制,引入止损模块,以控制单笔亏损的幅度。
-
可以考虑加入更多过滤指标,识别一些特殊的个股现象,以减少误信号的概率。例如引入量价背离指标等。
-
应持续回测和验证策略参数,根据市场环境的变化及时进行参数调整。同时也要防止过度优化的情况发生。
动量趋势优化组合策略是一种中长线量化交易策略,结合动量因子和趋势过滤,对T+1交易进行了专门优化。从回测指标看,策略整体效果显著,具有非常惊人的Alpha。但也应关注可能的风险,并及时根据市场环境进行参数调整。该策略可为量化交易者带来额外的Alpha,值得进一步研究和验证。
||
The Momentum Trend Optimization Combination Strategy is a medium- to long-term quantitative trading strategy that combines momentum and trend factors. It generates buy and sell signals by using a combination of exponential moving averages, moving averages, volume and slope indicators. The strategy is optimized for T+1 trading and is only suitable for long positions. The optimizations are also applicable to international stock markets.
The strategy uses a 6-day simple moving average and a 35-day simple moving average to define two moving averages. The buy signal line is defined as a 2-day exponential moving average, and the sell signal line is calculated based on the slope over the past 8 closing prices. In addition, a 20-day exponential moving average of volume is defined as the volume indicator. To filter out some noise, the strategy also introduces weekly slope judgment for market direction.
When the closing price is higher than the 35-day moving average, the trading volume is higher than the 20-day average trading volume, and the weekly check shows a bull market, a golden cross from the bottom triggers a buy signal. Conversely, a death cross from the top triggers a sell signal.
For risk management, the strategy introduces a dynamic position adjustment mechanism. The actual position is calculated based on account equity, maximum position ratio, ATR and risk factor. This helps to control the maximum drawdown of the strategy.
The strategy combines momentum factors and trend filtering, which can effectively identify medium- to long-term directions. At the same time, the filtering of noise is also in place to avoid false signals in volatile markets. In addition, the introduction of risk management mechanisms also enables proper control over maximum drawdowns, thus ensuring the robustness of the strategy.
From the backtest results, the overall return of the strategy reached 128.86%, with a very significant Alpha. At the same time, the win rate of the strategy also reached 60.66%, reflecting the stability of the strategy effect.
Although the strategy itself has been optimized for risk management mechanisms, there are still some risks that need attention. Specifically, the main risks include:
-
Drawdown risk. From the single largest loss of 222,021.46 yuan, it can be seen that the retracement amplitude of the strategy is large. This is related to the imperfect position management mechanism.
-
Signal stability risk. The strategy signal may be affected by special factors of individual stocks, resulting in false signal situations. This will have a certain impact on the strategy's returns.
-
Market environment change risk. If the macro market environment changes significantly, the strategy parameters may need to be adjusted in order to continue to maintain the effect.
According to the above risk analysis, there is still necessity and possibility to optimize this strategy.
-
Judging from the maximum loss, the position management mechanism can be further optimized by introducing a stop loss module to control the magnitude of single losses.
-
Consider adding more filtering indicators to identify some special stock phenomena and reduce the probability of false signals. For example, introduce volume-price divergence indicators.
-
Continue backtesting and verifying strategy parameters, and make timely parameter adjustments based on changes in market conditions. At the same time, over-optimization should be prevented.
The Momentum Trend Optimization Combination Strategy is a medium- to long-term quantitative trading strategy that combines momentum factors and trend filtering and is specially optimized for T+1 trading. Judging from the backtest indicators, the overall effect of the strategy is significant, with a very amazing Alpha. But the potential risks should also be concerned about, and parameters should be adjusted in time according to changes in market conditions. The strategy can bring additional Alpha to quantitative traders and is worth further research and verification.
[/trans]
Strategy Arguments
| Argument | Default | Description |
|---|---|---|
| v_input_float_1 | 0.01 | Max Position Size (%) |
| v_input_float_2 | 2 | Risk Factor |
Source (PineScript)
/*backtest
start: 2024-01-06 00:00:00
end: 2024-02-05 00:00:00
period: 1h
basePeriod: 15m
exchanges: [{"eid":"Futures_Binance","currency":"BTC_USDT"}]
*/

// This source code is subject to the terms of the Mozilla Public License 2.0 at https://mozilla.org/MPL/2.0/
// © fzj20020403

////@version=5
//@version=5
strategy("Optimized Zhaocaijinbao", overlay=true, margin_long=100, margin_short=0, default_qty_type=strategy.percent_of_equity, default_qty_value=100)

// Define two moving averages
ma6 = ta.sma(close, 6)
ma35 = ta.sma(close, 35)

// Define buy and sell signal lines
buyLine = ta.ema(close, 2)
sellSlope = (close - close[8]) / 8
sellLine = sellSlope * 1 + ta.sma(close, 8)

// Define volume indicator
volumeEMA = ta.ema(volume, 20)

// Define weekly slope factor
weeklyMa = ta.sma(close, 50)
weeklySlope = (weeklyMa - weeklyMa[4]) / 4 > 0

// Generate buy and sell signals
buySignal = ta.crossover(buyLine, sellLine) and close > ma35 and volume > volumeEMA and weeklySlope
sellSignal = ta.crossunder(sellLine, buyLine)

// Define dynamic position sizing factor
equity = strategy.equity
maxPositionSize = equity * input.float(title='Max Position Size (%)', defval=0.01, minval=0.001, maxval=0.5, step=0.001)
riskFactor = input.float(title='Risk Factor', defval=2.0, minval=0.1, maxval=10.0, step=0.1)
atr = ta.atr(14)
positionSize = maxPositionSize * riskFactor / atr

// Define position status
var inPosition = false

// Define buy and sell conditions
buyCondition = buySignal and not inPosition
sellCondition = sellSignal and inPosition

// Perform buy and sell operations
if (buyCondition)
    strategy.entry("Long", strategy.long, qty=positionSize)
    inPosition := true
if (sellCondition)
    strategy.close("Long")
    inPosition := false

// Draw vertical line markers for buy and sell signals
plotshape(buyCondition, style=shape.arrowdown, location=location.belowbar, color=color.green, size=size.small)
plotshape(sellCondition, style=shape.arrowup, location=location.abovebar, color=color.red, size=size.small)

// Draw two moving averages
plot(ma6, color=color.blue)
plot(ma35, color=color.orange)

// Draw volume indicator line
plot(volumeEMA, color=color.yellow)

// Define stop loss and take profit
stopLoss = strategy.position_avg_price * 0.5
takeProfit = strategy.position_avg_price * 1.25

if inPosition
    strategy.exit("Long Stop Loss", "Long", stop=stopLoss)
    strategy.exit("Long Take Profit", "Long", limit=takeProfit)
Detail
https://www.fmz.com/strategy/441184
Last Modified
2024-02-06 15:11:57
