Name
动量指标反向交易策略Momentum-Reversal-Trading-Strategy
Author
ChaoZhang
Strategy Description
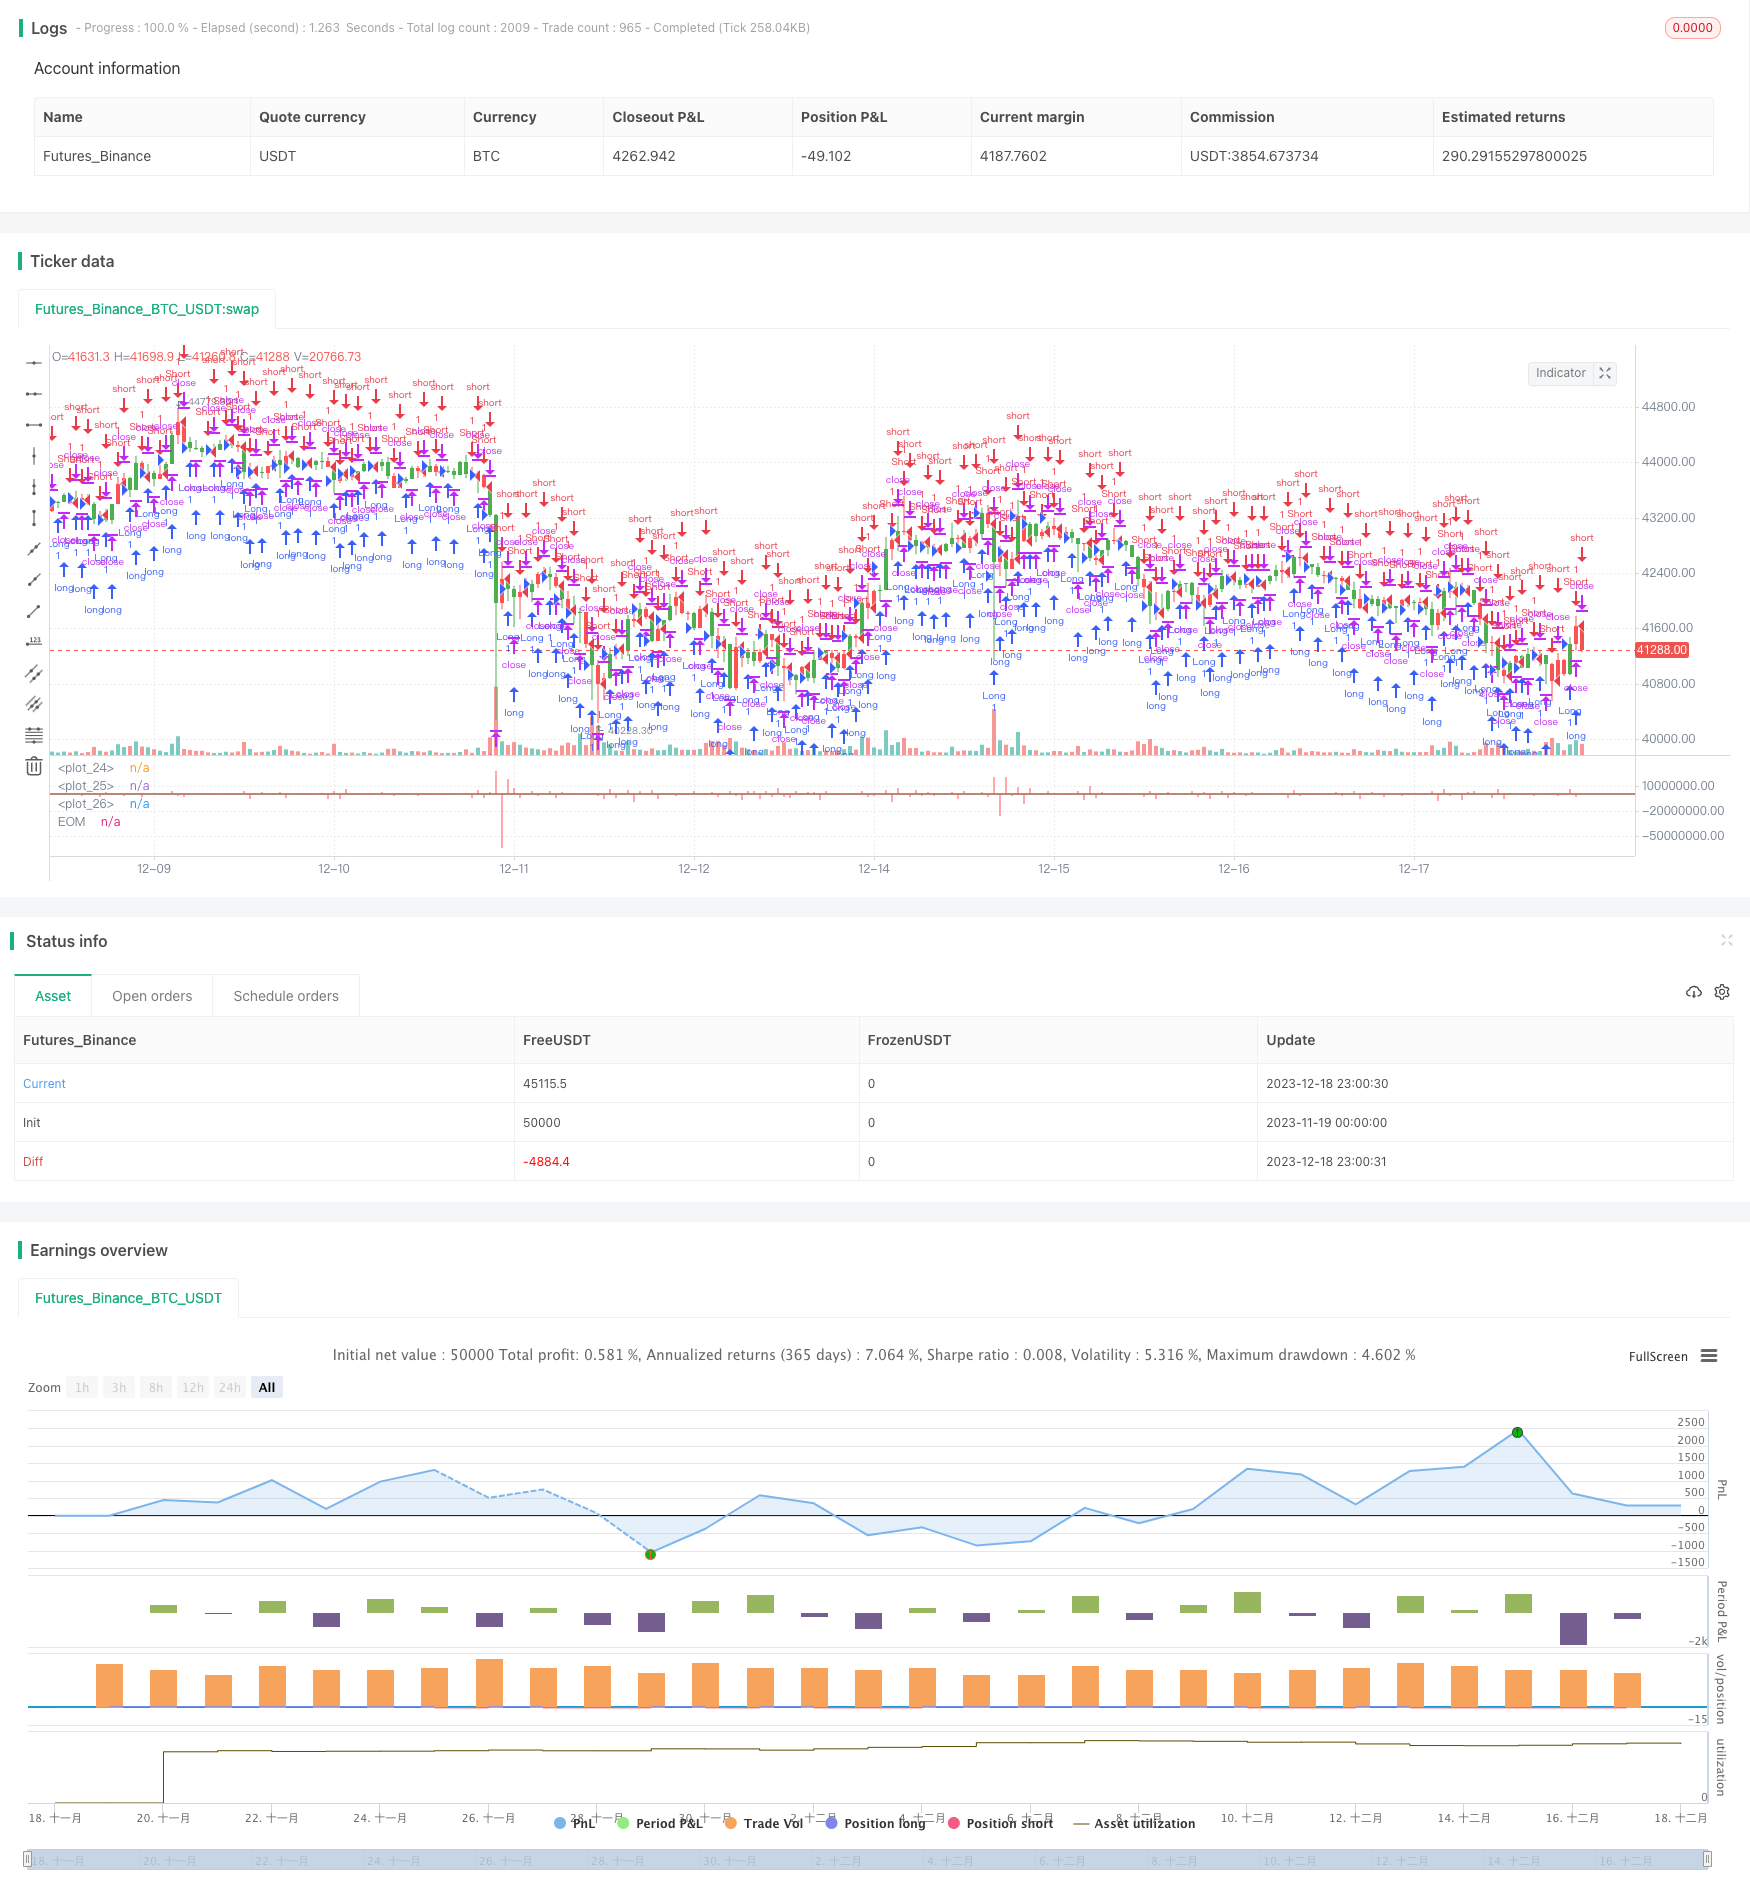
该策略是基于动量指标的反向交易策略。它使用易行指标(EOM)来判断市场的走势,当指标超过设定的阈值时做多做空。同时提供反向交易功能,可以根据实际需要选择正向交易或反向交易。
易行指标(EOM)是衡量价格和成交量变动幅度的指标。它同时返回正负值。正值表示价格上涨,负值表示价格下跌。数值越大表示价格变动越大和/或成交量越小。
该策略的原理是:
- 计算当前K线的易行指标值
- 判断指标值是否超过设定的做多阈值或做空阈值
- 如果超过做多阈值(默认4000),做多
- 如果低于做空阈值(默认-4000),做空
- 提供反向交易功能
- 正常情况下做多时为看涨,做空时为看跌
- 开启反向交易后,做多为看跌,做空为看涨
该策略主要优势有:
- 使用易行指标判断市场实际走势,指标反映价格和成交量变化
- 阈值可自定义设置
- 提供反向交易功能,可以根据需要选择正向交易或反向交易
- 直观通过K线颜色判断做多做空
该策略主要风险有:
- 易行指标存在错触风险,可能出现假突破
- 阈值设定不当可能导致交易频繁或次数过少
- 反向交易时,需要确保自己有足够的风险承受能力
解决方法:
- 结合其他指标判断,避免错触
- 调整阈值参数,优化交易次数
- 正确评估自己的实际风险承受能力
该策略可以从以下几个方向进行优化:
- 结合移动平均线等指标,避免假突破
- 添加止损机制
- 优化参数,调整做多做空的阈值
- 增加开仓条件,避免频繁交易
- 反向交易时可设置风险管理策略
通过以上几点优化,可以使策略更稳定,降低风险,提高实盘效果。
总的来说,该策略利用易行指标判断市场实际走势,通过做多和做空获得超额收益。它简单易用,同时考虑了价格变动和交易量变动两个因素。如果用于实盘,建议结合其他技术指标,并适当优化参数,可以获得更好的效果。
||
This is a reversal trading strategy based on the Momentum indicator. It uses the Ease of Movement (EOM) indicator to determine market trends and goes long or short when the indicator exceeds preset thresholds. It also provides reverse trading function that allows choosing between regular or reverse trading.
The Ease of Movement (EOM) indicator gauges the magnitude of price and volume changes. It returns both positive and negative values. A positive value means the price has gone up and a negative value means the price has gone down. The larger the absolute value, the bigger the price change and/or the smaller the trading volume.
The logic behind this strategy is:
- Calculate current bar's EOM value
- Check if the EOM value exceeds long or short threshold
- If above long threshold (default 4000), go long
- If below short threshold (default -4000), go short
- Provide reverse trading function
- By default, long = bullish, short = bearish
- When reverse is enabled, long = bearish, short = bullish
The main advantages of this strategy:
- Use EOM indicator to determine actual market trend based on price and volume changes
- Customizable threshold for long/short
- Provide reverse trading mode
- Intuitive long/short signal from bar color
The main risks of this strategy:
- EOM could have false breakout
- Improper threshold may lead to over/under trading
- Need sufficient risk tolerance for reverse trading
Solutions:
- Use other indicators to avoid false signal
- Optimize parameters and adjust threshold
- Evaluate your own risk tolerance level
This strategy can be optimized in the following aspects:
- Add moving average to avoid false breakout
- Add stop loss
- Optimize long/short threshold parameters
- Add more entry conditions to control trading frequency
- Add risk management rules for reverse trading
By making the above optimizations, the strategy can become more robust, lower risks, and improve real trading performance.
In conclusion, this strategy utilizes the Ease of Movement indicator to determine actual market trends, and profits from long/short trading. It is easy to use and considers both price change and volume change factors. When apply it in real trading, it is recommended to incorporate other technical indicators and optimize parameters properly for better performance.
[/trans]
Strategy Arguments
| Argument | Default | Description |
|---|---|---|
| v_input_1 | 4000 | BuyZone |
| v_input_2 | -4000 | SellZone |
| v_input_3 | false | Trade reverse |
Source (PineScript)
/*backtest
start: 2023-11-19 00:00:00
end: 2023-12-19 00:00:00
period: 1h
basePeriod: 15m
exchanges: [{"eid":"Futures_Binance","currency":"BTC_USDT"}]
*/

//@version=2
////////////////////////////////////////////////////////////
//  Copyright by HPotter v1.0 19/06/2018
// This indicator gauges the magnitude of price and volume movement.
// The indicator returns both positive and negative values where a
// positive value means the market has moved up from yesterday's value
// and a negative value means the market has moved down. A large positive
// or large negative value indicates a large move in price and/or lighter
// volume. A small positive or small negative value indicates a small move
// in price and/or heavier volume.
// A positive or negative numeric value. A positive value means the market
// has moved up from yesterday's value, whereas, a negative value means the
// market has moved down.
//
// You can change long to short in the Input Settings
// WARNING:
// - For purpose educate only
// - This script to change bars colors.
////////////////////////////////////////////////////////////
strategy(title="Ease of Movement (EOM) Backtest", shorttitle="EOM")
BuyZone = input(4000, minval=1)
SellZone = input(-4000, minval=1)
reverse = input(false, title="Trade reverse")
hline(0, color=blue, linestyle=line)
hline(BuyZone, color=green, linestyle=line)
hline(SellZone, color=red, linestyle=line)
xHigh = high
xLow = low
xVolume = volume
xHalfRange = (xHigh - xLow) * 0.5
xMidpointMove = mom(xHalfRange, 1)
xBoxRatio = iff((xHigh - xLow) != 0, xVolume / (xHigh - xLow), 0)
nRes = iff(xBoxRatio != 0, 1000000 * ((xMidpointMove - xMidpointMove[1]) / xBoxRatio), 0)
pos = iff(nRes > BuyZone, 1,
       iff(nRes < SellZone, -1, nz(pos[1], 0)))
possig = iff(reverse and pos == 1, -1,
          iff(reverse and pos == -1, 1, pos))
if (possig == 1)
    strategy.entry("Long", strategy.long)
if (possig == -1)
    strategy.entry("Short", strategy.short)
barcolor(possig == -1 ? red: possig == 1 ? green : blue )
plot(nRes, color=red, title="EOM", style=histogram, linewidth=2)
Detail
https://www.fmz.com/strategy/435988
Last Modified
2023-12-20 16:09:50
