Name
动量布林带突破策略Momentum-Bollinger-Bands-Breakout-Strategy
Author
ChaoZhang
Strategy Description
[trans]
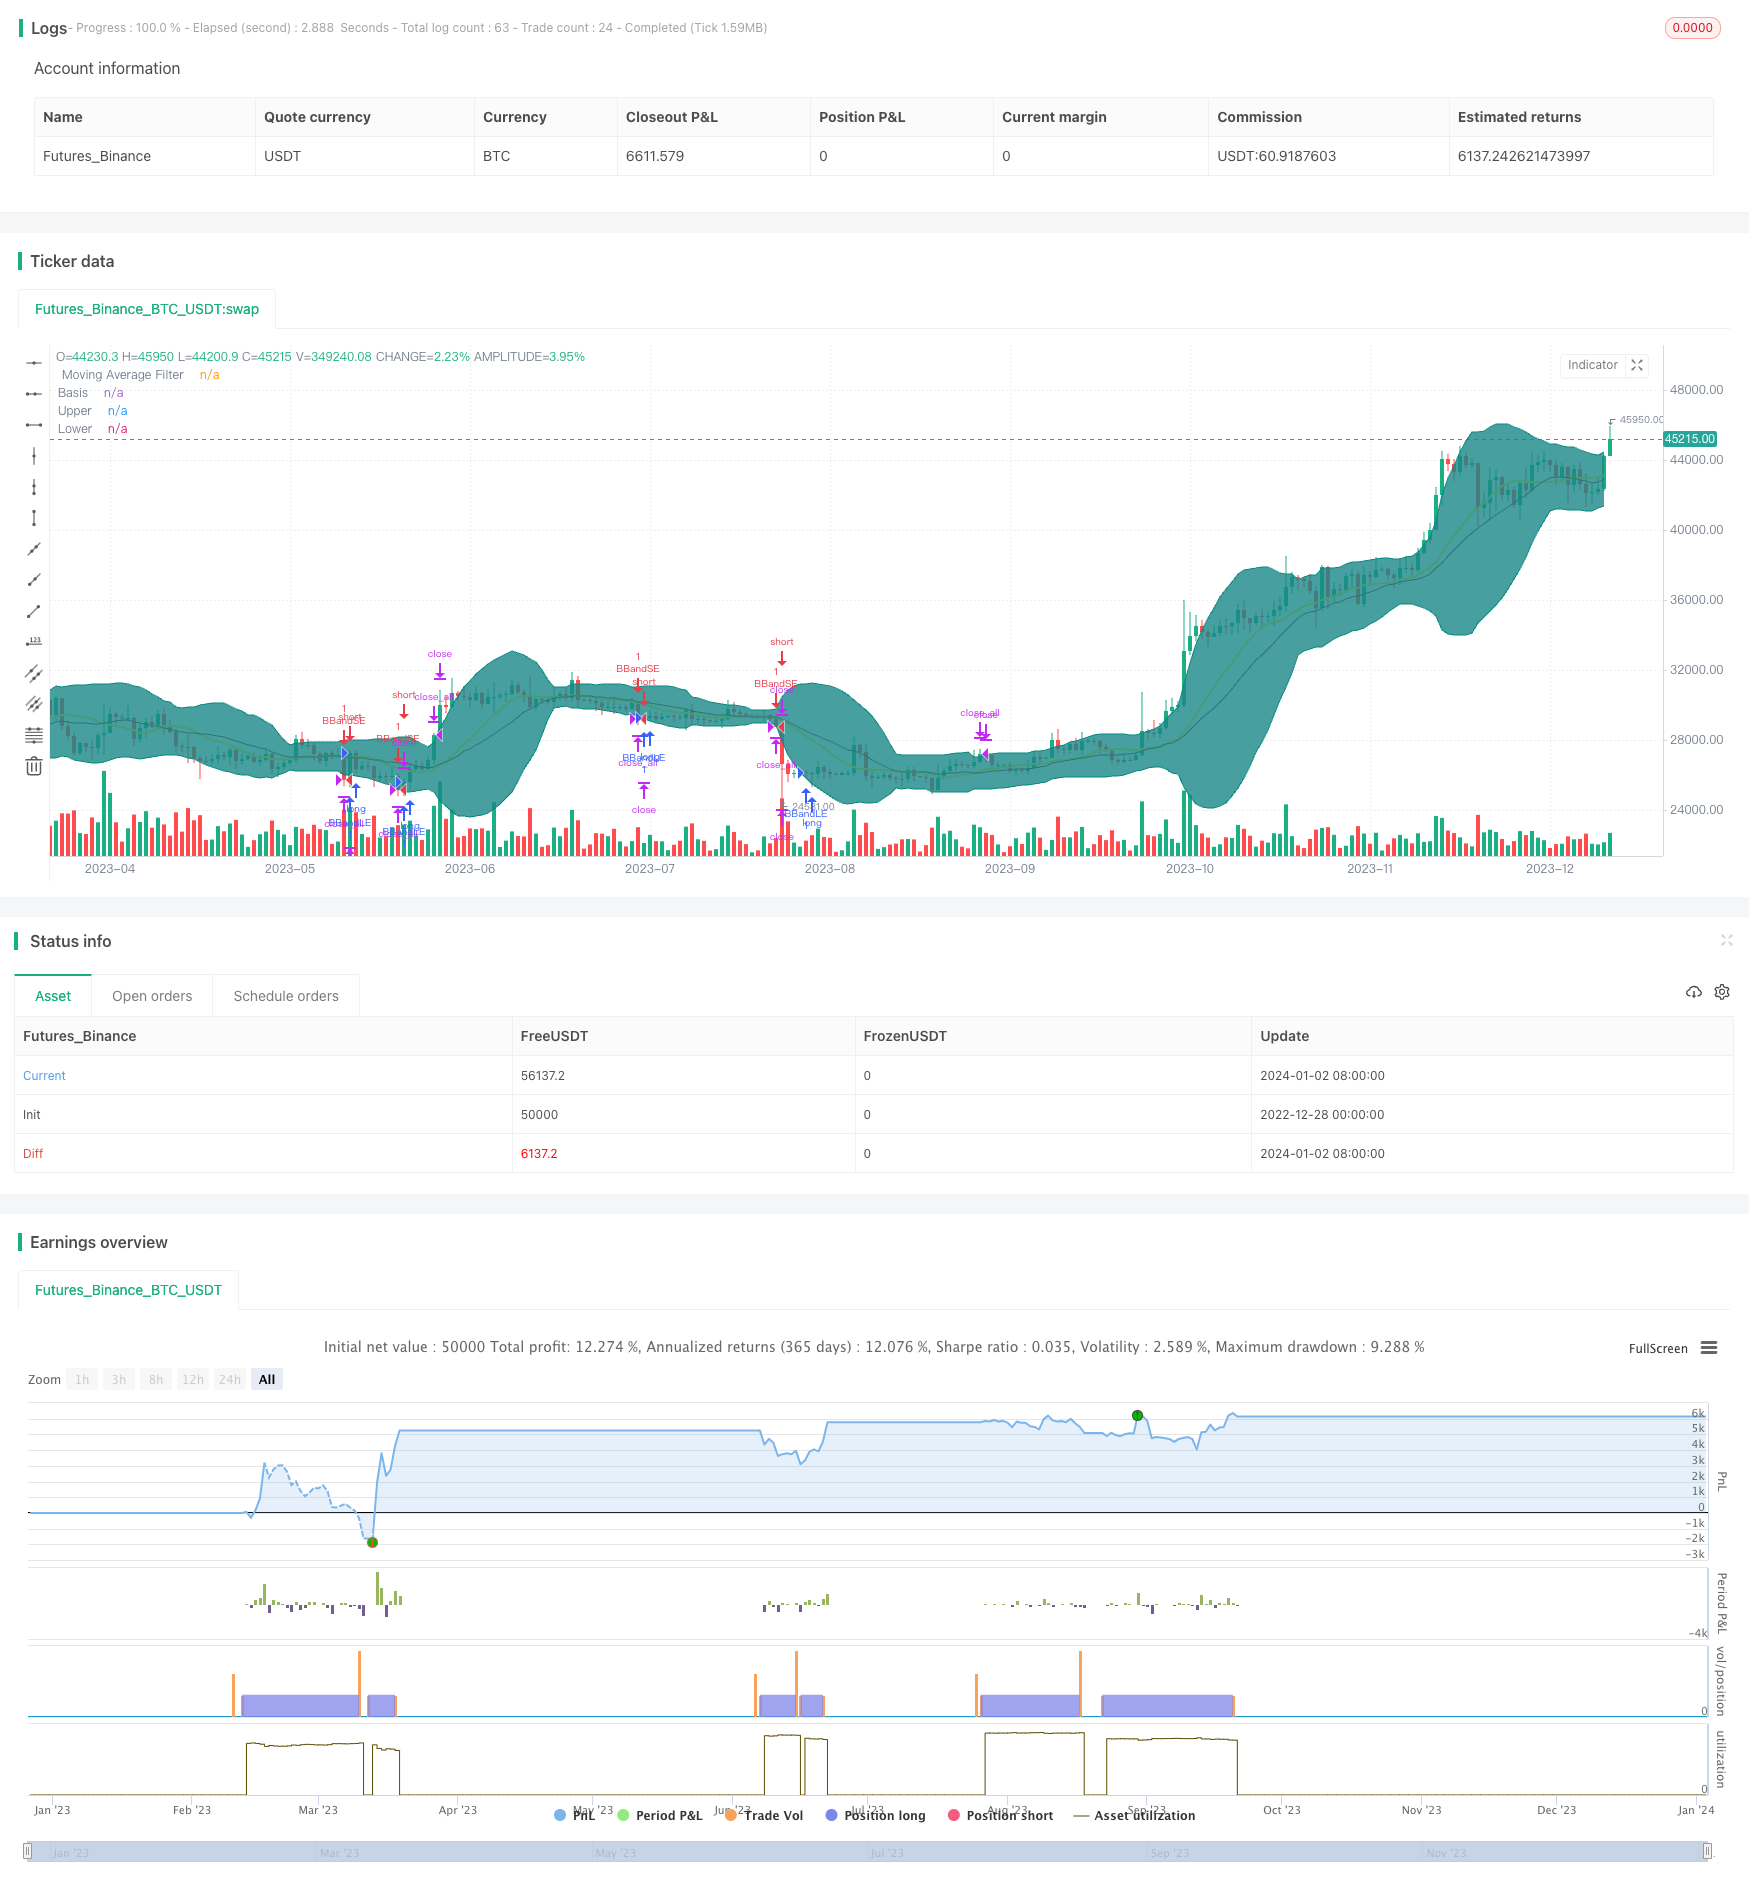
动量布林带突破策略(Momentum Bollinger Bands Breakout Strategy)是一个融合布林带指标和移动平均线指标,在一定动量条件下进行突破操作的量化交易策略。该策略主要利用布林带的高低轨对价格进行界定,结合移动平均线进行额外的价格过滤,在一定动量条件下发出买卖信号,进行布林带上轨和下轨的突破操作。
该策略主要基于布林带指标和移动平均线MA指标,布林带以及移动平均线属于趋势跟踪型指标。布林带利用标准差概念,描绘出价格的高低波动范围。移动平均线平滑价格数据,判断价格趋势方向。
策略的核心逻辑:
-
初始化布林带参数,计算出中轨、上轨、下轨。
-
初始化移动平均线参数。
-
买入信号:当价格从下向上突破布林带下轨且移动平均线位于下轨之下时,做多。
-
卖出信号:当价格从上向下突破布林带上轨且移动平均线位于上轨之上时,做空。
-
退出信号:价格重新进入布林带范围时,平仓。
该策略综合运用布林带指标和移动平均线指标,在一定动量条件下产生交易信号,属于典型的趋势跟踪策略。
-
利用布林带清晰判断价格波动范围,移动平均线判断价格趋势方向,结合双重指标过滤,形成的交易信号具有较高的可靠性。
-
在价格突破布林带边界的同时,要求移动平均线也突破,保证具备足够的动量支撑,避免假突破。
-
策略参数设置合理灵活,可以调整布林带参数和移动平均线周期,适应不同品种和行情环境。
-
策略思路清晰易理解,容易实施和验证。
-
布林带波动指标本身对市场波动具有潜在的滞后性,在快速变化的趋势中可能会产生失效的交易信号。
-
移动平均线作为过滤指标时,其参数设置会直接影响策略频率。参数设置不当可能导致错过交易机会。
-
需要同时依赖布林带指标和移动平均线指标形成有效信号,一旦其中之一失效,整个策略会受到影响。
-
突破类策略较为激进,当价格出现回调试验布林带边界时,容易被套住。
-
优化布林带参数,适应不同周期和波动度的品种,如修改布林带周期、标准差倍数参数。
-
优化移动平均线周期参数,平衡频率与过滤效果。
-
增加止损策略,以控制单笔交易的最大亏损。
-
结合其它指标,如RSI、MACD等形成组合指标,丰富策略交易信号。
-
结合机器学习模型,辅助判断价格趋势方向和破防成功率。
本策略整合布林带指标与移动平均线指标,在确保一定价格突破动量的前提下,产生入市和出市信号。策略思路清晰,易于实施,能够有效跟踪趋势性行情。但同时也存在一定回撤风险,需要针对参数设置与止损方面进行优化,以适应市场的变化。
||
The Momentum Bollinger Bands Breakout Strategy is a quantitative trading strategy that combines the Bollinger Bands indicator and the Moving Average indicator to make breakout operations under certain momentum conditions. The strategy mainly uses the upper and lower rails of Bollinger Bands to define prices and adds additional price filtering with moving averages, issuing buy and sell signals under certain momentum conditions to make breakout operations on the upper and lower rails of Bollinger Bands.
The strategy is mainly based on the Bollinger Bands indicator and the MA moving average indicator. Bollinger Bands and moving averages belong to trend-following indicators. Bollinger Bands use the standard deviation concept to depict the high and low fluctuation range of prices. The moving average smooths the price data and judges the direction of the price trend.
The core logic of the strategy is:
-
Initialize Bollinger Bands parameters and calculate the middle rail, upper rail and lower rail.
-
Initialize the moving average parameters.
-
Buy signal: when the price breaks through the lower rail of the Bollinger Bands from bottom to top and the moving average is below the lower rail, go long.
-
Sell signal: when the price breaks through the upper rail of the Bollinger Bands from top to bottom and the moving average is above the upper rail, go short.
-
Exit signal: when the price re-enters the Bollinger Bands range, close the position.
The strategy combines the use of Bollinger Bands and moving average indicators to generate trading signals under certain momentum conditions, which is a typical trend-following strategy.
-
Using Bollinger Bands to clearly judge the price fluctuation range and the moving average to determine the price trend direction, the trading signals formed by the combination of dual indicator filtering have relatively high reliability.
-
In addition to the price breaking through the Bollinger Bands boundary, it also requires the moving average to break through, which ensures sufficient momentum support to avoid false breakouts.
-
The strategy parameters are set reasonably and flexibly, which can adjust the parameters of Bollinger Bands and moving average cycles to adapt to different varieties and market conditions.
-
The strategy idea is clear and easy to understand, easy to implement and verify.
-
The Bollinger Bands volatility indicator itself has potential lag in rapidly changing trends, which may generate invalid trading signals.
-
When used as a filtering indicator, the setting of its parameters directly affects the frequency of the strategy. Improper settings may miss trading opportunities.
-
Relying on both the Bollinger Bands indicator and the moving average indicator to form effective signals, once one of them fails, the entire strategy will be affected.
-
Breakout strategies are more aggressive. When prices pullback to test the Bollinger Bands boundary, they are prone to being trapped.
-
Optimize Bollinger Bands parameters to adapt to varieties with different cycles and volatility, such as modifying the period and standard deviation multiplier parameters of Bollinger Bands.
-
Optimize the moving average cycle parameters to balance frequency and filtering effect.
-
Increase stop loss strategy to control maximum loss per trade.
-
Combine with other indicators such as RSI and MACD to form composite indicators and enrich trading signals for the strategy.
-
Combine machine learning models to assist in judging price trend direction and breakout success rate.
This strategy integrates the Bollinger Bands indicator with the moving average indicator to generate entry and exit signals after ensuring a certain price breakout momentum. The strategy idea is clear and easy to implement, and can effectively track trending markets. But at the same time, there are also certain pullback risks. It needs to be optimized for parameter settings and stop losses to adapt to market changes.
[/trans]
Strategy Arguments
| Argument | Default | Description |
|---|---|---|
| v_input_1 | true | ===BB Values=== |
| v_input_2_close | 0 | BB Source: close |
| v_input_3 | 20 | BB Length |
| v_input_4 | 2 | BB Multiplier |
| v_input_5 | false | BB Offset |
| v_input_6 | true | ===MA Values=== |
| v_input_7 | 14 | Moving Average Period |
| v_input_8_close | 0 | Moving Average Source: close |
| v_input_9 | true | ===Strategy Conditions=== |
| v_input_10 | false | Exit at Basis Line? |
| v_input_11 | false | Use Moving Average Filter? |
Source (PineScript)
/*backtest
start: 2022-12-28 00:00:00
end: 2024-01-03 00:00:00
period: 1d
basePeriod: 1h
exchanges: [{"eid":"Futures_Binance","currency":"BTC_USDT"}]
*/

//@version=4
//
strategy("Advanced Bollinger Bands Strategy", overlay=true)
//BB Values
wall1= input(defval=true,title="===BB Values===",type=input.bool)
source = input(defval=close,title="BB Source",type=input.source)
length = input(20,title="BB Length", minval=1)
mult = input(2.0,title="BB Multiplier",minval=0.001, maxval=50)
basis = sma(source, length)
dev = mult * stdev(source, length)
upper = basis + dev
lower = basis - dev
offset = input(0, " BB Offset", type = input.integer, minval = -500, maxval = 500)
plot(basis, "Basis", color=#872323, offset = offset)
p1 = plot(upper, "Upper", color=color.teal, offset = offset)
p2 = plot(lower, "Lower", color=color.teal, offset = offset)
fill(p1, p2, title = "Background", color=#198787, transp=95)
//Moving Average Values
wall2= input(defval=true,title="===MA Values===",type=input.bool)
nfl= input(defval=14,title="Moving Average Period",type=input.integer,minval=1,maxval=100)
source1= input(defval=close,title="Moving Average Source",type=input.source)
noisefilter= sma(source1,nfl)
plot(noisefilter,style=plot.style_line,linewidth=2,color=color.yellow,title=" Moving Average Filter")
bgcolor(noisefilter<lower?color.green:noisefilter>upper?color.red:na,title="Moving Average Filter")
//Strategy Conditions
wall3= input(defval=true,title="===Strategy Conditions===",type=input.bool)
bl= input(defval=false,title="Exit at Basis Line?",type=input.bool)
nflb= input(defval=false,title="Use Moving Average Filter?",type=input.bool)

//Strategy Condition
buyEntry = crossover(source, lower)
sellEntry = crossunder(source, upper)

if (nflb?(crossover(source,lower) and noisefilter<lower): crossover(source, lower))
	strategy.entry("BBandLE", strategy.long, oca_name="BollingerBands",  comment="BBandLE")

else
	strategy.cancel(id="BBandLE")
if (nflb?(crossunder(source,lower) and noisefilter>upper): crossunder(source, lower))
	strategy.entry("BBandSE", strategy.short, oca_name="BollingerBands",  comment="BBandSE")
else
	strategy.cancel(id="BBandSE")

strategy.close_all(when=bl?crossover(source,basis) or crossunder(source,basis):crossover(source,upper) or crossunder(source,lower))
Detail
https://www.fmz.com/strategy/437659
Last Modified
2024-01-04 15:52:31
