Name
动态SMMA与SMA交叉策略Dynamic-SMMA-and-SMA-Crossover-Strategy
Author
ChaoZhang
Strategy Description
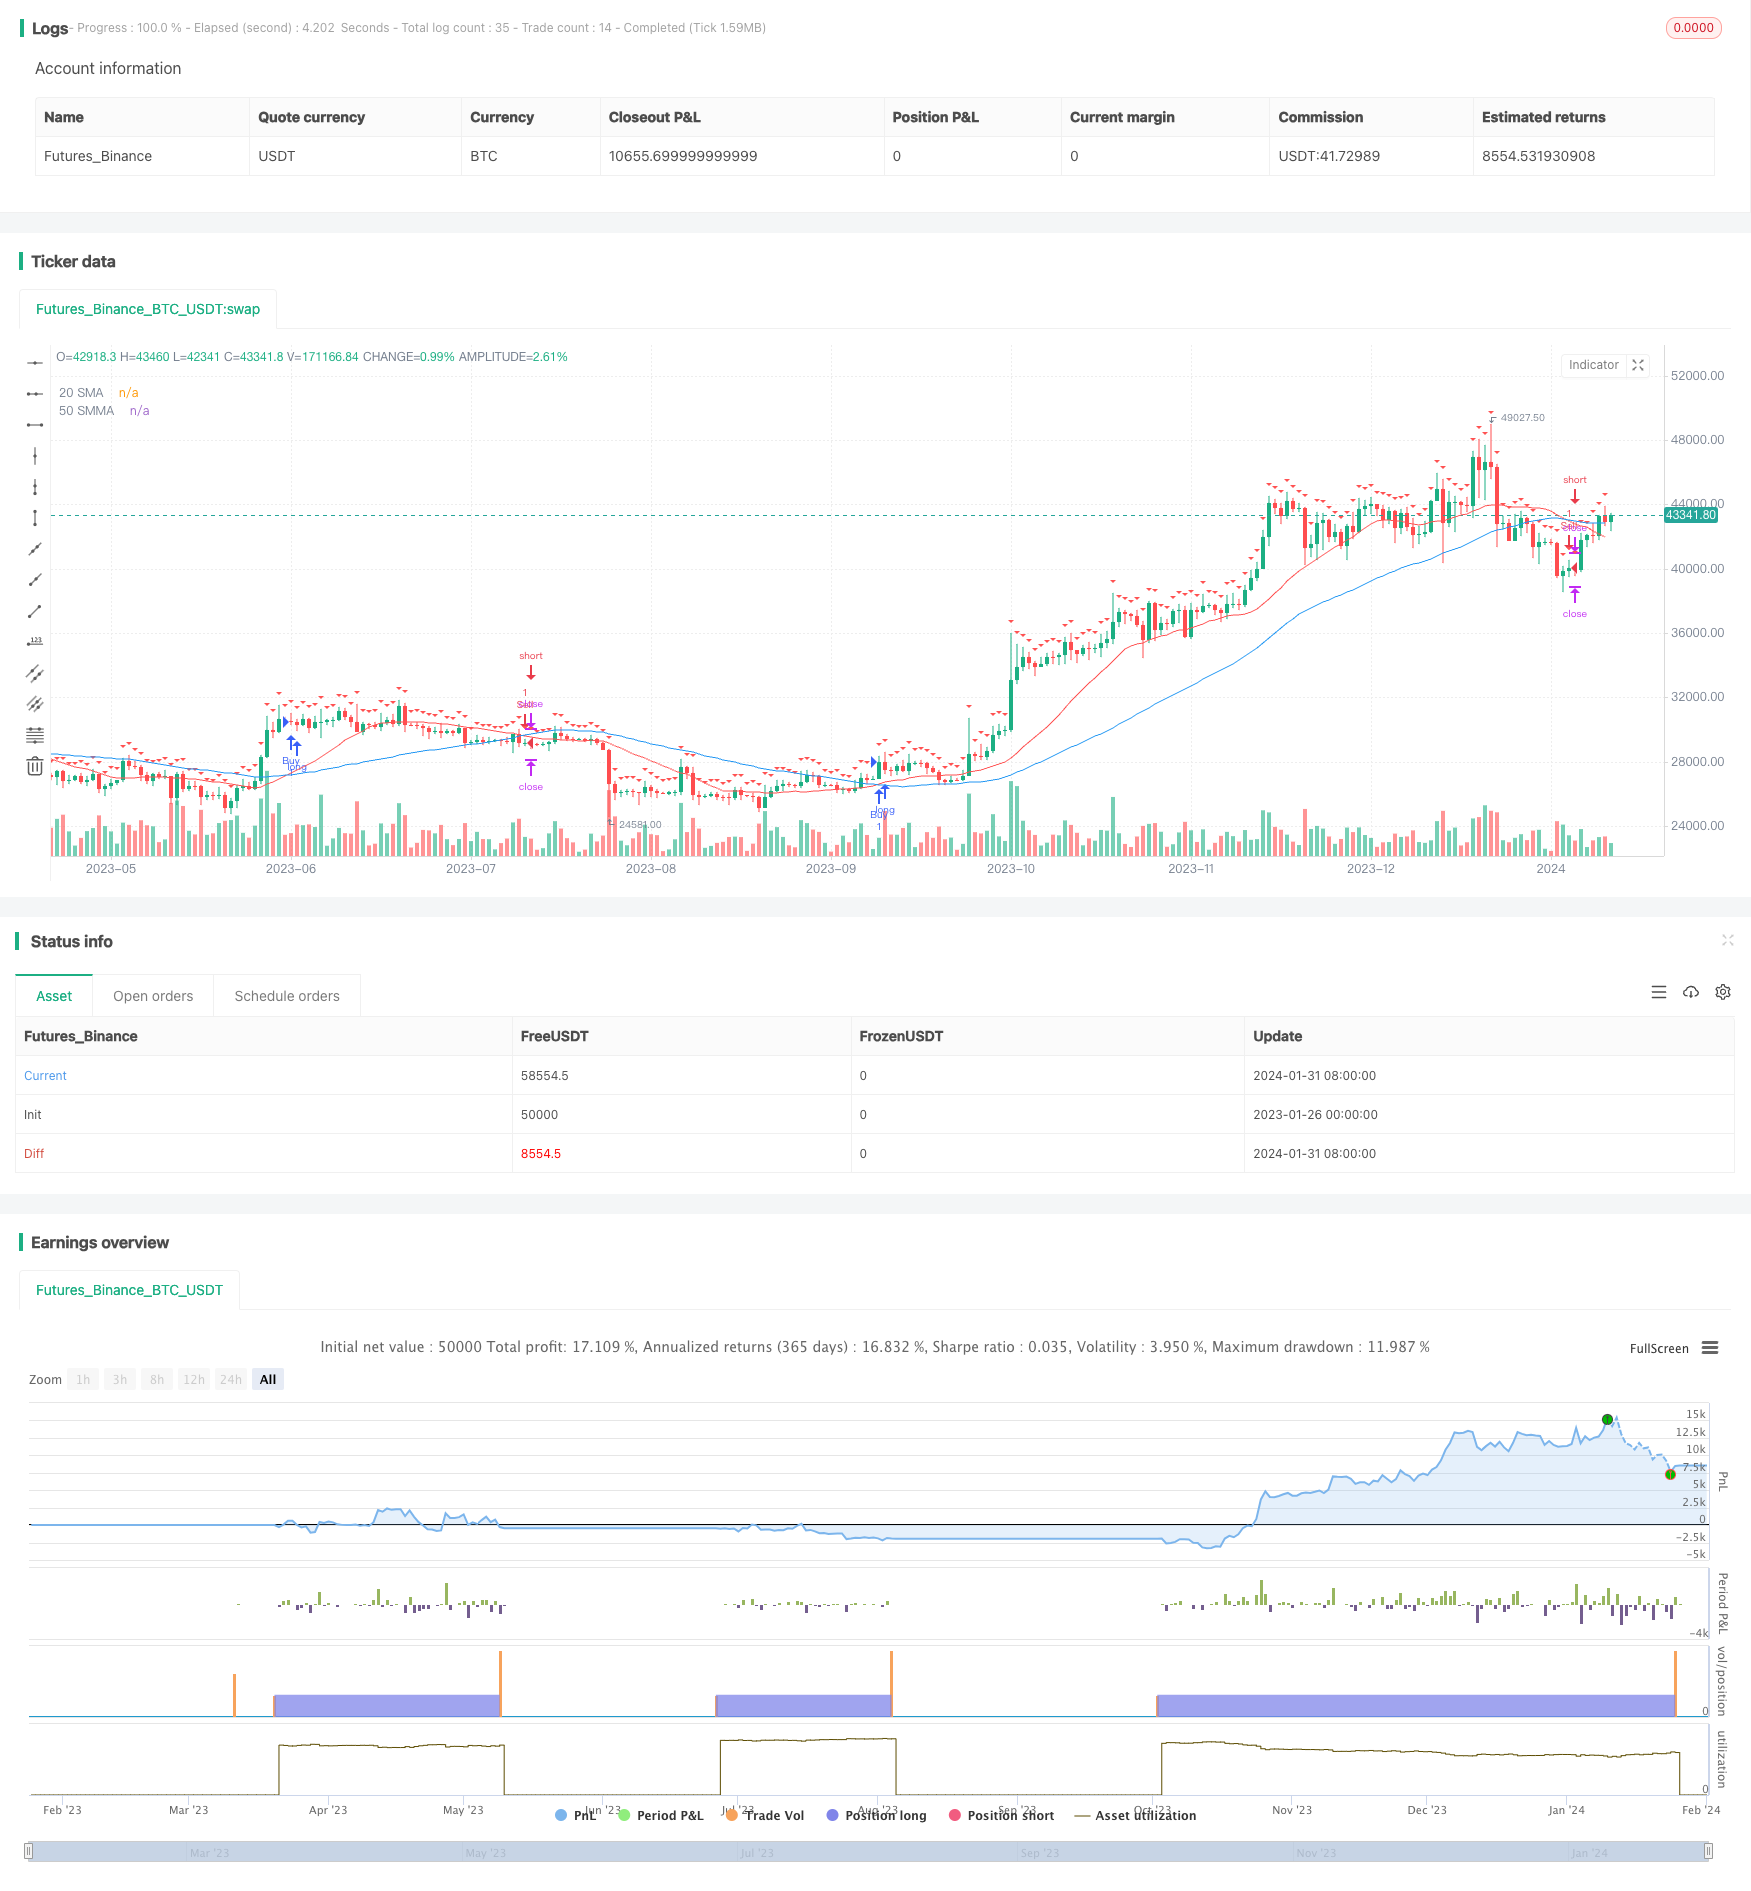
本策略运用50周期平滑移动平均线(SMMA)和20周期简单移动平均线(SMA)的交叉信号来判断买入和卖出时机。当快线SMA向上突破慢线SMMA时产生买入信号;当SMA向下跌破SMMA时产生卖出信号。同时,策略preset了固定止盈位和动态止损位来锁定利润和控制风险。
- 计算并绘制50周期SMMA和20周期SMA。
- 当SMA从下向上突破SMMA时,产生买入信号;相反,SMA从上向下突破SMMA时,产生卖出信号。
- 在买入和卖出信号发生时,分别建立"Buy"和"Sell"的仓位。
- 为每个仓位设置了固定150个点的止盈位。
- 在产生信号的下一根K线收盘价设置动态止损位。
- 如果价格触碰止盈位,则止盈;如果触碰止损位,则止损。
- 双均线策略容易操作,原理简单,容易理解。
- SMMA是对SMA的改进,能更好地抓住趋势。
- 结合不同周期的SMA和SMMA,可以在滤波震荡的同时捕捉趋势。
- 采用动态止损可以根据行情变化调整止损位置,有效控制风险。
- 预设止盈位有助于及时锁定利润。
- 双均线策略容易产生虚假信号,被套利。可以适当过滤信号,避免过于频繁交易。
- 固定止盈易错过大行情。可以设定移动止盈或盈利比例止盈。
- 动态止损在行情剧烈波动时可能会过于靠近,应适当放宽止损幅度。
- 需注意不同品种和周期参数的差异性。
1.可以测试不同参数(周期数、过滤条件等)的组合,寻找最佳参数;
2.可以结合其他因子过滤信号,例如成交量突增;
3.可以采用参数优化工具寻找最优参数;
-
可以考虑结合移动止盈、比例止盈等其他止盈方式;
-
可以结合市场波动率计算动态止损幅度。
本策略整体运行简单,通过双均线捕捉趋势方向;灵活运用固定止盈和动态止损来锁定利润和控制风险,可谓风险和收益并重。本策略可进一步通过参数和规则优化来适应更广泛的市场环境。
||
This strategy uses the crossover signals between the 50-period Smoothed Moving Average (SMMA) and 20-period Simple Moving Average (SMA) to determine entries and exits. It generates buy signals when the fast SMA line crosses above the slow SMMA line, and sell signals when the SMA crosses below the SMMA. At the same time, the strategy presets fixed take profit and dynamic stop loss levels to lock in profits and control risk.
- Calculate and plot the 50-period SMMA and 20-period SMA.
- When the SMA crosses above the SMMA from below, a buy signal is generated. Conversely, when the SMA crosses below the SMMA from above, a sell signal is generated.
- Upon buy and sell signal occurrences, establish "Buy" and "Sell" positions respectively.
- Set a fixed take profit level of 150 ticks for each position.
- Set a dynamic stop loss level at the closing price of the next bar after the signal bar.
- If price hits the take profit level, take profit occurs. If price hits stop loss level, stop loss is triggered.
- Dual moving average strategies are easy to operate with simple principles and easy to understand.
- SMMA is an improvement over SMA to better capture trends.
- Combining SMA and SMMA of different periods helps filter noise while catching trends.
- Adopting dynamic stop loss can adjust stop level based on market changes to effectively control risks.
- Preset take profit level helps lock in profits in a timely manner.
- Dual moving average strategies tend to generate false signals and be whipsawed. Signal filtering can be used to avoid over-trading.
- Fixed take profit may miss strong trends. Moving take profit or profit ratio based take profit can be considered.
- Dynamic stop loss may get too close to market price in volatile conditions. Appropriate widening of stop loss range should be considered.
- Differences across products and timeframes need attention.
-
Test combinations of different parameters (cycle periods, filter criteria etc) to find optimal.
-
Incorporate other factors like volume spikes to filter signals.
-
Employ parameter optimization tools to find optimum parameters.
-
Consider integrating other take profit methods like trailing stop or profit ratio based exits.
-
Calculate dynamic stop loss range based on market volatility.
This strategy has relatively simple logic, capturing trend directions via dual moving averages. Flexible usage of fixed take profit and dynamic stop loss for profit taking and risk control strikes a balance between risk and reward. Further parameter and logic optimization can adapt this strategy to a wider range of market conditions.
[/trans]
Source (PineScript)
/*backtest
start: 2023-01-26 00:00:00
end: 2024-02-01 00:00:00
period: 1d
basePeriod: 1h
exchanges: [{"eid":"Futures_Binance","currency":"BTC_USDT"}]
*/

//@version=4
strategy("50 SMMA and 20 SMA Crossover with TP and SL", overlay=true)

// Define 50 SMMA
smma50 = sma(close, 50)

// Define 20 SMA
sma20 = sma(close, 20)

// Plotting the SMMA and SMA
plot(smma50, color=color.blue, title="50 SMMA")
plot(sma20, color=color.red, title="20 SMA")

// Initialize TP and SL variables
tp = 150
var float sl_price = na

// Buy Signal
buySignal = crossover(sma20, smma50)
strategy.entry("Buy", strategy.long, when = buySignal)
strategy.exit("Take Profit/Stop Loss", from_entry="Buy", profit=tp, loss=sl_price)

// Sell Signal
sellSignal = crossunder(sma20, smma50)
strategy.entry("Sell", strategy.short, when = sellSignal)
strategy.exit("Take Profit/Stop Loss", from_entry="Sell", profit=tp, loss=sl_price)

// Update stop loss level on every crossover
if (buySignal or sellSignal)
    sl_price := close[bar_index + 1]

// Plot Stop Loss level
plotshape(series=sl_price != na, title="Stop Loss Level", location=location.abovebar, color=color.red, style=shape.triangledown, size=size.small)
Detail
https://www.fmz.com/strategy/440810
Last Modified
2024-02-02 11:38:08
