Name
动态支撑阻力回测策略Dynamic-Pivot-Point-Backtest-Strategy
Author
ChaoZhang
Strategy Description
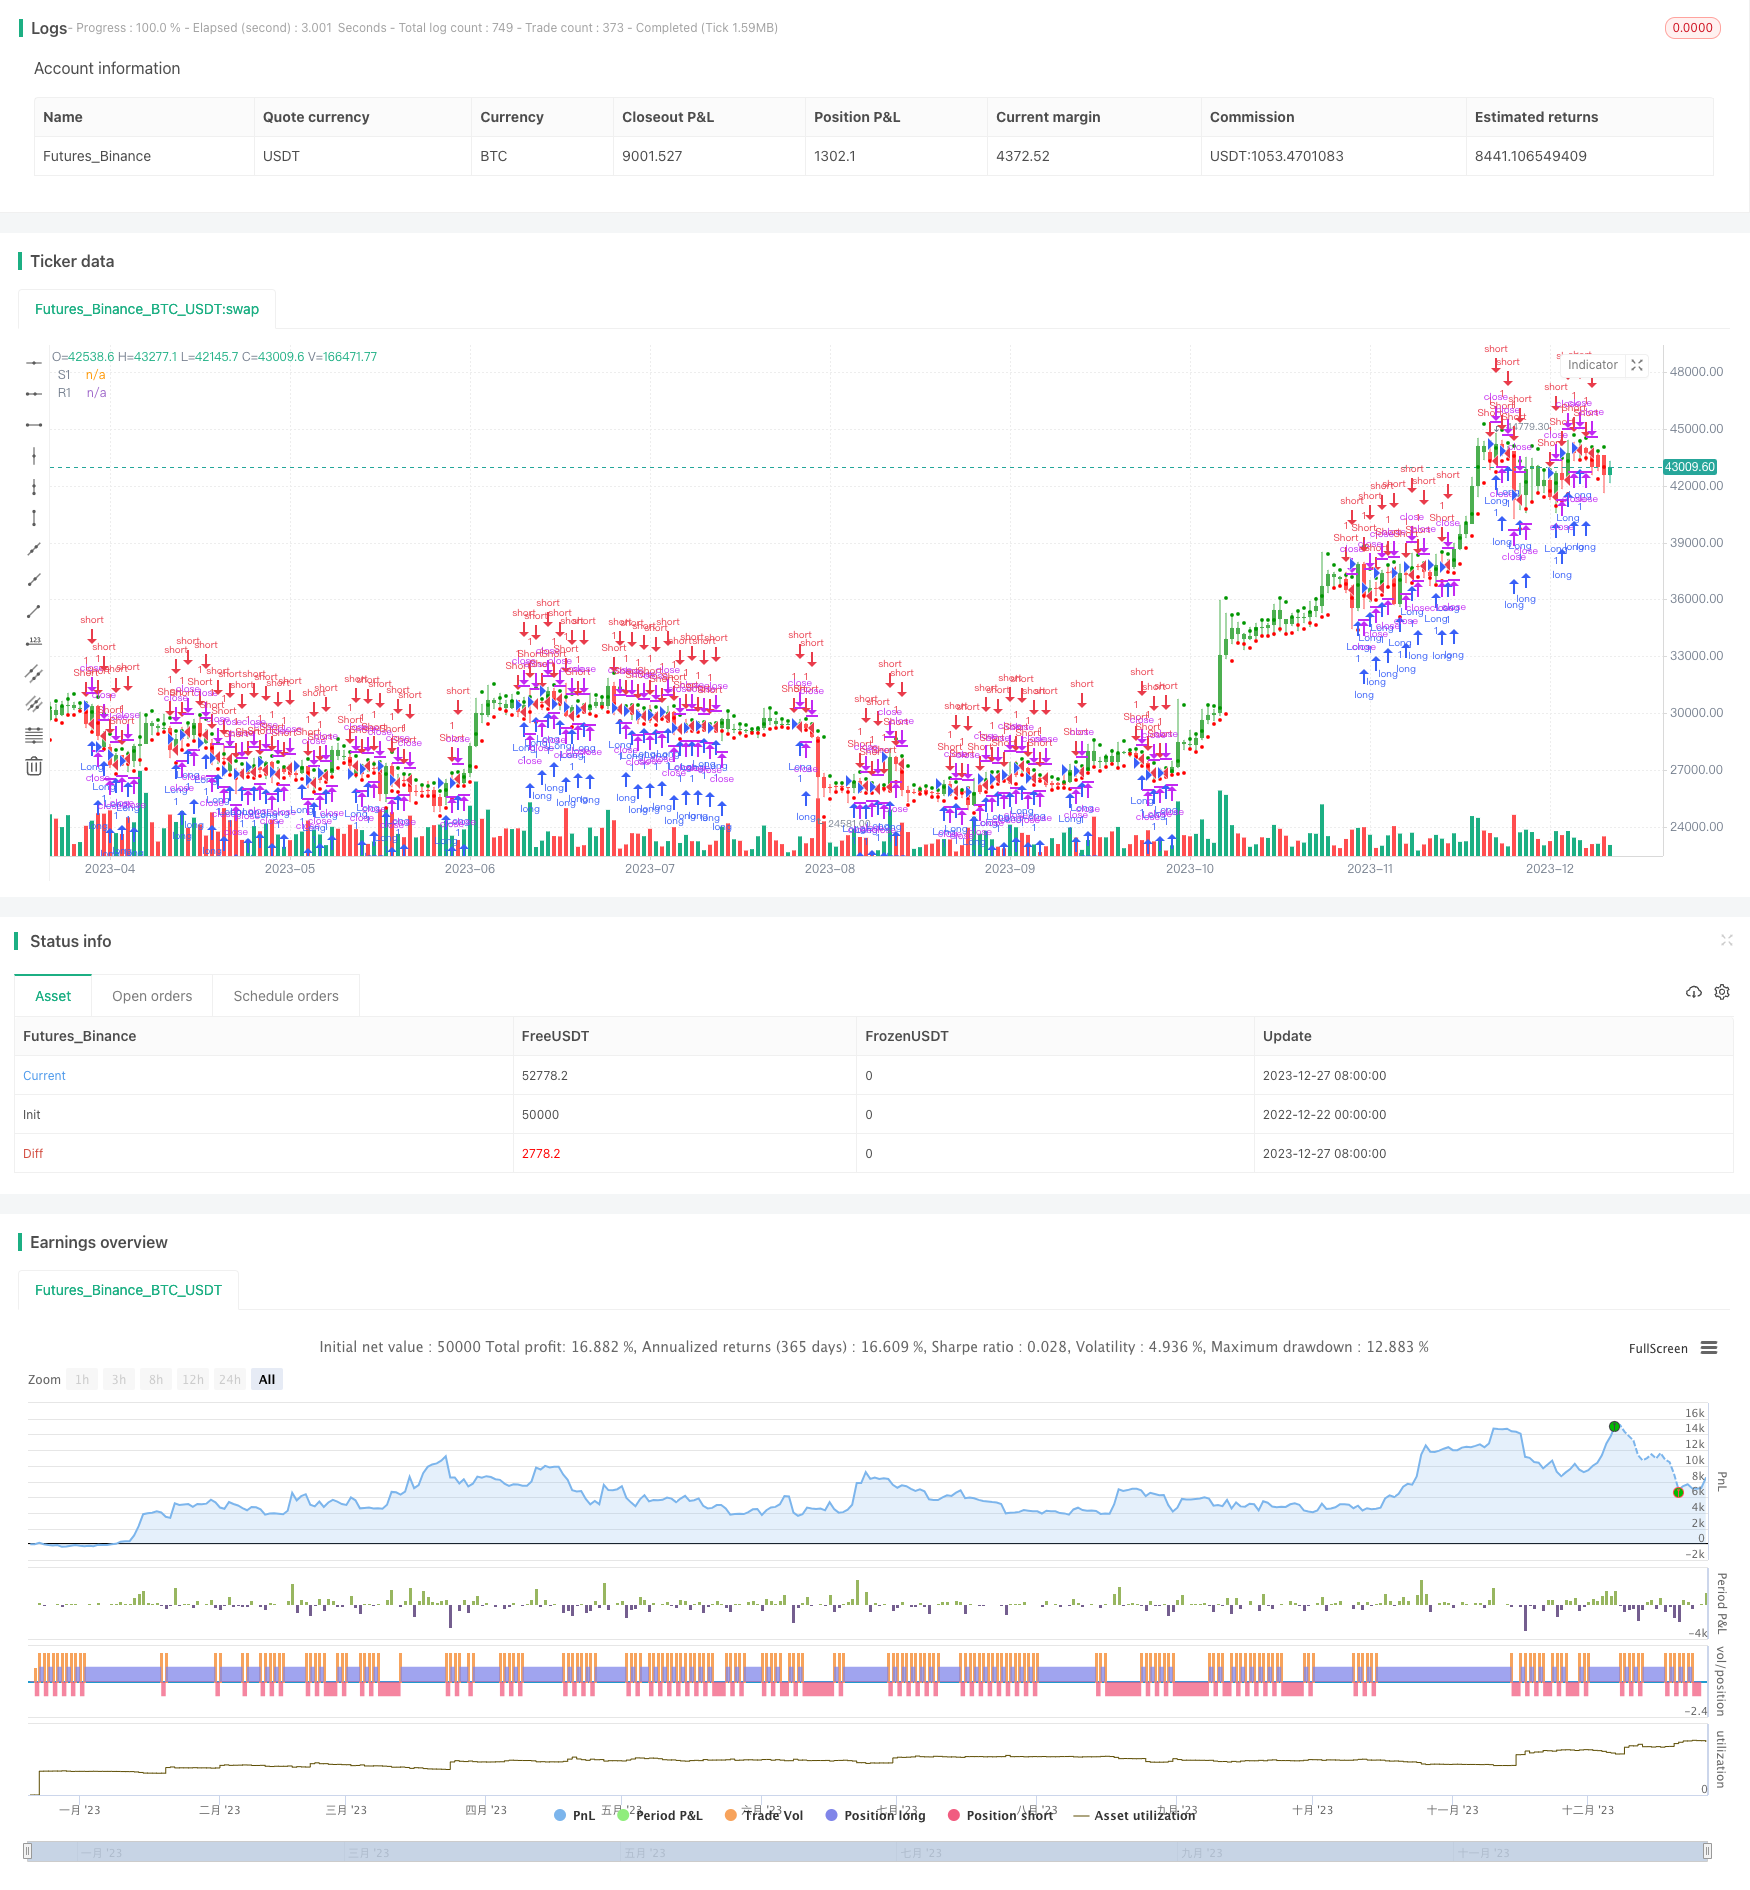
本策略基于前一交易日的最高价、最低价和收盘价计算出的支撑阻力位,在当前交易日进行长仓或短仓的操作。当价格突破上方阻力位R1时,做多;当价格跌破下方支撑位S1时,做空。该策略属于动态支撑阻力策略。
-
根据前一交易日的最高价xHigh、最低价xLow和收盘价xClose计算出当日的支撑位S1、阻力位R1和枢轴点vPP。
vPP = (xHigh+xLow+xClose) / 3
vR1 = vPP+(vPP-xLow)
vS1 = vPP-(xHigh - vPP)
-
判断价格是否突破vR1或者vS1,如果突破vR1则做多,如果跌破vS1则做空。POS记录做多做空方向。
pos = iff(close > vR1, 1,
iff(close < vS1, -1, nz(pos[1], 0))) -
possig记录实际交易方向。如果开启反转交易reverse=true,则交易信号取反。
-
根据possig信号,在突破vR1时做多,突破vS1时做空。
- 该策略利用动态支撑阻力指标,能够捕捉突破性行情。
- 支撑阻力位每日更新,具有动态性。
- 可以选择正向交易或反转交易,适用于不同市场环境。
- 策略思路简单清晰,容易理解实现。
- 可视化展示支撑阻力位,直观判断趋势发生转折。
- 若行情震荡,可能触发多次不必要的买卖信号。
- 若出现异常趋势性行情,支撑阻力可能被突破后继续延伸,造成损失。
- 枢轴点及支撑阻力位计算方法较为简单,有待进一步优化。
风险解决方法:
- 适当调整持仓规模,控制单笔损失。
- 设置止损位,避免超出可承受损失。
- 结合其它指标过滤信号,避免在震荡行情中频繁交易。
- 优化支撑阻力位的计算方法,使其更具有预测性。
- 增加对趋势、Momentum等指标的结合,避免不必要的交易。
- 增加止损策略,控制单笔及最大损失。
- 结合机器学习方法,使支撑阻力位计算能够动态优化。
本策略基于动态支撑阻力指标,根据价格突破的方向进行持仓。策略思路简单,易于理解和实现,能够有效捕捉趋势的转折点。但也存在一定的风险,需要进一步结合其它指标进行优化,使交易信号更加准确可靠。总的来说,该策略适合用作辅助判断指标,或作为量化交易的基础策略之一。
||
This strategy makes long or short positions based on the support and resistance levels calculated from the highest, lowest and closing prices of the previous trading day. It goes long when the price breaks through the upper resistance level R1 and goes short when the price breaks through the lower support level S1. The strategy belongs to the dynamic pivot point strategy.
-
Calculate the support level S1, resistance level R1 and pivot point vPP of the current day based on the highest price xHigh, lowest price xLow and closing price xClose of the previous trading day.
vPP = (xHigh+xLow+xClose) / 3
vR1 = vPP+(vPP-xLow)
vS1 = vPP-(xHigh - vPP)
-
Determine if the price breaks through vR1 or vS1. Go long if the price breaks through vR1 and go short if the price breaks below vS1. POS records the long or short direction.
pos = iff(close > vR1, 1, iff(close < vS1, -1, nz(pos[1], 0)))
-
possig records the actual trading direction. If reverse trading is enabled with reverse=true, the trading signal is reversed.
-
Go long when vR1 is broken and go short when vS1 is broken according to the possig signal.
- The strategy utilizes dynamic support and resistance levels to capture trending moves.
- The support and resistance levels are updated daily, making them dynamic.
- Both long and short trades are configurable to suit different market environments.
- The strategy logic is simple and clean for easy understanding and implementation.
- Visualizations of support and resistance levels allow intuitive trend change detection.
- Unnecessary buy and sell signals may be triggered if the market is ranging.
- If extreme trending moves occur, the broken support/resistance may extend continuously resulting in losses.
- The pivot point and support/resistance calculation is simple and needs further optimization.
Risk Management:
- Adjust position sizing to limit single trade loss.
- Set stop loss to prevent losses exceeding maximum tolerable amount.
- Add filters based on other indicators to avoid over-trading in ranging markets.
- Optimize support and resistance calculation to improve predictability.
- Incorporate trend and momentum indicators to avoid unnecessary trades.
- Add stop loss strategy to control single and maximum losses.
- Utilize machine learning to dynamically optimize support/resistance levels.
This strategy makes long or short trades based on price breaking dynamic support and resistance levels. The logic is simple to understand and implement while being able to effectively identify trend reversals. However, risks exist and further optimizations with additional indicators are needed to generate more reliable trading signals. Overall, the strategy serves well as an assistive indicator or a basic building block in quantitative trading systems.
[/trans]
Strategy Arguments
| Argument | Default | Description |
|---|---|---|
| v_input_1 | false | Trade reverse |
Source (PineScript)
//@version=2
////////////////////////////////////////////////////////////
//  Copyright by HPotter v1.0 14/06/2018
// This Pivot points is calculated on the current day.
// Pivot points simply took the high, low, and closing price from the previous period and
// divided by 3 to find the pivot. From this pivot, traders would then base their
// calculations for three support, and three resistance levels. The calculation for the most
// basic flavor of pivot points, known as ‘floor-trader pivots’, along with their support and
// resistance levels.
//
// You can change long to short in the Input Settings
// WARNING:
// - For purpose educate only
// - This script to change bars colors.
////////////////////////////////////////////////////////////
strategy(title="Dynamic Pivot Point Backtest", shorttitle="Dynamic Pivot Point", overlay = true)
reverse = input(false, title="Trade reverse")
xHigh  = request.security(syminfo.tickerid,"D", high[1])
xLow   = request.security(syminfo.tickerid,"D", low[1])
xClose = request.security(syminfo.tickerid,"D", close[1])
vPP = (xHigh+xLow+xClose) / 3
vR1 = vPP+(vPP-xLow)
vS1 = vPP-(xHigh - vPP)
pos = iff(close > vR1, 1,
       iff(close < vS1, -1, nz(pos[1], 0)))
possig = iff(reverse and pos == 1, -1,
          iff(reverse and pos == -1, 1, pos))
if (possig == 1)
    strategy.entry("Long", strategy.long)
if (possig == -1)
    strategy.entry("Short", strategy.short)
barcolor(possig == -1 ? red: possig == 1 ? green : blue )
plot(vS1, color=#ff0000, title="S1", style = circles, linewidth = 1)
plot(vR1, color=#009600, title="R1", style = circles, linewidth = 1)
Detail
https://www.fmz.com/strategy/437018
Last Modified
2023-12-29 15:50:57
