Name
低买高卖的动量交易策略-Momentum-Breakout-Strategy
Author
ChaoZhang
Strategy Description
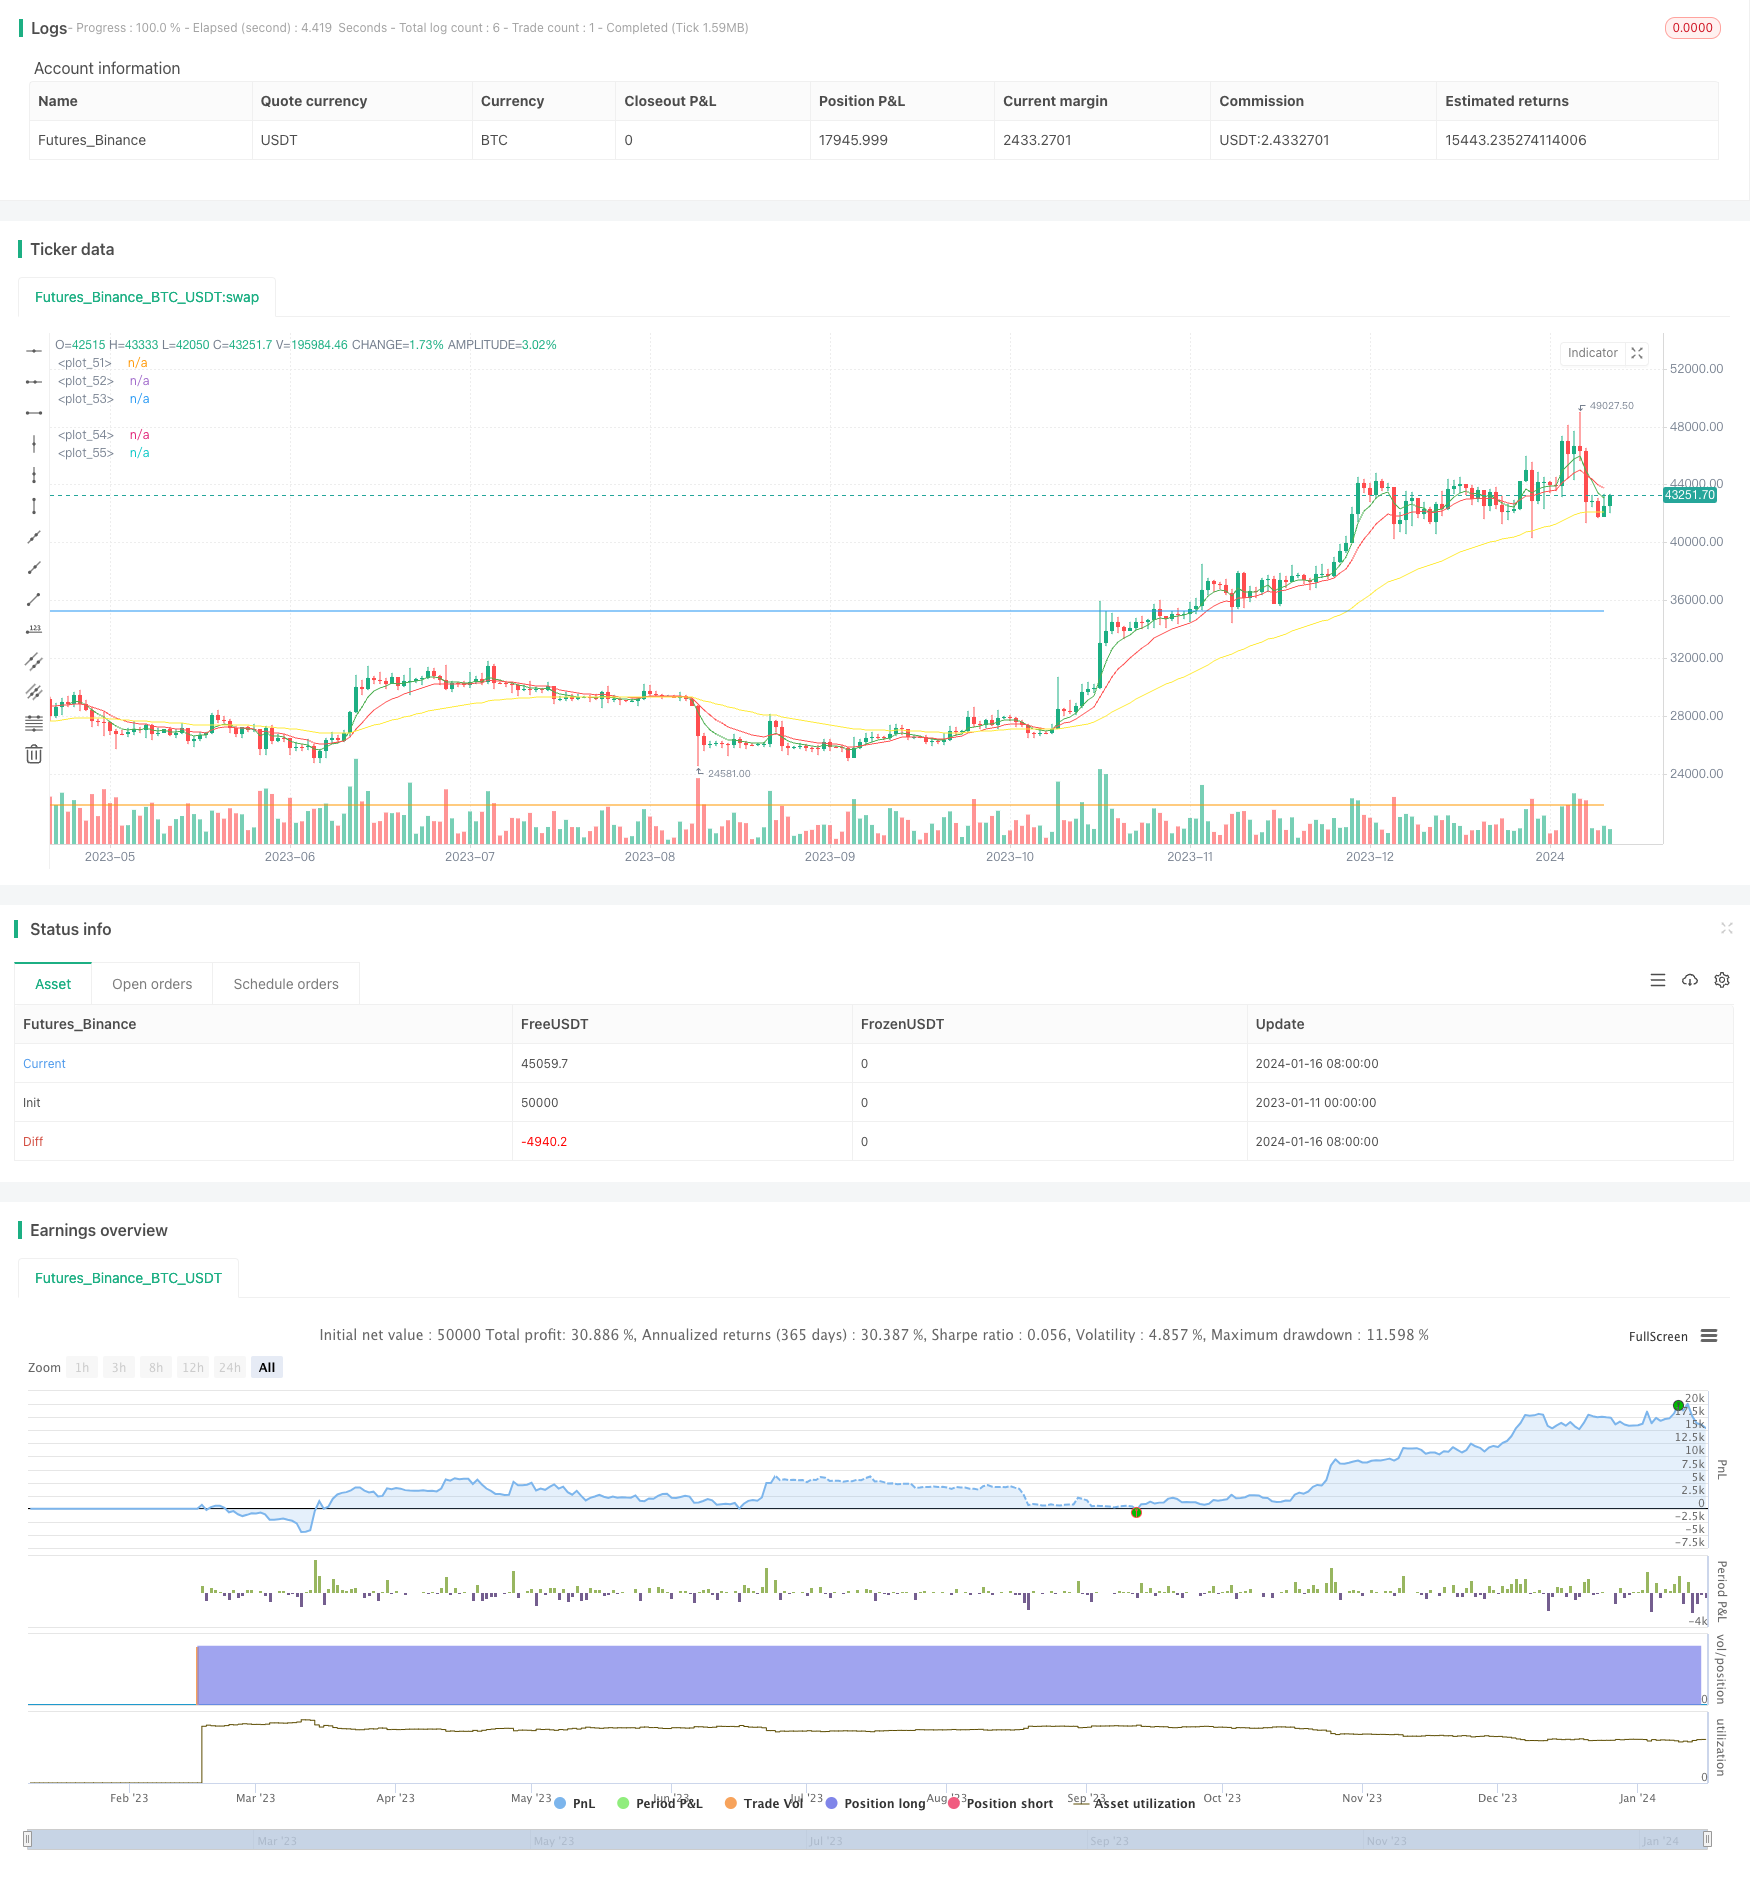
本策略通过计算EMA均线、MACD指标以及单日涨幅,综合判断市场的突破信号,实现低买高卖的动量交易策略。
当快速EMA线上穿慢速EMA线时,视为市场处于上升趋势,产生买入信号;当MACD指标的差离值上穿0轴时,也产生买入信号,实现策略的多头开仓。
另外,如果单日收盘价相比开盘价上涨超过10%,也会产生买入信号,追捧市场中的突破行情。
在开仓后,如果价格下跌幅度超过10%,则止损;如果盈利达到45%则止盈。
这是一个典型的趋势跟踪策略,能够抓住市场中力度突破后的上涨行情,盈利潜力较大。具体优势如下:
- 使用EMA均线实现了趋势判断,避免在震荡市场中错误开仓
- MACD指标确保买入信号更加可靠
- 单日涨幅条件可以抓住行情爆发点
- 止损止盈设置合理,可以很好控制风险
尽管该策略设计合理,但仍有一定的风险需要应对:
- 突破信号判断如果不当,可能产生空头损失
- 市场止跌反弹时,也会产生错误信号
- 止损点设置过大,亏损风险增加
- 突破后如果没有足够的后续行情支撑,可能止盈不足
为降低上述风险,可以考虑优化移动止损策略,或结合其他指标如成交量进行信号过滤。
该策略还有进一步优化的空间:
- 增加成交量指标,确保有足够的交易量支撑趋势
- 对MACD指标参数进行优化,提高指标敏感度
- 测试不同的EMA周期参数组合
- 增加自适应止损机制
- 优化止盈点,实现更高效率的现金管理
通过参数调整、指标组合等方法进一步完善,可以大幅提升策略的稳定性和盈利能力。
本策略整体来说,具有简单实用、盈利潜力大的特点。通过对市场突破点的判断,能够有效抓住行情上涨趋势,回撤控制也比较合理。在后续的策略优化中,继续推动参数调整、止损止盈设计的改进,使其成为一个值得长期应用的量化交易策略。
||
This strategy combines EMA lines, MACD indicator and single-day gain to identify market breakthrough signals and implement a momentum trading strategy to buy low and sell high.
When the fast EMA line crosses over the slow EMA line, it is considered that the market is in an upward trend and a buy signal is generated. When the difference of MACD indicator crosses over the 0 axis, a buy signal is also generated to open long positions.
In addition, if the close price of a single day rises more than 10% compared to the open price, a buy signal will also be generated to chase the breaking market trend.
After opening positions, if the price falls more than 10%, stop loss will be triggered. If the profit reaches 45%, take profit will be triggered.
This is a typical trend following strategy that can capture the uptrend after a strong momentum breakthrough, with great profit potential. The main advantages are:
- EMA lines implement trend judgment to avoid opening positions during market consolidation.
- MACD indicator ensures more reliable buy signals.
- Single day gain condition captures trend outbreak.
- Reasonable stop loss and take profit settings help control risks.
Although reasonably designed, some risks still exist:
- Improper breakthrough signal judgment may lead to short losses.
- Market rebound may also generate false signals.
- Oversize stop loss setting increases loss risk.
- Insufficient follow-up trend after breakthrough may lead to insufficient profit.
To reduce the above risks, we can consider optimizing the moving stop loss strategy or adding other indicators like volume to filter signals.
There is still room for further optimization:
- Add volume indicator to ensure enough trading volume supporting the trend.
- Optimize MACD parameters to improve indicator sensitivity.
- Test different combinations of EMA periods.
- Add adaptive stop loss mechanism.
- Optimize take profit points for more efficient money management.
Through parameter tuning, indicator combination and other methods, the stability and profitability of this strategy can be greatly improved.
In general, this strategy is simple, practical and with great profit potential. By judging market breakthrough points, it can effectively capture uptrends, and the drawdown control is also reasonable. In future optimization, continuingly improving parameter adjustment and stop loss/take profit design can make it a worthwhile long-term quantitative trading strategy.
[/trans]
Strategy Arguments
| Argument | Default | Description |
|---|---|---|
| v_input_1 | 5 | fastLength |
| v_input_2 | 12 | slowLength |
| v_input_3 | 50 | baseLength |
| v_input_4 | 9 | MACDLength |
| v_input_5 | 12 | MACDfast |
| v_input_6 | 26 | MACDslow |
| v_input_7 | 10 | Gain % |
| v_input_8 | 10 | Stop Loss % |
| v_input_9 | 45 | Profit % |
Source (PineScript)
/*backtest
start: 2023-01-11 00:00:00
end: 2024-01-17 00:00:00
period: 1d
basePeriod: 1h
exchanges: [{"eid":"Futures_Binance","currency":"BTC_USDT"}]
*/

//@version=3
strategy("Alt Coins", overlay=true)

//Simple Alt Coin Trading Strategy//
// by @ShanghaiCrypto //

////EMA////
fastLength = input(5)
slowLength = input(12)
baseLength = input(50)
price = close

emafast = ema(price, fastLength)
emaslow = ema(price, slowLength)
emabase = ema(price, baseLength)

///MACD////
MACDLength = input(9)
MACDfast = input(12)
MACDslow = input(26)
MACD = ema(close, MACDfast) - ema(close, MACDslow)
aMACD = ema(MACD, MACDLength)
delta = MACD - aMACD

////PUMP////
OneCandleIncrease = input(10, title='Gain %')
pump = OneCandleIncrease/100

////Profit Capture and Stop Loss//////
stop = input(10.0, title='Stop Loss %', type=float)/100
profit = input(45.0, title='Profit %', type=float)/100
stop_level = strategy.position_avg_price * (1 - stop)
take_level = strategy.position_avg_price * (1 + profit)

////Entries/////
if crossover(emafast, emaslow)
    strategy.entry("Cross", strategy.long, comment="BUY")

if (crossover(delta, 0))
    strategy.entry("MACD", strategy.long, comment="BUY")

if close > (open + open*pump)
    strategy.entry("Pump", strategy.long, comment="BUY")

/////Exits/////
strategy.exit("SELL","Cross", stop=stop_level, limit=take_level)
strategy.exit("SELL","MACD", stop=stop_level, limit=take_level)
strategy.exit("SELL","Pump", stop=stop_level, limit=take_level)

////Plots////
plot(emafast, color=green)
plot(emaslow, color=red)
plot(emabase, color=yellow)
plot(take_level, color=blue)
plot(stop_level, color=orange)
Detail
https://www.fmz.com/strategy/439229
Last Modified
2024-01-18 15:17:11
