Name
三重BB-bands闭合突破与RSI指标的组合交易策略Triple-BB-Bands-Breakout-with-RSI-Strategy
Author
ChaoZhang
Strategy Description
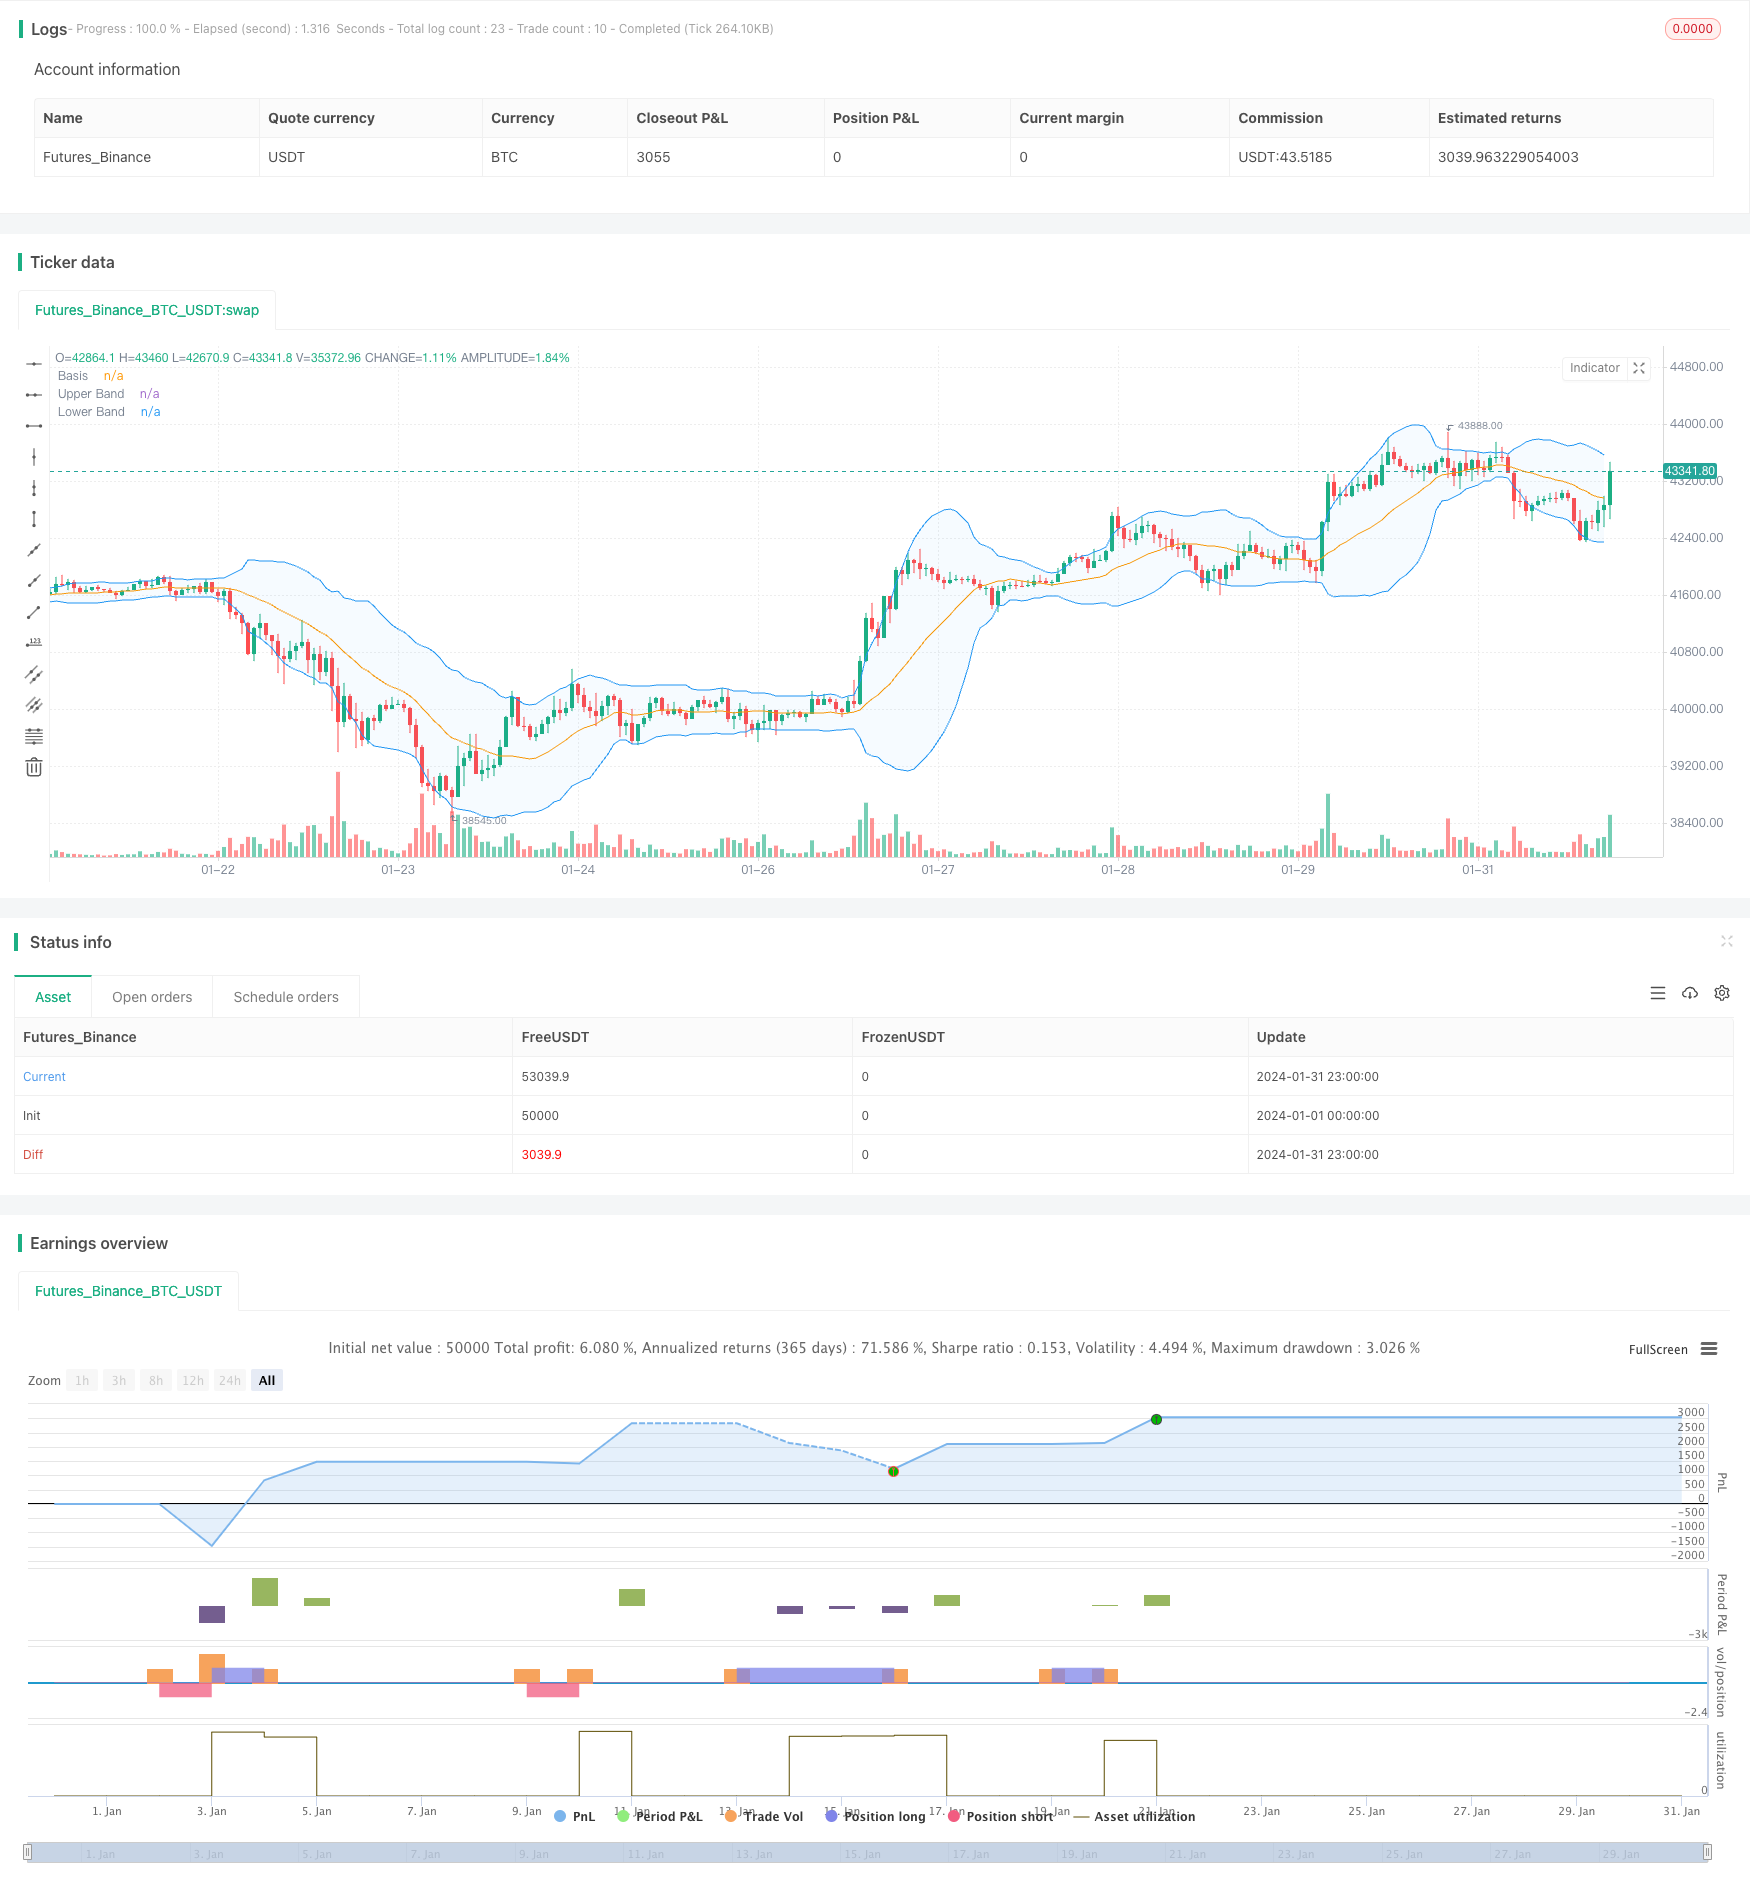
该策略通过组合使用布林带指标和相对强弱指数RSI指标来进行交易信号的生成。它监测三根K线的收盘价是否同时突破上轨或下轨,并结合涡轮指标和RSI指标来确认交易信号。
该策略主要基于以下原理:
- 使用长度为20的布林带,当价格收盘突破上轨或下轨时,考虑发出交易信号
- 要求三根K线的收盘价同时突破,避免假突破
- 结合涡轮指标,强势超买时VIP>1.25,强势超卖时VIM>1.25,过滤信号
- 结合RSI指标判断是否超买超卖,RSI上穿70考虑做空,RSI下穿30考虑做多
- 当满足上述条件时,产生做多或做空信号
该策略主要有以下优势:
- 三重BB bands过滤假突破,确保突破的可靠性
- 涡轮指标判断市场实力,避免不利行情的交易
- RSI指标判断超买超卖区域,结合布林带指标进行入场
- 多种指标组合,综合判断市场情况,信号可靠性较高
该策略也存在一些风险:
- 布林带指标对参数很敏感,需要优化长度和 StdDev 倍数
- 涡轮指标对周期参数也较为敏感,不同市场需要调整
- RSI指标容易产生背离,也可能错过趋势
- 若三指标判断产生分歧,则无法入场,会错过部分机会
风险控制措施包括:
- 优化参数,tested取胜率最高的参数
- 结合其他指标,例如交易量过滤
- 适当放宽指标判断逻辑,防止错失良机
该策略可从以下几个方面进行优化:
- 对布林带指标的长度和StdDev倍数进行优化,找到最佳参数
- 对涡轮指标的周期进行优化,使其更符合不同市场
- 增加其他指标判断,例如交易量、macd等,丰富多元化信号
- 调整指标判断逻辑,防止指标分歧导致无法入场
- 增加止损策略,以控制单笔交易的最大损失
该策略综合运用多种指标进行判断,在确保信号可靠性的同时,也存在一定问题。通过参数优化、丰富信号来源、调整判断逻辑以及止损等手段,可以进一步增强策略的稳定性和盈利能力。它为量化交易提供了一个很好的思路。
||
This strategy combines Bollinger Bands and RSI indicators to generate trading signals. It monitors whether the closing prices of three candlesticks break through the upper or lower bands at the same time, and combines the Vortex indicator and RSI indicator to confirm trading signals.
The strategy is mainly based on the following principles:
- Use 20-period Bollinger Bands, consider issuing trading signals when prices break through the upper or lower bands on close
- Require three candlesticks to break through at the same time to avoid false breakouts
- Combine the Vortex indicator, when strongly overbought VIP>1.25, when strongly oversold VIM>1.25, filter out signals
- Combine the RSI indicator to determine overbought and oversold, consider going short when RSI breaks through 70, and consider going long when RSI breaks through 30
- When the above conditions are met, long and short signals are generated
The main advantages of this strategy are:
- Triple BB bands filter out false breakouts and ensure the reliability of breakouts
- The Vortex indicator judges the strength of the market and avoids unfavorable trading in the market
- The RSI indicator judges the overbought and oversold area, combined with the Bollinger Bands indicator for entry
- The combination of multiple indicators comprehensively judges the market situation, and the signal reliability is relatively high
The strategy also has some risks:
- Bollinger Bands indicator is very sensitive to parameters, length and StdDev multiplier need to be optimized
- The Vortex indicator is also quite sensitive to the cycle parameter, which needs to be adjusted for different markets
- The RSI indicator is prone to divergence and may also miss trends
- If there is disagreement in the judgment of the three indicators, it will be impossible to enter, missing some opportunities
Risk control measures include:
- Optimize parameters and use parameters with the highest win rate in backtesting
- Combine other indicators, such as trading volume filtering
- Appropriately relax the indicator judgment logic to prevent missing good opportunities
The strategy can be optimized in the following aspects:
- Optimize the length and StdDev multiplier of Bollinger Bands to find the optimal parameters
- Optimize the cycle of the Vortex indicator to make it more suitable for different markets
- Increase other indicators’ judgment, such as trading volume, macd, etc., to enrich diversified signals
- Adjust indicator judgment logic to prevent inability to enter due to indicator divergence
- Increase stop loss strategy to control maximum loss per trade
This strategy combines multiple indicators for judgment. While ensuring signal reliability, it also has some problems. Through parameter optimization, enriched signal sources, adjusted judgment logic and stop loss, etc., the stability and profitability of the strategy can be further enhanced. It provides a good idea for quantitative trading.
[/trans]
Strategy Arguments
| Argument | Default | Description |
|---|---|---|
| v_input_1 | 20 | Length |
| v_input_2 | 2 | Multiplier |
| v_input_int_1 | 14 | Period |
| v_input_3 | 14 | RSI Length |
| v_input_4 | 70 | Overbought Level |
| v_input_5 | 30 | Oversold Level |
Source (PineScript)
/*backtest
start: 2024-01-01 00:00:00
end: 2024-01-31 23:59:59
period: 1h
basePeriod: 15m
exchanges: [{"eid":"Futures_Binance","currency":"BTC_USDT"}]
*/

// This Pine Script™ code is subject to the terms of the Mozilla Public License 2.0 at https://mozilla.org/MPL/2.0/
// © Noway0utstorm

//@version=5
strategy(title='RSI + BB  over 3 bar+--- vortex0.71.3  ', shorttitle='NoWaytruongphuthinh', format=format.price, precision=4,overlay = true)

length = input(20, title="Length")
mult = input(2.0, title="Multiplier")
source = close

basis = ta.sma(source, length)
dev = mult * ta.stdev(source, length)

upperBand = basis + dev
lowerBand = basis - dev

isClosedBar = ta.change(time("15"))

var bool closeAboveUpperBand = false
var bool closeBelowLowerBand = false


// Vortex Indicator Settings
period_ = input.int(14, title='Period', minval=2)

VMP = math.sum(math.abs(high - low[1]), period_)
VMM = math.sum(math.abs(low - high[1]), period_)
STR = math.sum(ta.atr(1), period_)
VIP = VMP / STR
VIM = VMM / STR

//
lengthrsi = input(14, title="RSI Length")
overboughtLevel = input(70, title="Overbought Level")
oversoldLevel = input(30, title="Oversold Level")

sourcersi = close
rsiValue = ta.rsi(sourcersi, lengthrsi)

shouldShort = rsiValue > overboughtLevel
shouldLong = rsiValue < oversoldLevel


if bool(isClosedBar[1]) and bool(isClosedBar[2]) and bool(isClosedBar[3])

    if close[1] > upperBand[1] and close[2] > upperBand[2] and close[3] > upperBand[3] and VIP > 1.25 and VIM < 0.7 and rsiValue > overboughtLevel
        strategy.entry("Short", strategy.short)
        closeAboveUpperBand := false  // Reset the condition when entering a new Short position
    if close[1] < lowerBand[1] and close[2] < lowerBand[2] and close[3] < lowerBand[3] and VIP < 0.7 and VIM > 1.25 and rsiValue < oversoldLevel
        strategy.entry("Long", strategy.long)
        closeBelowLowerBand := false  // Reset the condition when entering a new Long position


if strategy.position_size > 0  // Check if there is an open Long position
    closeAboveUpperBand := close > upperBand  // Update the condition based on close price
    if closeAboveUpperBand
        strategy.close("Long",disable_alert=true)  // Close the Long position if close price is above upper band

if strategy.position_size < 0  // Check if there is an open Short position
    closeBelowLowerBand := close < lowerBand  // Update the condition based on close price
    if closeBelowLowerBand
        strategy.close("Short",disable_alert=true)  // Close the Short position if close price is below lower band

// Plots
plot(basis, color=color.orange, title="Basis")
p1 = plot(upperBand, color=color.blue, title="Upper Band")
p2 = plot(lowerBand, color=color.blue, title="Lower Band")
fill(p1, p2, title = "Background", color=color.rgb(33, 150, 243, 95))
Detail
https://www.fmz.com/strategy/443138
Last Modified
2024-02-29 14:57:49