This usecase describe how to run MiXeR analysis (http://github.com/precimed/mixer) on real summary statistics:
schizophrenia (SCZ) and intelligence (INT). All commands below assume that $COMORMENT environmental is defined as described in Getting started section of the main README file, and $SINGULARITY_BIND and $SIF variables are defined as follows:
export SINGULARITY_BIND=$COMORMENT/mixer/reference:/REF
export SIF=$COMORMENT/mixer/singularity
Firts, let's take a look at the columns available in the summary statistics. INT GWAS has all required columns, but they need to be renamed. SCZ GWAS lacks SNP rs#, z-score and sample size. In this case, z-score can be compute from effect direction and p-value, sample size can be taken from original publication, and SNP rs# does not need to be introduced, because MiXeR can match SNPs to the reference using CHR, BP, A1 and A2 information. Note that both GWAS have clarified in the README file that A1 is effect allele. Also note there is no need to allign alleles - MiXeR will do this automatically (and also exclude ambiguous alleles, i.e. A/T and C/G). However, it's important to exclude the MHC region (chr6:26-34M).
Below we provide python scripts to re-format these particular summary statistics.
Note that a more general set of command line tools for harmonizing summary statistics
is available from https://github.com/precimed/python_convert which is already included in python3.sif container (https://github.com/comorment/containers/blob/main/docs/python3.md).
>zcat $COMORMENT/mixer/reference/sumstats/clozuk_pgc2.meta.sumstats.txt.gz | head -n 3
SNP	Freq.A1	CHR	BP	A1	A2	OR	SE	P
10:100968448:T:AA	0.3519	10	100968448	t	aa	1.0024	0.01	0.812
10:101574552:A:ATG	0.4493	10	101574552	a	atg	0.98906	0.0097	0.2585

>zcat $COMORMENT/mixer/reference/sumstats/SavageJansen_2018_intelligence_metaanalysis.txt.gz | head -n 3
SNP	UNIQUE_ID	CHR	POS	A1	A2	EAF_HRC	Zscore	stdBeta	SE	P	N_analyzed	minINFO	EffectDirection
rs12184267	1:715265	1	715265	t	c	0.0408069	0.916	0.00688729787581148	0.007518884143899	0.3598	225955	0.805386	-???????????????++?
rs12184277	1:715367	1	715367	a	g	0.9589313	-0.656	-0.00491449054466469	0.00749160144003763	0.5116	226215	0.808654	+???????????????--?

singularity exec --home $PWD:/home $SIF/mixer.sif python

import pandas as pd
import numpy as np
from scipy import stats
import os

scz = pd.read_csv('/REF/sumstats/clozuk_pgc2.meta.sumstats.txt.gz', sep='\t')
scz['N'] = 4/(1/40675 + 1/64643)  # effective sample size
scz['Z'] = -stats.norm.ppf(scz['P'].values*0.5)*np.sign(scz['OR'].values - 1).astype(np.float64)
scz['A1']=scz['A1'].str.upper()
scz['A2']=scz['A2'].str.upper()
mhc=(scz['CHR']==6) & (scz['BP']>26e6) & (scz['BP'] < 34e6)
scz.loc[~mhc, ['SNP', 'CHR', 'BP', 'A1', 'A2', 'N', 'Z']].to_csv('SCZ.sumstats', index=False, sep='\t')
os.system('gzip -f SCZ.sumstats')

int = pd.read_csv('/REF/sumstats/SavageJansen_2018_intelligence_metaanalysis.txt.gz', sep='\t')
int.rename(columns={'POS':'BP', 'Zscore':'Z', 'N_analyzed':'N'}, inplace=True)
int['A1']=int['A1'].str.upper()
int['A2']=int['A2'].str.upper()
mhc=(int['CHR']==6) & (int['BP']>26e6) & (int['BP'] < 34e6)
int.loc[~mhc, ['SNP', 'CHR', 'BP', 'A1', 'A2', 'N', 'Z']].to_csv('INT.sumstats', index=False, sep='\t')
os.system('gzip -f INT.sumstats')
The result:
>zcat SCZ.sumstats.gz | head -n 3
SNP	CHR	BP	A1	A2	N	Z
10:100968448:T:AA	10	100968448	T	AA	99863.42410604075	0.23784669541774933
10:101574552:A:ATG	10	101574552	A	ATG	99863.42410604075	-1.1299435776163629

> zcat INT.sumstats.gz | head -n 3
SNP	CHR	BP	A1	A2	N	Z
rs12184267	1	715265	T	C	225955.0	0.916
rs12184277	1	715367	A	G	226215.0	-0.656
Now you can run MiXeR using MIXER_REAL.job, which is just a slightly adjusted version of the mixer_simu/MIXER_SIMU.job used in mixer_simu.md.
Note that you don't need to generate .ld and .snps files as they are already included within the reference folder (here).
Note that each run produces a SCZ_vs_INT.fit.repN.log file, containing some useful information.
For example, inspect SCZ_vs_INT.fit.rep1.log to make sure the number of SNPs used in the analysis is reasonable:
Construct reference from 22 files...
...
Found 9997231 variants in total.
Found 6564637 variants with well-defined Z and N in SCZ.sumstats.gz. Other statistics:
       8130258 lines found (including header)
       7445470 lines matched via CHR:BP:A1:A2 code (not SNP rs#)
       684787 lines were ignored as RS# (or chr:bp:a1:a2 code) did not match reference file.
       880833 variants were ignored as they are strand-ambiguous.
       5259074 variants had flipped A1/A2 alleles; sign of z-score was flipped.
constrain analysis to 6564637 tag variants (due to trait1_file='SCZ.sumstats.gz')
Found 6869403 variants with well-defined Z and N in INT.sumstats.gz. Other statistics:
       9241349 lines found (including header)
       7729 lines matched via CHR:BP:A1:A2 code (not SNP rs#)
       1291097 lines were ignored as RS# (or chr:bp:a1:a2 code) did not match reference file.
       11 variants were ignored as they had A1/A2 alleles that do not match reference.
       1080837 variants were ignored as they are strand-ambiguous.
       3001928 variants had flipped A1/A2 alleles; sign of z-score was flipped.
constrain analysis to 5880604 tag variants (due to trait2_file='INT.sumstats.gz')
constrain analysis to 419659 tag variants (due to extract='/REF/ldsc/1000G_EUR_Phase3_plink/1000G.EUR.QC.prune_maf0p05_rand2M_r2p8.rep1.snps')
Now generate figures using these commands:
singularity shell --home $PWD:/home $SIF/mixer.sif

python /tools/mixer/precimed/mixer_figures.py combine --json [email protected]  --out SCZ.fit
python /tools/mixer/precimed/mixer_figures.py combine --json [email protected]  --out SCZ.test
python /tools/mixer/precimed/mixer_figures.py combine --json [email protected]  --out INT.fit
python /tools/mixer/precimed/mixer_figures.py combine --json [email protected]  --out INT.test
python /tools/mixer/precimed/mixer_figures.py combine --json [email protected]  --out SCZ_vs_INT.fit
python /tools/mixer/precimed/mixer_figures.py combine --json [email protected]  --out SCZ_vs_INT.test

python /tools/mixer/precimed/mixer_figures.py one --json SCZ.fit.json INT.fit.json --out SCZ_and_INT.fit --trait1 SCZ INT --statistic mean std --ext svg
python /tools/mixer/precimed/mixer_figures.py one --json SCZ.test.json INT.test.json --out SCZ_and_INT.test --trait1 SCZ INT --statistic mean std --ext svg

python /tools/mixer/precimed/mixer_figures.py two --json-fit SCZ_vs_INT.fit.json --json-test SCZ_vs_INT.test.json --out SCZ_vs_INT --trait1 SCZ --trait2 INT --statistic mean std --ext svg
These commands may produce some warnings. Pease check if figures are generated, and if so then it's safe to ignore the warnings.
Resulting files:
- SCZ_and_INT.fit.csv - estimates from univariate analysis (NB! it's important to use the "fit" data for AIC / BIC values, not the "test" data)
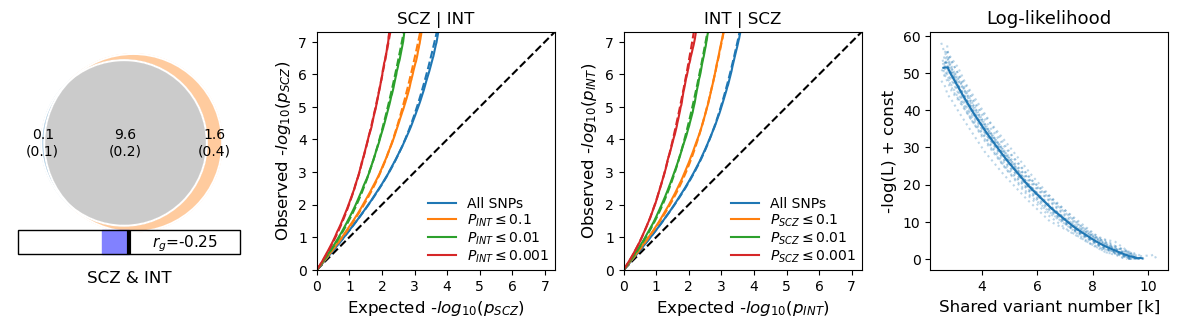
- SCZ_vs_INT.csv - estimates from bivariate analysis
- SCZ_vs_INT.png - venn diagram, stratified QQ plots, likelihood figure
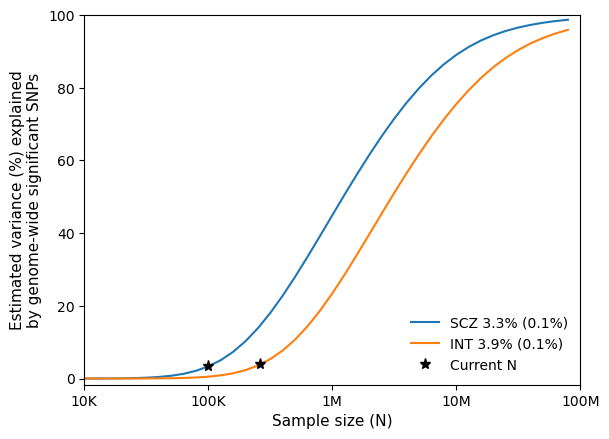
- SCZ_and_INT.test.power.png - power curve for SCZ and INT