-
Notifications
You must be signed in to change notification settings - Fork 1
/
Copy pathREADME.Rmd
247 lines (185 loc) · 10.2 KB
/
README.Rmd
1
2
3
4
5
6
7
8
9
10
11
12
13
14
15
16
17
18
19
20
21
22
23
24
25
26
27
28
29
30
31
32
33
34
35
36
37
38
39
40
41
42
43
44
45
46
47
48
49
50
51
52
53
54
55
56
57
58
59
60
61
62
63
64
65
66
67
68
69
70
71
72
73
74
75
76
77
78
79
80
81
82
83
84
85
86
87
88
89
90
91
92
93
94
95
96
97
98
99
100
101
102
103
104
105
106
107
108
109
110
111
112
113
114
115
116
117
118
119
120
121
122
123
124
125
126
127
128
129
130
131
132
133
134
135
136
137
138
139
140
141
142
143
144
145
146
147
148
149
150
151
152
153
154
155
156
157
158
159
160
161
162
163
164
165
166
167
168
169
170
171
172
173
174
175
176
177
178
179
180
181
182
183
184
185
186
187
188
189
190
191
192
193
194
195
196
197
198
199
200
201
202
203
204
205
206
207
208
209
210
211
212
213
214
215
216
217
218
219
220
221
222
223
224
225
226
227
228
229
230
231
232
233
234
235
236
237
238
239
240
241
242
243
244
245
246
---
title: "basictabler"
output: github_document
---
```{r setup, include=FALSE}
knitr::opts_chunk$set(echo = TRUE)
```
[](https://github.com/cbailiss/basictabler/actions)
[](https://cran.r-project.org/package=basictabler)
The `basictabler` package enables rich tables to be created and rendered/exported with just a few lines of R.
The `basictabler` package:
- Provides an easy way of creating basic tables, especially from data frames and matrices.
- Provides flexibility so that the structure/content of the table can be easily built/modified.
- Provides formatting options to simplify rendering/exporting data.
- Provides styling options so the tables can be themed/branded as needed.
The tables are rendered as htmlwidgets or plain text. The HTML/text can be exported for use outside of R.
The tables can also be exported to Excel, including the styling/formatting. The formatting/styling is specified once and can then be used when rendering to both HTML and Excel - i.e. it is not necessary to specify the formatting/styling separately for each output format.
Using the `flextabler` package it is also possible to output tables to Word and PowerPoint.
`basictabler` is a companion package to the `pivottabler` package. `pivottabler` is focussed on generating pivot tables and can aggregate data. `basictabler` does not aggregate data but offers more control of table structure.
For more information see http://www.basictabler.org.uk/.
### Installation
You can install:
* the latest released version from CRAN with
```{r eval=FALSE}
install.packages("basictabler")
```
* the latest development version from github with
```{r eval=FALSE}
devtools::install_github("cbailiss/basictabler", build_vignettes = TRUE)
```
### Examples
#### Trivial Example
Creating a tiny HTML table from a data frame and immediately rendering it as a htmlwidget:
```{r, message=FALSE, warning=FALSE, eval=FALSE, comment=""}
library(basictabler)
qhtbl(data.frame(a=1:2, b=3:4))
```
#### Another Example
Creating a table from a data frame, specifying column names and value formats:
```{r eval=FALSE}
# aggregate the sample data to make a small data frame
library(basictabler)
library(dplyr)
tocsummary <- bhmsummary %>%
group_by(TOC) %>%
summarise(OnTimeArrivals=sum(OnTimeArrivals),
OnTimeDepartures=sum(OnTimeDepartures),
TotalTrains=sum(TrainCount)) %>%
ungroup() %>%
mutate(OnTimeArrivalPercent=OnTimeArrivals/TotalTrains*100,
OnTimeDeparturePercent=OnTimeDepartures/TotalTrains*100) %>%
arrange(TOC)
# To specify formatting, a list is created which contains one element for each column in
# the data frame, i.e. tocsummary contains six columns so the columnFormats list has six elements.
# The values in the first column in the data frame won't be formatted since NULL has been specified.
# The values in the 2nd, 3rd and 4th columns will be formatted using format(value, big.mark=",")
# The values in the 5th and 6th columns will be formatted using sprintf(value, "%.1f")
columnFormats=list(NULL, list(big.mark=","), list(big.mark=","), list(big.mark=","), "%.1f", "%.1f")
# render the table directly as a html widget
qhtbl(tocsummary, firstColumnAsRowHeaders=TRUE,
explicitColumnHeaders=c("TOC", "On-Time Arrivals", "On-Time Departures",
"Total Trains", "On-Time Arrival %", "On-Time Departure %"),
columnFormats=columnFormats)
```
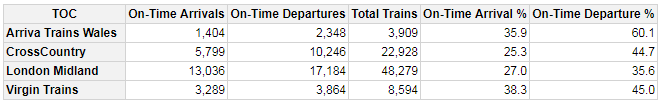
In the example above, the `qhtbl()` functions returns a html widget that is rendered immediately in the R-Studio viewer window. An alternative is to use the `qtbl()` function which returns a BasicTable object that can be further manipulated. The styling example further below demonstrates this.
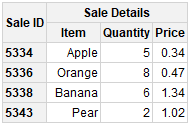
#### Changing a Table Example
Tables can also be built row-by-row, column-by-column and cell-by-cell. Once built tables can be modified (adding/removing rows columns and cells, merging cells and changing styling). The following example shows more granular ways of building and changing a table:
```{r eval=FALSE}
# data for the table
saleIds <- c(5334, 5336, 5338)
items <- c("Apple", "Orange", "Banana")
quantities <- c(5, 8, 6)
prices <- c(0.34452354, 0.4732543, 1.3443243)
# construct a table column by column
library(basictabler)
tbl <- BasicTable$new()
tbl$cells$setCell(1, 1, cellType="root", rawValue="Sale ID")
tbl$cells$setCell(1, 2, cellType="columnHeader", rawValue="Item")
tbl$cells$setCell(1, 3, cellType="columnHeader", rawValue="Quantity")
tbl$cells$setCell(1, 4, cellType="columnHeader", rawValue="Price")
tbl$cells$setColumn(1, cellTypes="rowHeader", rawValues=saleIds)
tbl$cells$setColumn(2, cellTypes="cell", rawValues=items)
tbl$cells$setColumn(3, cellTypes="cell", rawValues=quantities)
tbl$cells$setColumn(4, cellTypes="cell", rawValues=prices,
formats=list("%.2f"))
# example of changing the table - appending a row
formats <- list(NULL, NULL, NULL, "%.2f")
cellTypes=c("rowHeader", "cell", "cell", "cell")
tbl$cells$setRow(5, cellTypes=cellTypes, formats=formats,
rawValues=list(5343, "Pear", 2, 1.0213424))
# example of changing the table - inserting a row
tbl$cells$insertRow(1)
tbl$cells$setRow(1, cellTypes="columnHeader",
rawValues=list("Sale ID", "Sale Details", "", ""))
# example of changing the table - merging some cells
tbl$mergeCells(rFrom=1, cFrom=1, rSpan=2, cSpan=1)
tbl$mergeCells(rFrom=1, cFrom=2, rSpan=1, cSpan=3)
# render the final table
tbl$renderTable()
```
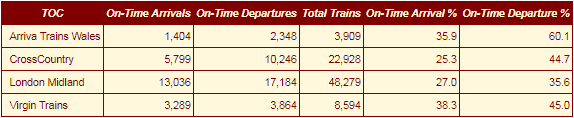
#### Styling Example
Styling can be specified when creating tables:
```{r eval=FALSE}
# aggregate the sample data to make a small data frame
library(basictabler)
library(dplyr)
tocsummary <- bhmsummary %>%
group_by(TOC) %>%
summarise(OnTimeArrivals=sum(OnTimeArrivals),
OnTimeDepartures=sum(OnTimeDepartures),
TotalTrains=sum(TrainCount)) %>%
ungroup() %>%
mutate(OnTimeArrivalPercent=OnTimeArrivals/TotalTrains*100,
OnTimeDeparturePercent=OnTimeDepartures/TotalTrains*100) %>%
arrange(TOC)
# column formats
columnFormats=list(NULL, list(big.mark=","), list(big.mark=","), list(big.mark=","), "%.1f", "%.1f")
# create the table
tbl <- qtbl(tocsummary, firstColumnAsRowHeaders=FALSE,
explicitColumnHeaders=c("TOC", "On-Time Arrivals", "On-Time Departures",
"Total Trains", "On-Time Arrival %", "On-Time Departure %"),
columnFormats=columnFormats,
tableStyle=list("border-color"="maroon"),
headingStyle=list("color"="cornsilk", "background-color"="maroon",
"font-style"="italic", "border-color"="maroon"),
cellStyle=list("color"="maroon", "background-color"="cornsilk",
"border-color"="maroon"))
# set column alignment of first column
# the arguments are (rFrom, cFrom, rTo, cTo, declarations)
tbl$setStyling(2, 1, 5, 1, declarations=list("text-align"="left"))
# render table
tbl$renderTable()
```
#### Excel Output
The same styling/formatting used for the HTML output is also used when outputting to Excel - greatly reducing the amount of script that needs to be written to create Excel output. The only additional formatting that typically needs applying is the Excel cell format strings.
```{r eval=FALSE}
# aggregate the sample data to make a small data frame
library(basictabler)
library(dplyr)
tocsummary <- bhmsummary %>%
group_by(TOC) %>%
summarise(OnTimeArrivals=sum(OnTimeArrivals),
OnTimeDepartures=sum(OnTimeDepartures),
TotalTrains=sum(TrainCount)) %>%
ungroup() %>%
mutate(OnTimeArrivalPercent=OnTimeArrivals/TotalTrains*100,
OnTimeDeparturePercent=OnTimeDepartures/TotalTrains*100) %>%
arrange(TOC)
columnFormats=list(NULL, list(big.mark=","), list(big.mark=","), list(big.mark=","), "%.1f", "%.1f")
# create the table
tbl <- qtbl(tocsummary, firstColumnAsRowHeaders=TRUE,
explicitColumnHeaders=c("TOC", "On-Time Arrivals", "On-Time Departures",
"Total Trains", "On-Time Arrival %", "On-Time Departure %"),
columnFormats=columnFormats)
# set the styling on the count cells
# the arguments are (rFrom, cFrom, rTo, cTo, declarations)
tbl$setStyling(2, 2, 5, 4, declarations=list("xl-value-format"="#,##0"))
# set the styling on the average delay cells
tbl$setStyling(2, 5, 5, 6, declarations=list("xl-value-format"="##0.0"))
# render the table to an Excel workbook
library(openxlsx)
wb <- createWorkbook(creator = Sys.getenv("USERNAME"))
addWorksheet(wb, "Data")
tbl$writeToExcelWorksheet(wb=wb, wsName="Data",
topRowNumber=2, leftMostColumnNumber=2, applyStyles=TRUE)
saveWorkbook(wb, file="C:\\test.xlsx", overwrite = TRUE)
```
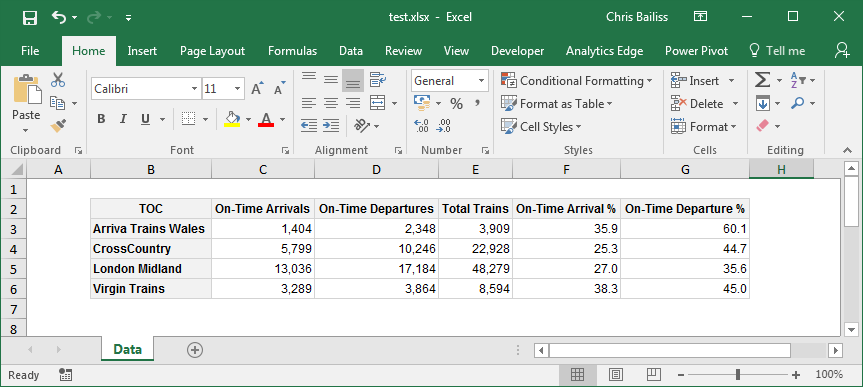
In the screenshot above, Gridlines have been made invisible to make the styling easier to see (by clearing the checkbox on the 'View' ribbon). Columns were also auto-sized - though the widths of columns could also be manually specified from R. See the Excel Export vignette for more details.
### More Information
It is possible to create tables from data frames, matrices, row-by-row, column-by-column and/or cell-by-cell.
Tables can be further manipulated once created, including adding/removing cells/rows/columns and merging cells.
Styling and formatting can be specified for individual cells and ranges of cells.
See the package vignettes for more information:
```{r eval=FALSE}
# to see a list of available package vignettes:
vignette(package="basictabler")
# to open a specific vignette
vignette(topic="v01-introduction", package="basictabler")
```
The vignettes can also be read on CRAN at:
https://cran.r-project.org/package=basictabler